This document provides an overview of cost-volume-profit (CVP) analysis for Wind Bicycle Co. It includes:
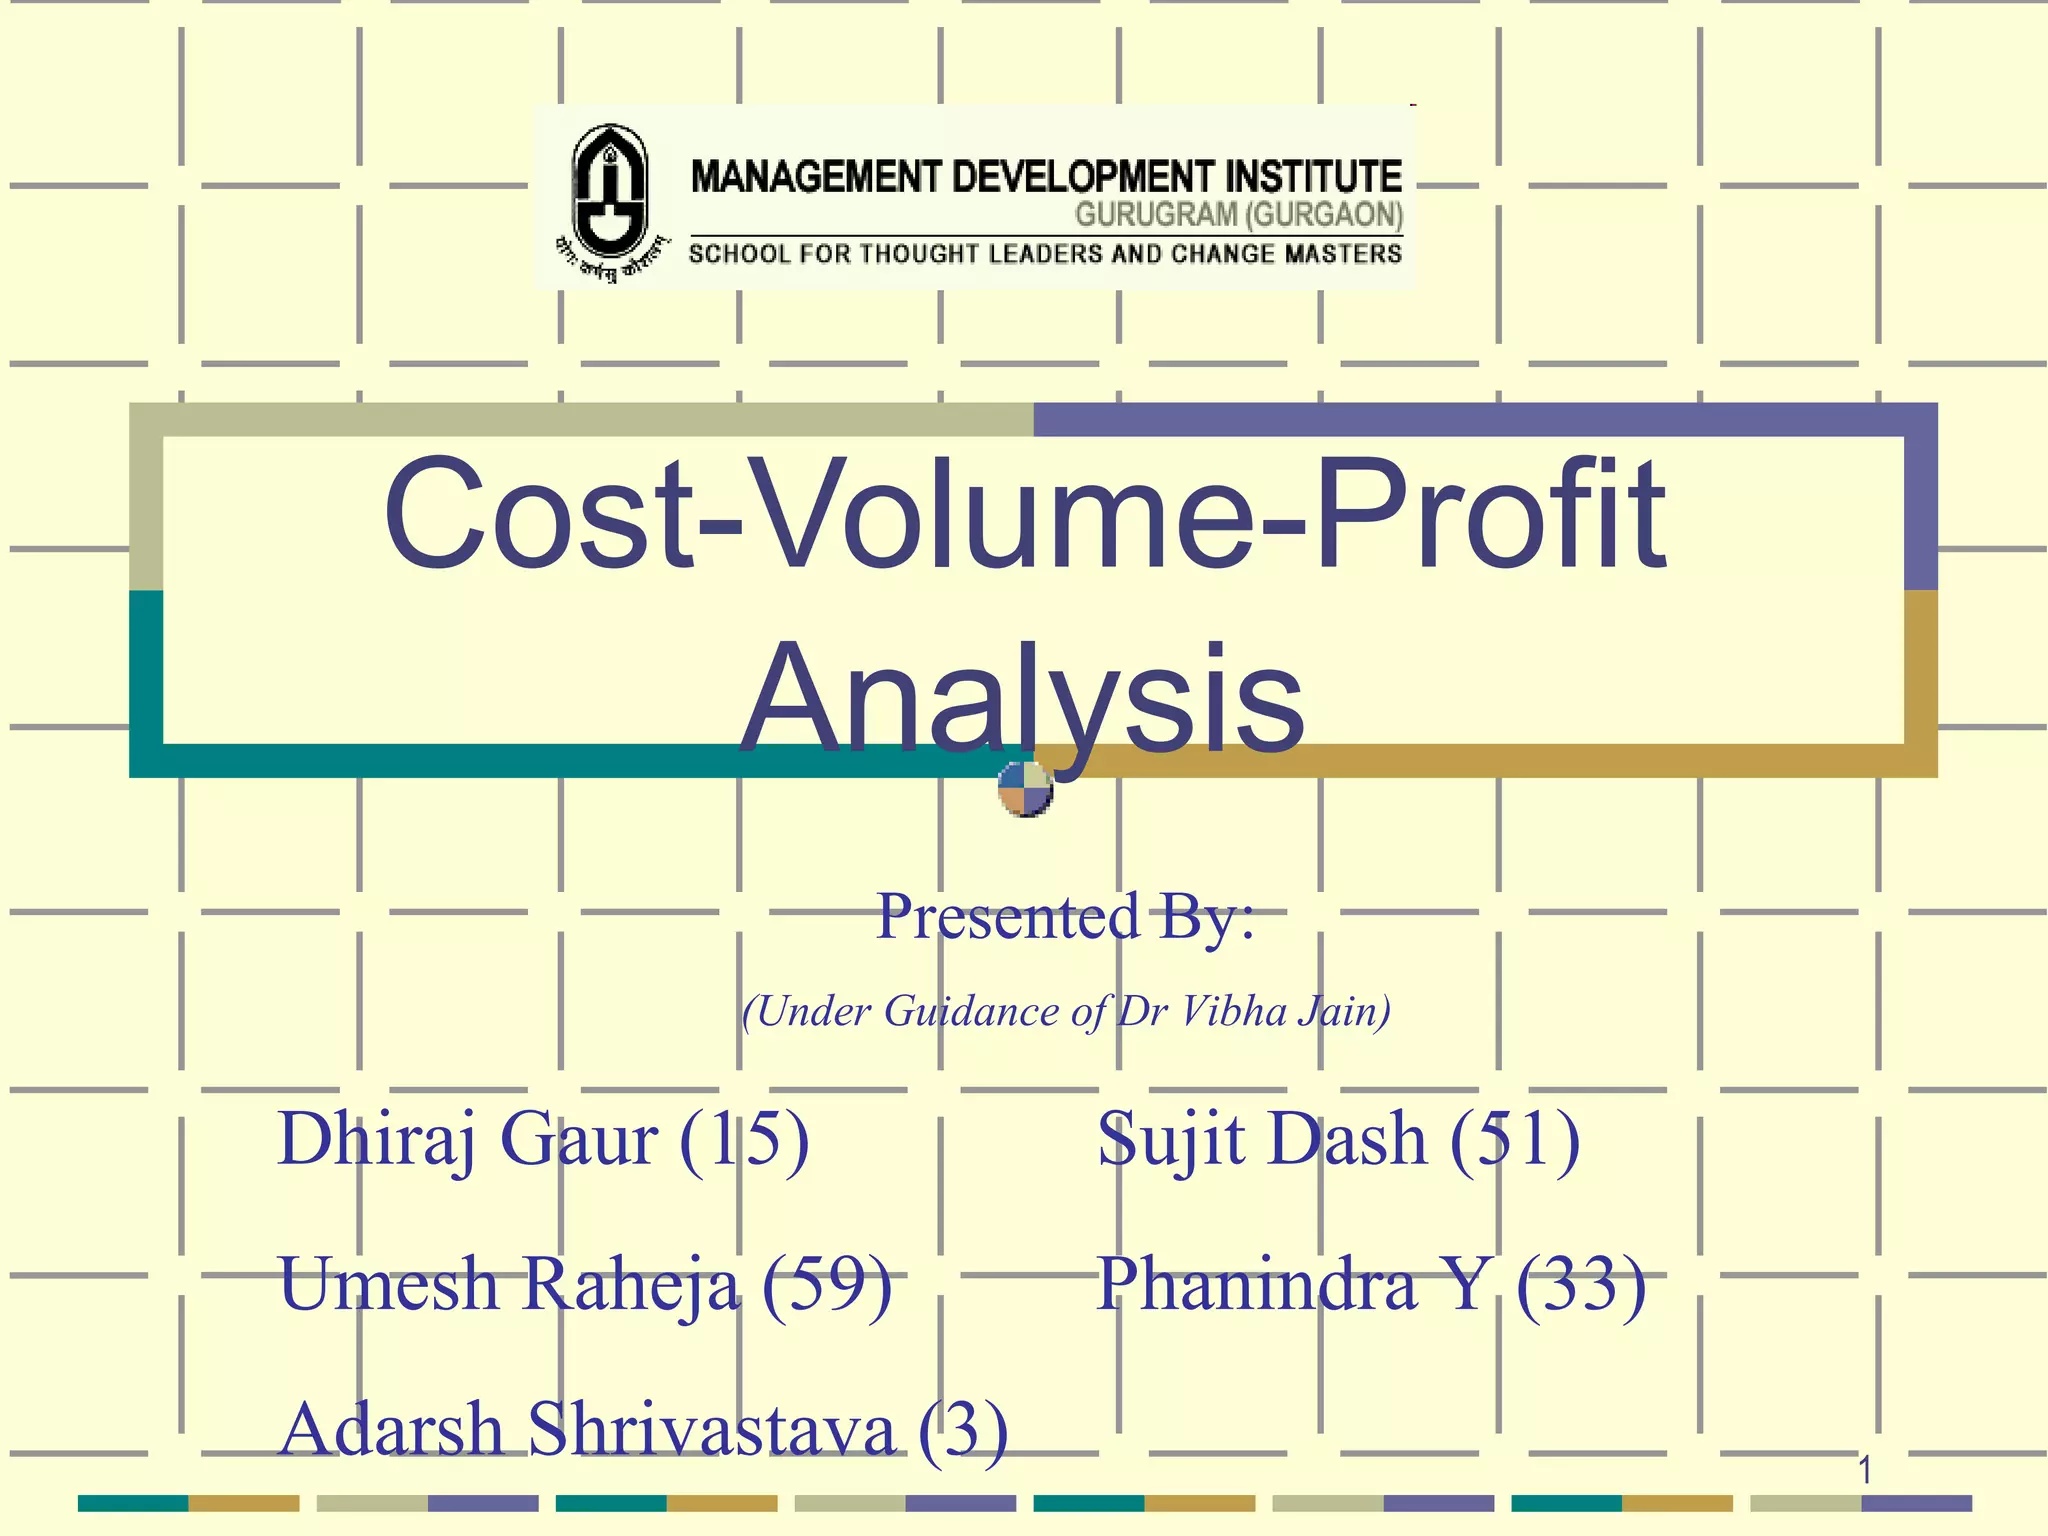
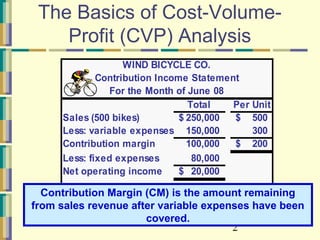
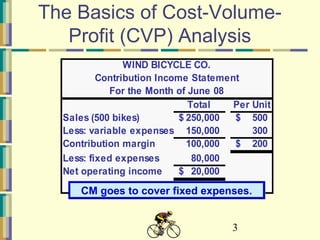
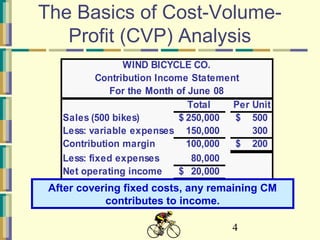
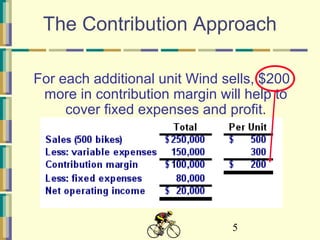
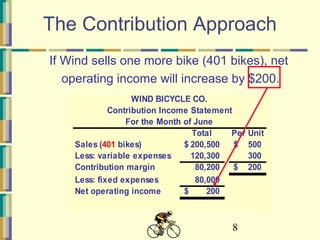
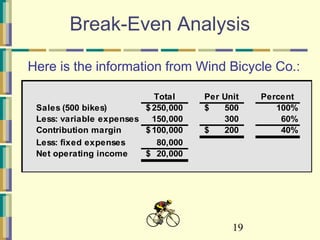
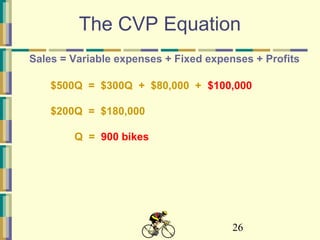
1) An income statement showing contribution margin of $200 per unit after accounting for $300 in variable costs per unit and total fixed costs of $80,000.
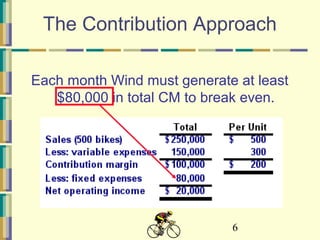
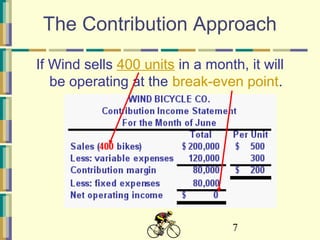
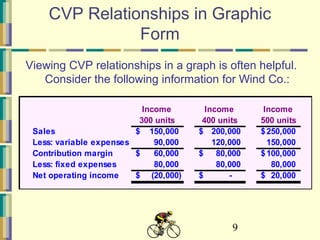
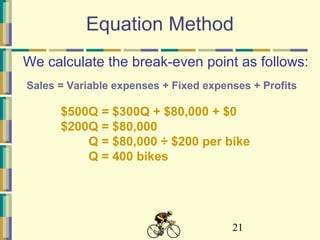
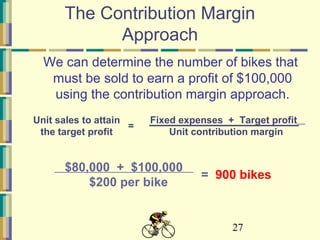
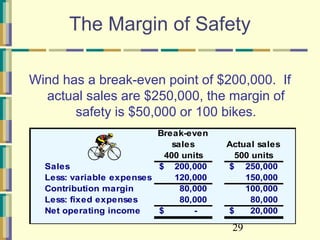
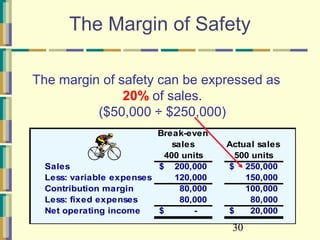
2) Explanations and examples of how contribution margin is used to cover fixed costs and contribute to profit. The break-even point is calculated as 400 units when fixed costs equal contribution margin.
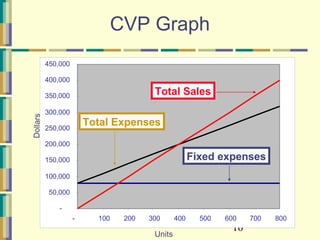
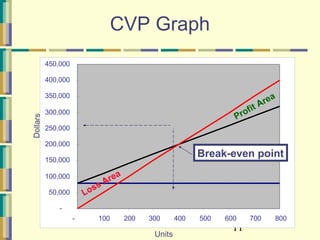
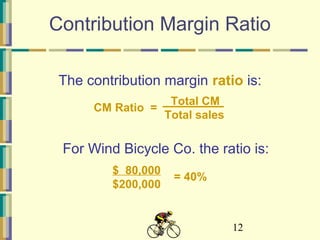
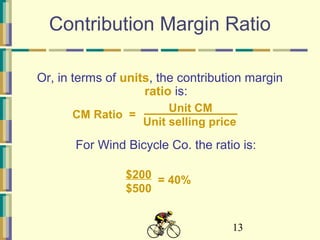
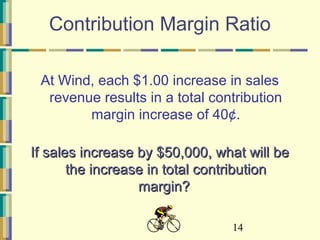
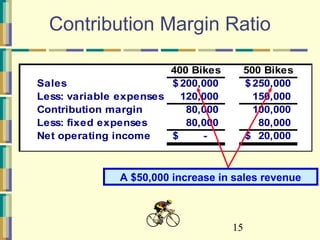
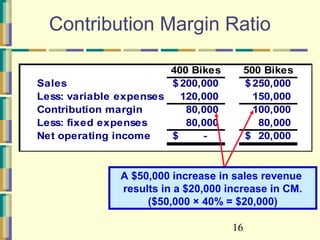
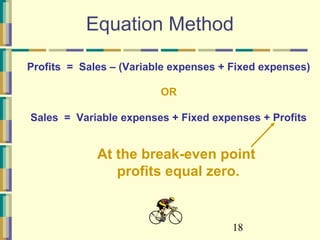
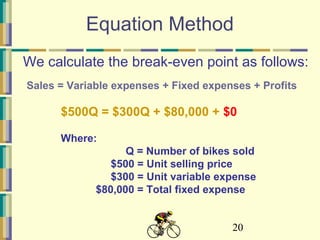
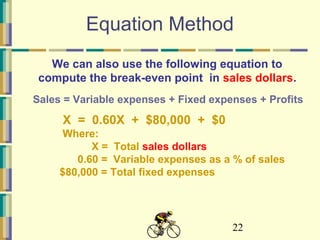
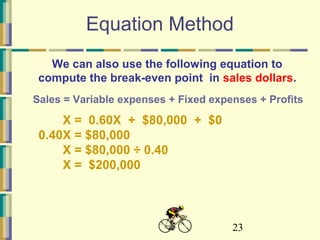
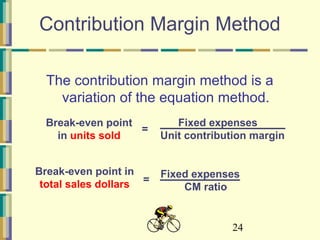
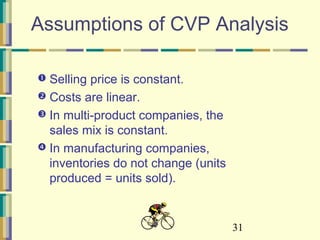
3) Demonstrations of using the contribution margin ratio, equation method, and graphical analysis to calculate break-even points and how sales volume impacts profits.