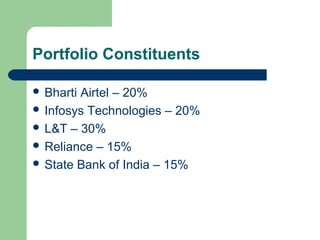
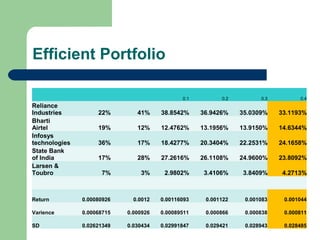
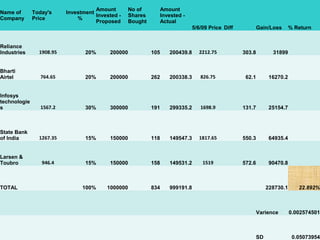
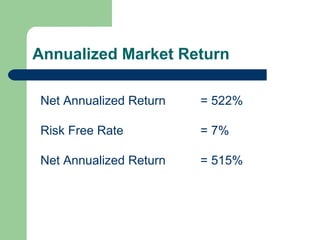
- The document describes an investment portfolio consisting of Bharti Airtel, Infosys, L&T, Reliance, and State Bank of India, making up 20%, 20%, 30%, 15%, and 15% of the portfolio respectively.
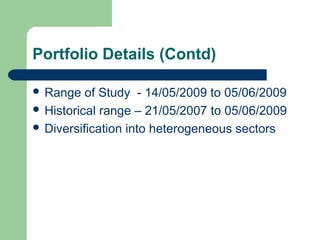
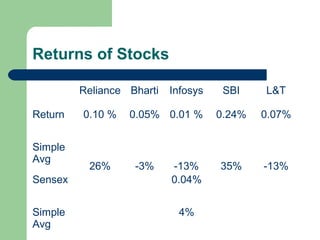
- It provides the returns of each stock and the portfolio from May 14, 2009 to June 5, 2009 and compares it to historical and Sensex returns.
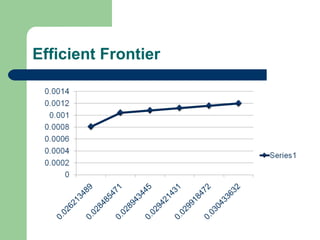
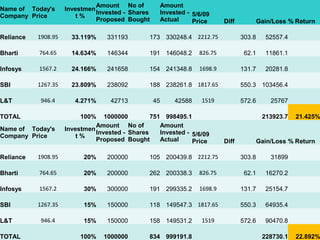
- Tables show the efficient portfolio allocation across a range of 0.1 to 0.4 and the efficient frontier. Additional ratios like Sharpe, Treynor, and Jensen's Alpha are provided.
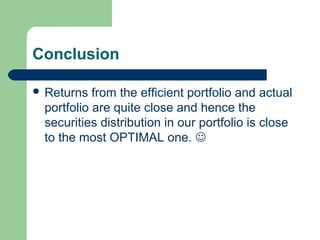
- The annualized market return is 522% while the risk free rate is 7%,