Download to read offline


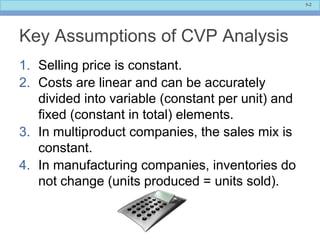
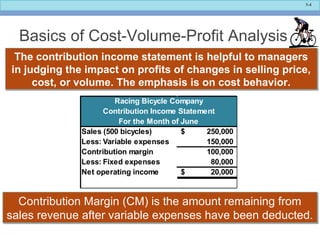
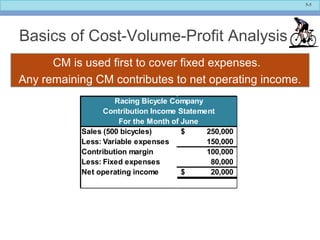
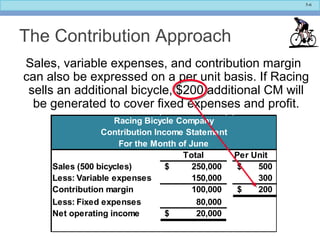
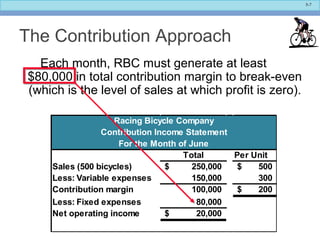
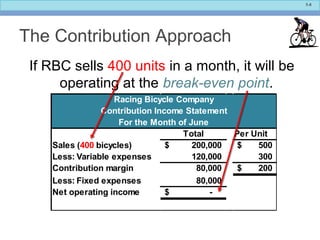
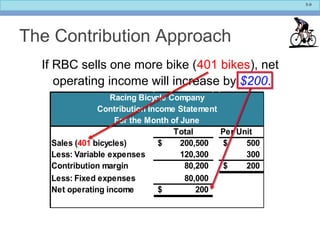
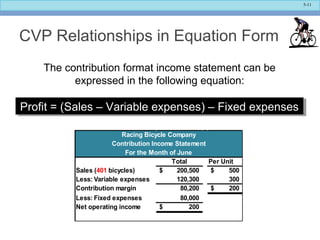
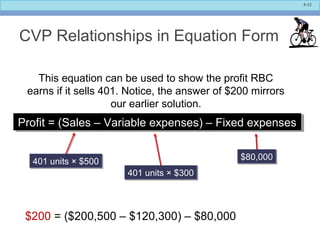
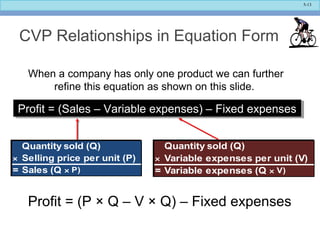
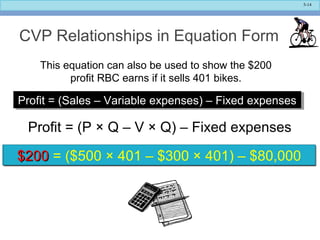
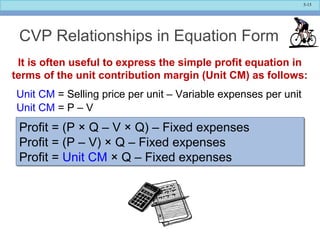
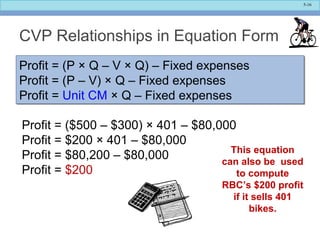
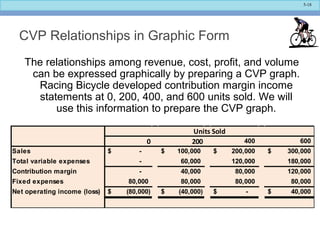
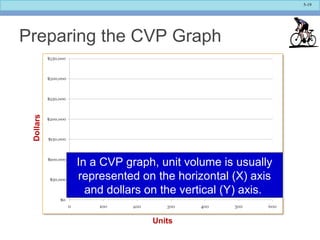
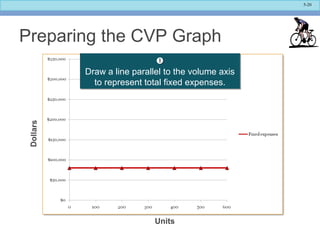
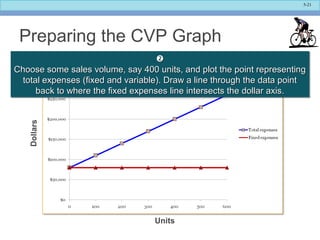
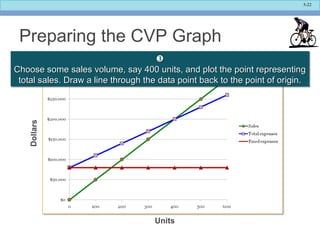
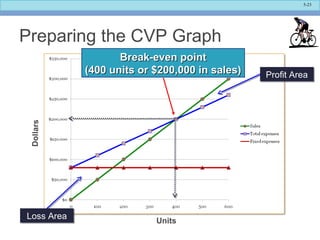
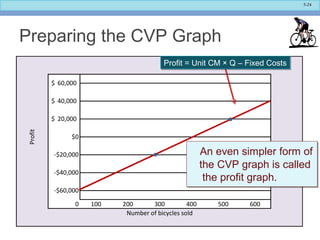
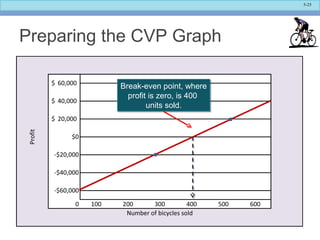
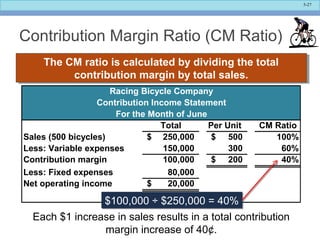
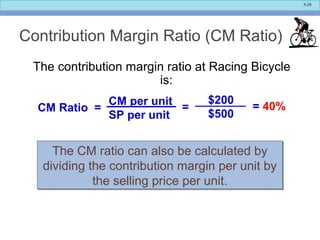
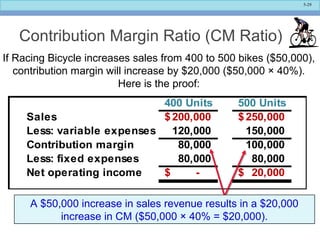
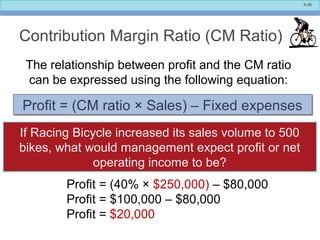
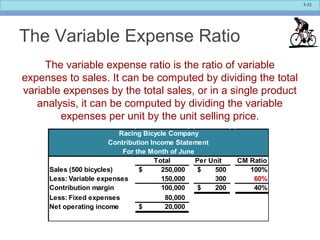
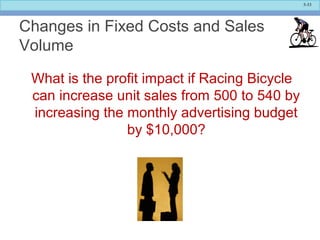
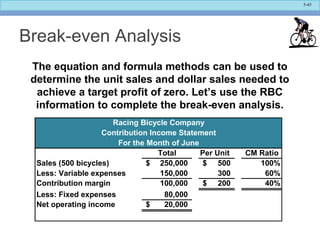

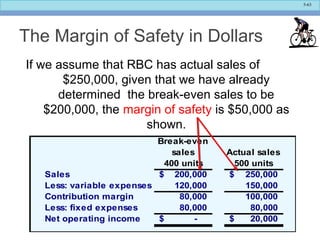
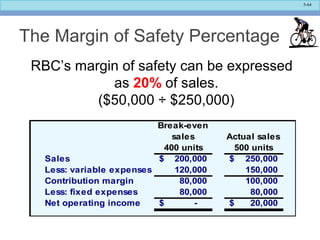
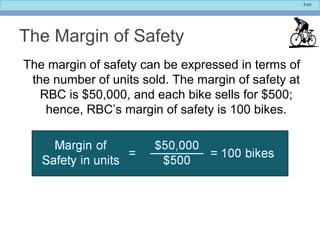


The document discusses cost-volume-profit (CVP) analysis and relationships. It begins by outlining key assumptions of CVP analysis and then provides examples of CVP relationships using a hypothetical company called Racing Bicycle Company. It shows Racing Bicycle's contribution margin income statement and expresses CVP relationships in equation and graphic forms. Specifically, it demonstrates how to prepare a CVP graph using data from Racing Bicycle's income statements at different sales volumes. The CVP graph illustrates the break-even point and profit/loss areas based on sales volume.


