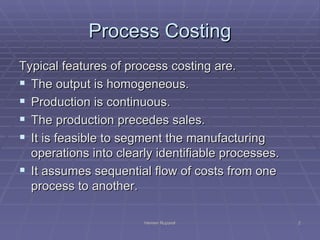
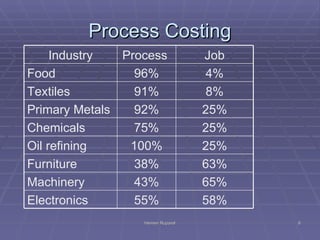
Process costing is used when production is continuous and outputs are homogeneous. Costs are accumulated over multiple processes and time periods, then divided by total units to calculate average unit costs. Key differences from job costing include homogeneous outputs, sequential cost flows between processes, and inventory accumulating between processes. Costs are calculated periodically rather than by individual jobs.
Process costing explained with examples free of cost .It is for students of managerial accounting ,read this to quickly go through process costing.
http://www.brightscholarships.com
Twitter @scholarshipskys
This power point presentation related to process costing. which is useful to students who studying B.com, BBA,M.COM MBA etc.
It involves short notes on definition of process costing,its features,applications,difference between process costing and job costing, advantages and disadvantageous of process costing, procedure of process costing,format of process account, process losses and abnormal gain.
A power point presentation describing some basic definitions, father of cost accounting, Indian aspect of cost accounting and Various Methods and Techniques of costing.
Presented by: Aquib Ali, Ajay Gupta and Ashwin Showi. (M.Com students)
at the Bhopal School of Social Sciences(BSSS) on 6 September, 2017
In this slide presentation you will be introduced to the methods of Cost Accounting and why business organizations should follow methods of cost accounting impeccably. In this it is important to establish budget and actual cost of operations, processes, departments or products and the analysis of variances, profitability or social use of funds. This Slideshare will offer insight to entrepreneurs.
To know more about Welingkar School’s Distance Learning Program and courses offered, visit:
http://www.welingkaronline.org/distance-learning/online-mba.html
This Slideshare is the sole Property of the Welingkar School of Distance Learning – Reproduction of this material , without prior consent, either wholly or partially will treated as a violation of copyright.
| Managerial Accounting | Chapter 4 | Systems Design: Process Costing | Intro...Ahmad Hassan
Chapter 4: systems design: process costing – types of costing systems used to determine product costs, differences between job-order and process costing, sequential processing departments, parallel processing departments, flow of materials, labor and overhead costs, materials, labor and overhead costs entries, equivalent units of production, weighted average method, production report, product report example.
ACG 2071 Managerial Accounting Process Costing Systems .docxbobbywlane695641
ACG 2071 Managerial Accounting
Process Costing Systems
Minicase
PROCESS COSTING PROBLEM
Spectre Chemicals produces Zaloff in a two department process. Information on the two
departments for March and April, 2011 are as follows:
March 2011:
Department 1: The company had beginning inventory of 6,000 units, 40% completed with a
cost of $45,000. During the month, the department transferred in 22,000 units of the direct
materials with a cost of $10 per unit. Ending inventory was 7,000 units, 30% completed.
Direct labor is $310,500 and factory overhead is $103,500.
Department 2: The company had beginning inventory of 5,000 units, 70% completed with a
cost of $80,000. During the month, direct labor was $175,000 and factory overhead was
$87,500. Ending inventory was 10,000 units, 50% completed.
April 2011:
Department 1: During the month, the department transferred in 20,000 units of the direct
materials with a cost of $11 per unit. Direct labor is $209,000 and factory overhead is
$104,500. Ending inventory is 10,000 units 60% completed.
Department 2: The company had beginning inventory of 5,000 units, 70% completed with a
cost of $80,000. During the month, direct labor is $175,000 and factory overhead is
$87,500.
Required:
Compute the Equivalent Units of Production, Material costs, and Conversion costs for each
department for March and April, 2011.
Complete the attached chart – one for each department and each month
Prepare a cost of production report for March and April 2011.
ACG 2071
Process Cost Systems
Created by: M. Mari
Fall 2009-1
Page 1 of 13
Process Manufacturing
Is the mass production of products in a continuous flow
of steps
Products pass through a series of sequential processes
Each process is identified a separate production,
department, workstation, or work center.
With the exception of the first process or department,
each receives the output from the prior department as
a partially processed product.
Depending on the nature of the process, a company
applies direct labor, overhead, and additional direct
materials to move the product toward completion.
Process Cost System
Assigns direct materials, direct labor, and overhead
to specific processes.
Costs are allocated by department rather than jobs
Manufacturing costs are allocated to products based
on units of production
Manufacturing costs are accumulated and transferred
by department
The total costs associated with each process are then
divided by the number of units passing through that
process to determine the cost per equivalent units
for that process
ACG 2071
Process Cost Systems
Created by: M. Mari
Fall 2009-1
Page 2 of 13
To understand how costs are allocated, first we must decide
how the costs are accumulated. One method is First in, First
out method.
Beverage Production
Costs flow fr.
Implicitly or explicitly all competing businesses employ a strategy to select a mix
of marketing resources. Formulating such competitive strategies fundamentally
involves recognizing relationships between elements of the marketing mix (e.g.,
price and product quality), as well as assessing competitive and market conditions
(i.e., industry structure in the language of economics).
Putting the SPARK into Virtual Training.pptxCynthia Clay
This 60-minute webinar, sponsored by Adobe, was delivered for the Training Mag Network. It explored the five elements of SPARK: Storytelling, Purpose, Action, Relationships, and Kudos. Knowing how to tell a well-structured story is key to building long-term memory. Stating a clear purpose that doesn't take away from the discovery learning process is critical. Ensuring that people move from theory to practical application is imperative. Creating strong social learning is the key to commitment and engagement. Validating and affirming participants' comments is the way to create a positive learning environment.
Buy Verified PayPal Account | Buy Google 5 Star Reviewsusawebmarket
Buy Verified PayPal Account
Looking to buy verified PayPal accounts? Discover 7 expert tips for safely purchasing a verified PayPal account in 2024. Ensure security and reliability for your transactions.
PayPal Services Features-
🟢 Email Access
🟢 Bank Added
🟢 Card Verified
🟢 Full SSN Provided
🟢 Phone Number Access
🟢 Driving License Copy
🟢 Fasted Delivery
Client Satisfaction is Our First priority. Our services is very appropriate to buy. We assume that the first-rate way to purchase our offerings is to order on the website. If you have any worry in our cooperation usually You can order us on Skype or Telegram.
24/7 Hours Reply/Please Contact
usawebmarketEmail: support@usawebmarket.com
Skype: usawebmarket
Telegram: @usawebmarket
WhatsApp: +1(218) 203-5951
USA WEB MARKET is the Best Verified PayPal, Payoneer, Cash App, Skrill, Neteller, Stripe Account and SEO, SMM Service provider.100%Satisfection granted.100% replacement Granted.
Premium MEAN Stack Development Solutions for Modern BusinessesSynapseIndia
Stay ahead of the curve with our premium MEAN Stack Development Solutions. Our expert developers utilize MongoDB, Express.js, AngularJS, and Node.js to create modern and responsive web applications. Trust us for cutting-edge solutions that drive your business growth and success.
Know more: https://www.synapseindia.com/technology/mean-stack-development-company.html
Personal Brand Statement:
As an Army veteran dedicated to lifelong learning, I bring a disciplined, strategic mindset to my pursuits. I am constantly expanding my knowledge to innovate and lead effectively. My journey is driven by a commitment to excellence, and to make a meaningful impact in the world.
3.0 Project 2_ Developing My Brand Identity Kit.pptxtanyjahb
A personal brand exploration presentation summarizes an individual's unique qualities and goals, covering strengths, values, passions, and target audience. It helps individuals understand what makes them stand out, their desired image, and how they aim to achieve it.
LA HUG - Video Testimonials with Chynna Morgan - June 2024Lital Barkan
Have you ever heard that user-generated content or video testimonials can take your brand to the next level? We will explore how you can effectively use video testimonials to leverage and boost your sales, content strategy, and increase your CRM data.🤯
We will dig deeper into:
1. How to capture video testimonials that convert from your audience 🎥
2. How to leverage your testimonials to boost your sales 💲
3. How you can capture more CRM data to understand your audience better through video testimonials. 📊
Understanding User Needs and Satisfying ThemAggregage
https://www.productmanagementtoday.com/frs/26903918/understanding-user-needs-and-satisfying-them
We know we want to create products which our customers find to be valuable. Whether we label it as customer-centric or product-led depends on how long we've been doing product management. There are three challenges we face when doing this. The obvious challenge is figuring out what our users need; the non-obvious challenges are in creating a shared understanding of those needs and in sensing if what we're doing is meeting those needs.
In this webinar, we won't focus on the research methods for discovering user-needs. We will focus on synthesis of the needs we discover, communication and alignment tools, and how we operationalize addressing those needs.
Industry expert Scott Sehlhorst will:
• Introduce a taxonomy for user goals with real world examples
• Present the Onion Diagram, a tool for contextualizing task-level goals
• Illustrate how customer journey maps capture activity-level and task-level goals
• Demonstrate the best approach to selection and prioritization of user-goals to address
• Highlight the crucial benchmarks, observable changes, in ensuring fulfillment of customer needs
[Note: This is a partial preview. To download this presentation, visit:
https://www.oeconsulting.com.sg/training-presentations]
Sustainability has become an increasingly critical topic as the world recognizes the need to protect our planet and its resources for future generations. Sustainability means meeting our current needs without compromising the ability of future generations to meet theirs. It involves long-term planning and consideration of the consequences of our actions. The goal is to create strategies that ensure the long-term viability of People, Planet, and Profit.
Leading companies such as Nike, Toyota, and Siemens are prioritizing sustainable innovation in their business models, setting an example for others to follow. In this Sustainability training presentation, you will learn key concepts, principles, and practices of sustainability applicable across industries. This training aims to create awareness and educate employees, senior executives, consultants, and other key stakeholders, including investors, policymakers, and supply chain partners, on the importance and implementation of sustainability.
LEARNING OBJECTIVES
1. Develop a comprehensive understanding of the fundamental principles and concepts that form the foundation of sustainability within corporate environments.
2. Explore the sustainability implementation model, focusing on effective measures and reporting strategies to track and communicate sustainability efforts.
3. Identify and define best practices and critical success factors essential for achieving sustainability goals within organizations.
CONTENTS
1. Introduction and Key Concepts of Sustainability
2. Principles and Practices of Sustainability
3. Measures and Reporting in Sustainability
4. Sustainability Implementation & Best Practices
To download the complete presentation, visit: https://www.oeconsulting.com.sg/training-presentations
2. Process Costing
Typical features of process costing are.
The output is homogeneous.
Production is continuous.
The production precedes sales.
It is feasible to segment the manufacturing
operations into clearly identifiable processes.
It assumes sequential flow of costs from one
process to another.
Hemen Ruparel 2
3. Process Costing v/s
Job Costing
Job costing is used Process Costing is
when the cost object generally used for a
is an individual (or a mass of identical
lot/batch) unit of a product or service.
distinct product or The Costs are
service accumulated in a
Costs can be period. The total costs
in a period are divided
accumulated by each
over the number of
individual product or units to get an
service average unit cost.
Hemen Ruparel 3
4. Process Costing v/s
Job Costing
Job costing is done Costs are compiled for
against a specific each process over time.
order being produced. Costs are calculated at
the end of a cost period
Costs are calculated like an accounting year.
when a job is over. Transfer of costs from
There are usually no one process to another is
transfers of costs made as the product
from one job to moves from one process
to the other.
another.
Hemen Ruparel 4
5. Process Costing v/s
Job Costing
There is more paper It has lesser paper
work. work.
There is little or no There is regular and
inventory. significant inventory.
It is less amenable to It is more amenable
mechanization & to mechanization &
automation. automation.
Hemen Ruparel 5
6. Process Costing
Industry Process Job
Food 96% 4%
Textiles 91% 8%
Primary Metals 92% 25%
Chemicals 75% 25%
Oil refining 100% 25%
Furniture 38% 63%
Machinery 43% 65%
Electronics 55% 58%
Hemen Ruparel 6
7. Process Costing
Service Sector eg.
Compute the costs to process 100000 Fixed
Deposit Receipt Applications in a Bank.
Compute the costs to serve Customers in a
Call Centre.
Merchandizing Sector eg.
Compute the costs to serve Coke in
McDonalds.
Hemen Ruparel 7
8. Process Costing
Raw material Process 1
Process 1 Process 2
Process 2 Process 3
Process 3 Finished Goods
Hemen Ruparel 8
9. Process Costing
Raw Material (Inputs) Add Finished
Conversion Goods of
Costs Process 1
Finished Goods of Add Finished
Process 1= Raw Conversion Goods of
Material of Process 2 Costs Process 2
Finished Goods of Add Finished
Process 2= Raw Conversion Goods
Material of Process 3 Costs (Output)
Hemen Ruparel 9
10. Process Costing
Materials: The raw material is taken at the cost
value for each process.
Wages: The wages on each process are traced
clearly and allocated to that process.
Direct expenses: The direct expenses of each
process are traced clearly and allocated to that
process.
Indirect expenses: They are allocated to each
process at predetermined rates.
Hemen Ruparel 10
11. Process Costing
A product passes through process A & process
B. In June 1500 units are made. There was no
WIP neither at the beginning nor at the end of
the month. The cost structure is as below:
Direct Costs Process A Process B
Material 90000 75000
Labor 75000 150000
Expenses 15000 18000
The Indirect Expenses worth 60000 are
apportioned on the basis of Direct Labor Costs.
Hemen Ruparel 11
12. Process Costing
Process A
Direct Material 90000 Transfer to 200000
Direct Labor 75000 Process B
Direct Expenses 15000
Indirect Expenses 20000
Process B
Transfer from Process A 200000 Transfer to 483000
Direct Material 75000 Finished
Goods
Direct Labor 150000
Direct Expenses 18000
Indirect Expenses 40000
Hemen Ruparel 12
13. Process Costing
Cost per Unit of Process A = 200000/1500
= 133.33
Cost per Unit of Process B = 483000/1500
= 322.00
Direct Material Cost per Unit = (90000+75000) / 1500 = 110
Direct Labor Cost per Unit = (75000+150000) / 1500=150
Direct Expenses Cost per Unit = (15000+18000) / 1500 = 22
Indirect Expense Cost per Unit = (60000) / 1500 = 40
Total Costs = 322
Hemen Ruparel 13
14. Process Costing
When there is Work In Progress Inventory at the end of the
period, they are converted into equivalent completed
units.
E.g. 100 units of WiP which is 40% complete is considered
as equivalent to 40 completed units.
Procedure:
1. Summarize the flow of units of output.
2. Compute Output in terms o9f equivalent units.
3. Compute equivalent unit costs.
4.Summarize total costs to account for.
5. Assign total costs to completed units and to units
ending in WiP.
Hemen Ruparel 14
15. Process Costing
In Feb.’01 , the Assembly had the following data.
Beginning WiP (Feb 1,’01) = 0 units
Started in Feb.’01 = 400 units
Completed & Transferred = 175 units
Closing WiP Inventory = 225 units.
Total Costs incurred for Feb.’01
Direct Material = 32000
Conversion Costs = 18600
Total Assembly Costs = 50600
The Supervisor estimates that the WiP is about 60%
complete.
Hemen Ruparel 15
16. Process Costing
Flow of Production Step 1 Step 2
Physical Direct Conversion
Units Material Costs
Beginning WiP 0
Started in Feb.’01 to 400
account
Completed & Transferred 175 175 175
Ending WiP 225
Material 100% of 225 225
Conversion 60% of 225 135
Work Done in Feb.’01 400 310
Hemen Ruparel 16
17. Process Costing
Note that the WiP is for Full 100% of 400
units for Direct Material as the entire
material is committed at the initial stage
itself. So the equivalent units of WiP of
225 units for Direct Material is 225 units.
The Conversion Costs in the 225 of 60%
assembled units is equivalent to 135 units
of 100% complete.
Hemen Ruparel 17
18. Total Direct Conversion
Production Material Costs
Costs
Step 3 Costs incurred in 50600 32000 18600
Feb.’01
Equivalent Units of 400 310
Work Done
Step 4 Costs per equivalent Unit 80 60
Step 5 Assignment of Costs
Complete 175 units 24500 175 x 80 175 x 60
WiP (225 Units)
Direct Material 18000 225 x 80
Conversion Costs 8100 135 x 60
Total Costs 50600
Hemen Ruparel 18
19. Process Costing
In Mar.’01 , the Assembly had the following data.
Beginning WiP (Mar 1,’01) = 225 units
(100% of Materials & 60% of Conversion Costs)
Started in Mar.’01 = 275 units
Completed & Transferred = 400 units
Closing WiP Inventory = 100 units.
100% of Materials & 50% of Conversion Costs)
Total Costs for Mar.’01
WiP (Beginning) = 26100
Material 18000
Conversion Cost 8100
Direct Material Added in Mar.01 = 19800
Conversion Costs added in Mar = 16380
Total Costs to account for = 62280
Hemen Ruparel 19
20. Weighted Average Cost Method
Flow of Production Step 1 Step 2 (Equivalent Units)
(Physical Direct Conversion
Units) Material Costs
Beginning WiP 225
Started in Current Period 275
To Account For 500
Completed & Transferred 400 400 400
WiP Ending 100
(100% x 100) & (50% x 100) 100 50
Accounted For 500
Work done till date 500 450
Hemen Ruparel 20
21. Weighted Average Cost Method
Total Direct Conversi
Production Materials on Costs
Costs
Step 3 WiP Beginning 26100 18000 8100
Costs Added in Mar 36180 19800 16380
Costs incurred till date 37800 24480
Equivalent Units of Work Done 500 450
Costs per equivalent unit 75.60 54.40
Step 4 Total Cost to 62280
Account For
Hemen Ruparel 21
22. Weighted Average Cost Method
Step 5 Assignment of Costs
Completed & transferred out 400 Units 52000 400 x 75.60 400 x
54.40
WiP Ending (100 Units)
Direct Material 7560 100 x 75.60
Conversion Costs 2720 50 x
54.40
Total WiP Costs 10280
Total Costs Accounted For 62280
Hemen Ruparel 22
23. First in First Out Method
Flow of Production Step 1 Step 2 (Equivalent Units)
(Physical Units) Direct Conversion
Material Costs
Beginning WiP 225
Started in Current Period 275
To Account For 500
Completed & Transferred
From Beginning WiP 225
225x(100%-100%) & 225x(100%-60%) 0 90
Started & Completed 175 175 175
WiP Ending 100
100 x 100% & 100 x 50% 100 50
Accounted for work done 500 275 315
in current period Hemen Ruparel 23
24. First in First Out Method
Total Direct Conversi
Production Materials on Costs
Costs
Step 3 WiP Beginning 26100
Costs Added in Mar 36180 19800 16380
Equivalent Units of Work Done in Current 275 315
Period
Cost per equivalent unit of work done 72 52
Step 4 Total Cost to 62280
Account For
Hemen Ruparel 24
25. First in First Out Method
Step 5 Assignment of Costs
Completed & transferred out 400 Units
WiP Beginning (225 Units) 26100
Direct Material 0 0 x 72
Conversion Costs 4680 90 x 52
Total From Beginning WiP Costs 30780
Started & Completed in Mar.’01 (175 Units) 21700 175 x 72 175 x 52
Total Costs of Units Completed & Transferred 52480
WiP ending (100 Units)
Direct Material 7200 100 x 72
Conversion Costs 2600 50 x 52
Total WiP ending 9800
Total Costs Accounted For 62280
Hemen Ruparel 25
26. Comparison of WAC v/s FIFO Methods
WAC FIFO Difference
Cost of Units 52000 52480 + 480
completed &
transferred out
Work in 10280 9800 - 480
process,ending
Total costs 62280 62280
accounted for
Hemen Ruparel 26
27. Comparison of WAC v/s FIFO Methods
The WAC method shows lower cost of goods sold which implies
higher profits in a declining cost scenario & vice versa in an
increasing cost scenario. The direct material cost in the beginning
WIP was 80 & conversion cost was 60 as compared to 72 & 52
respectively in the current period. Thus, WAC method smoothes out
the cost per equivalent unit by assuming that more of the lower cost
units are completed & transferred out & some higher cost units are
placed in ending WiP.
This can be material when
the direct material costs & conversion costs vary significantly between
periods
The physical inventory level of WiP is large vis-a-vis the total no. of units
transferred out
Hemen Ruparel 27
28. Comparison of WAC v/s FIFO Methods
FIFO method does not merge the costs between the periods & so
helps period to period comparison of costs.
WAC method is simpler in computation & is more representative of
the avg. unit cost as compared to FIFO.
Hemen Ruparel 28