Download as PDF, PPTX

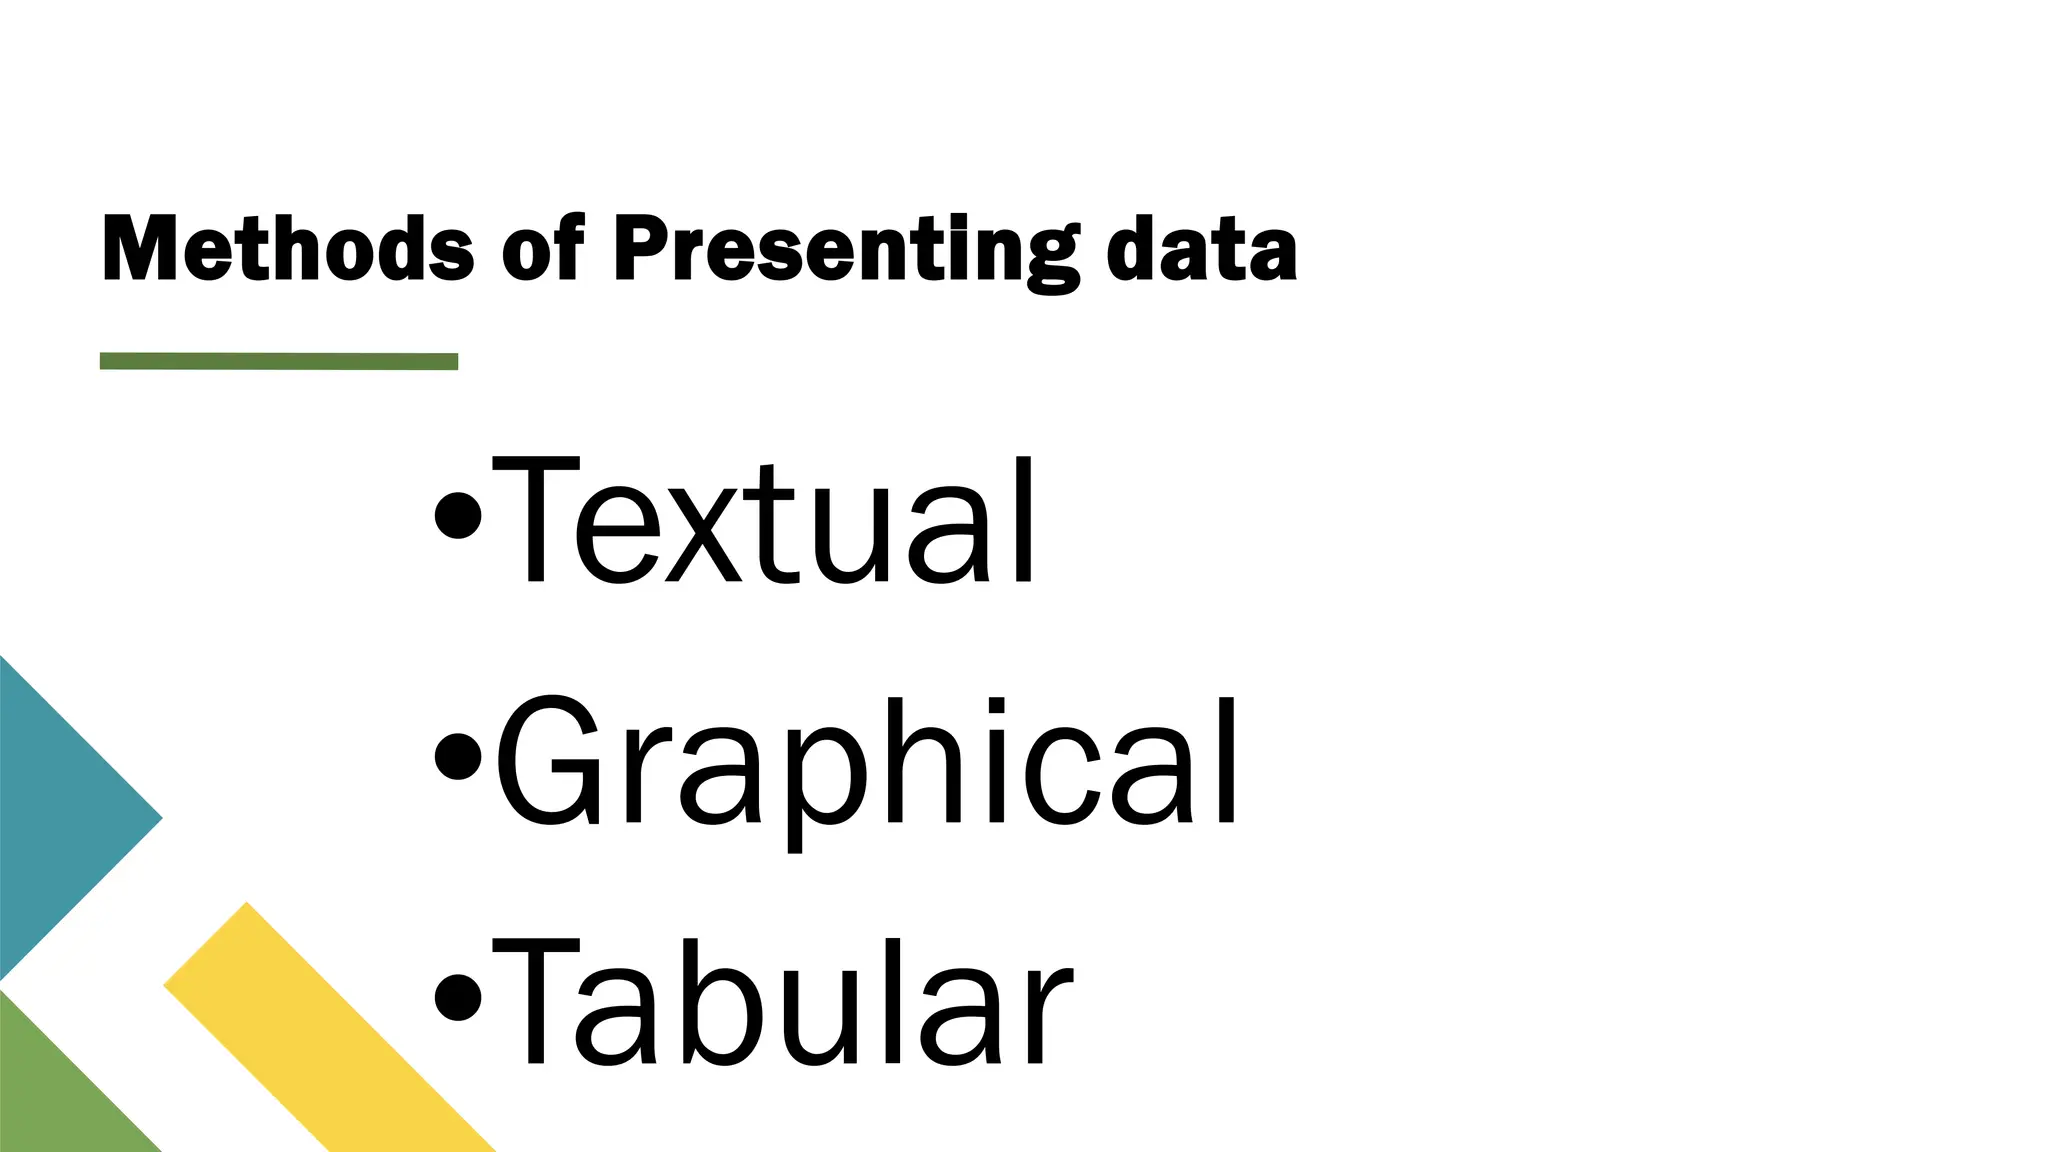
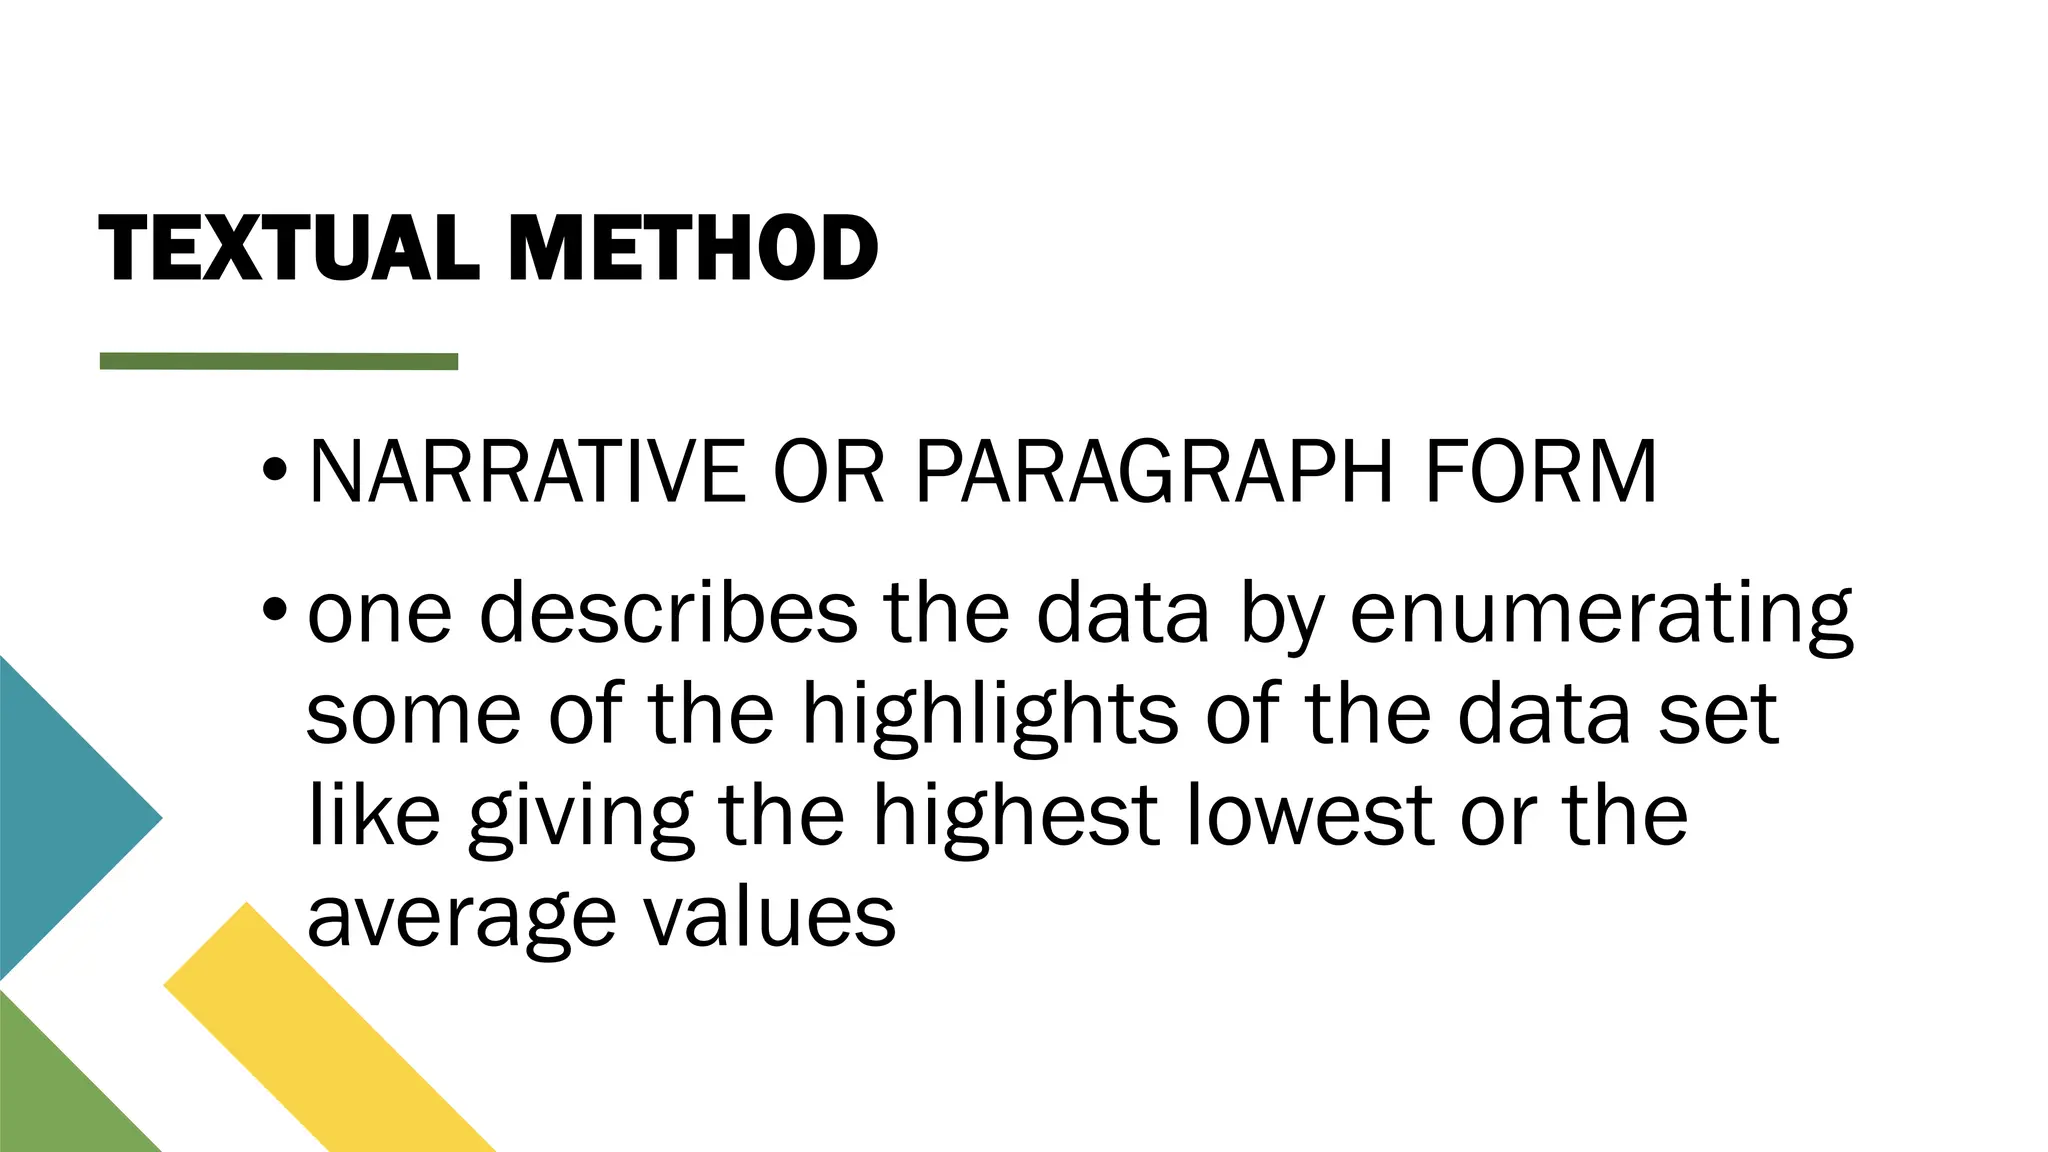
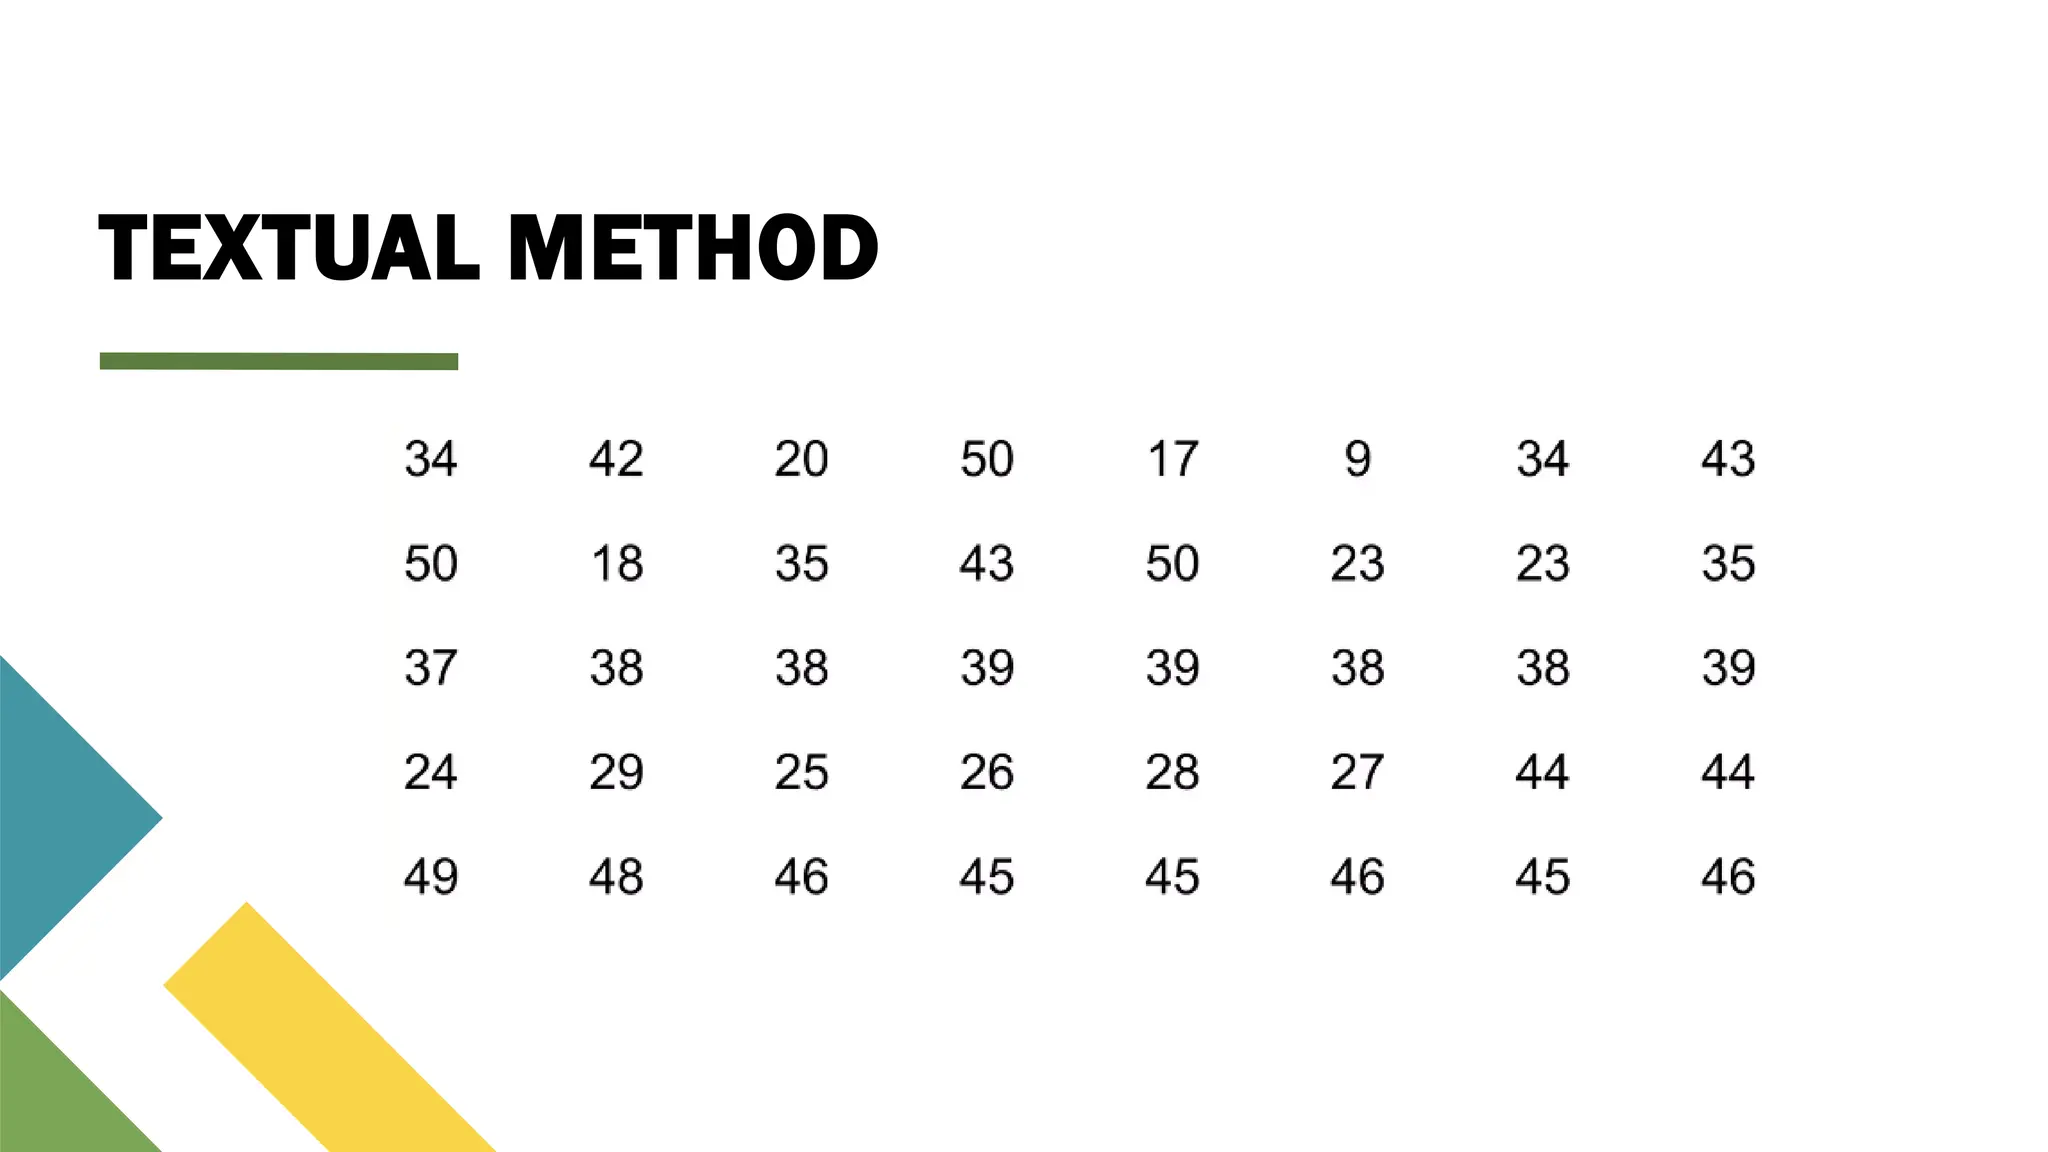
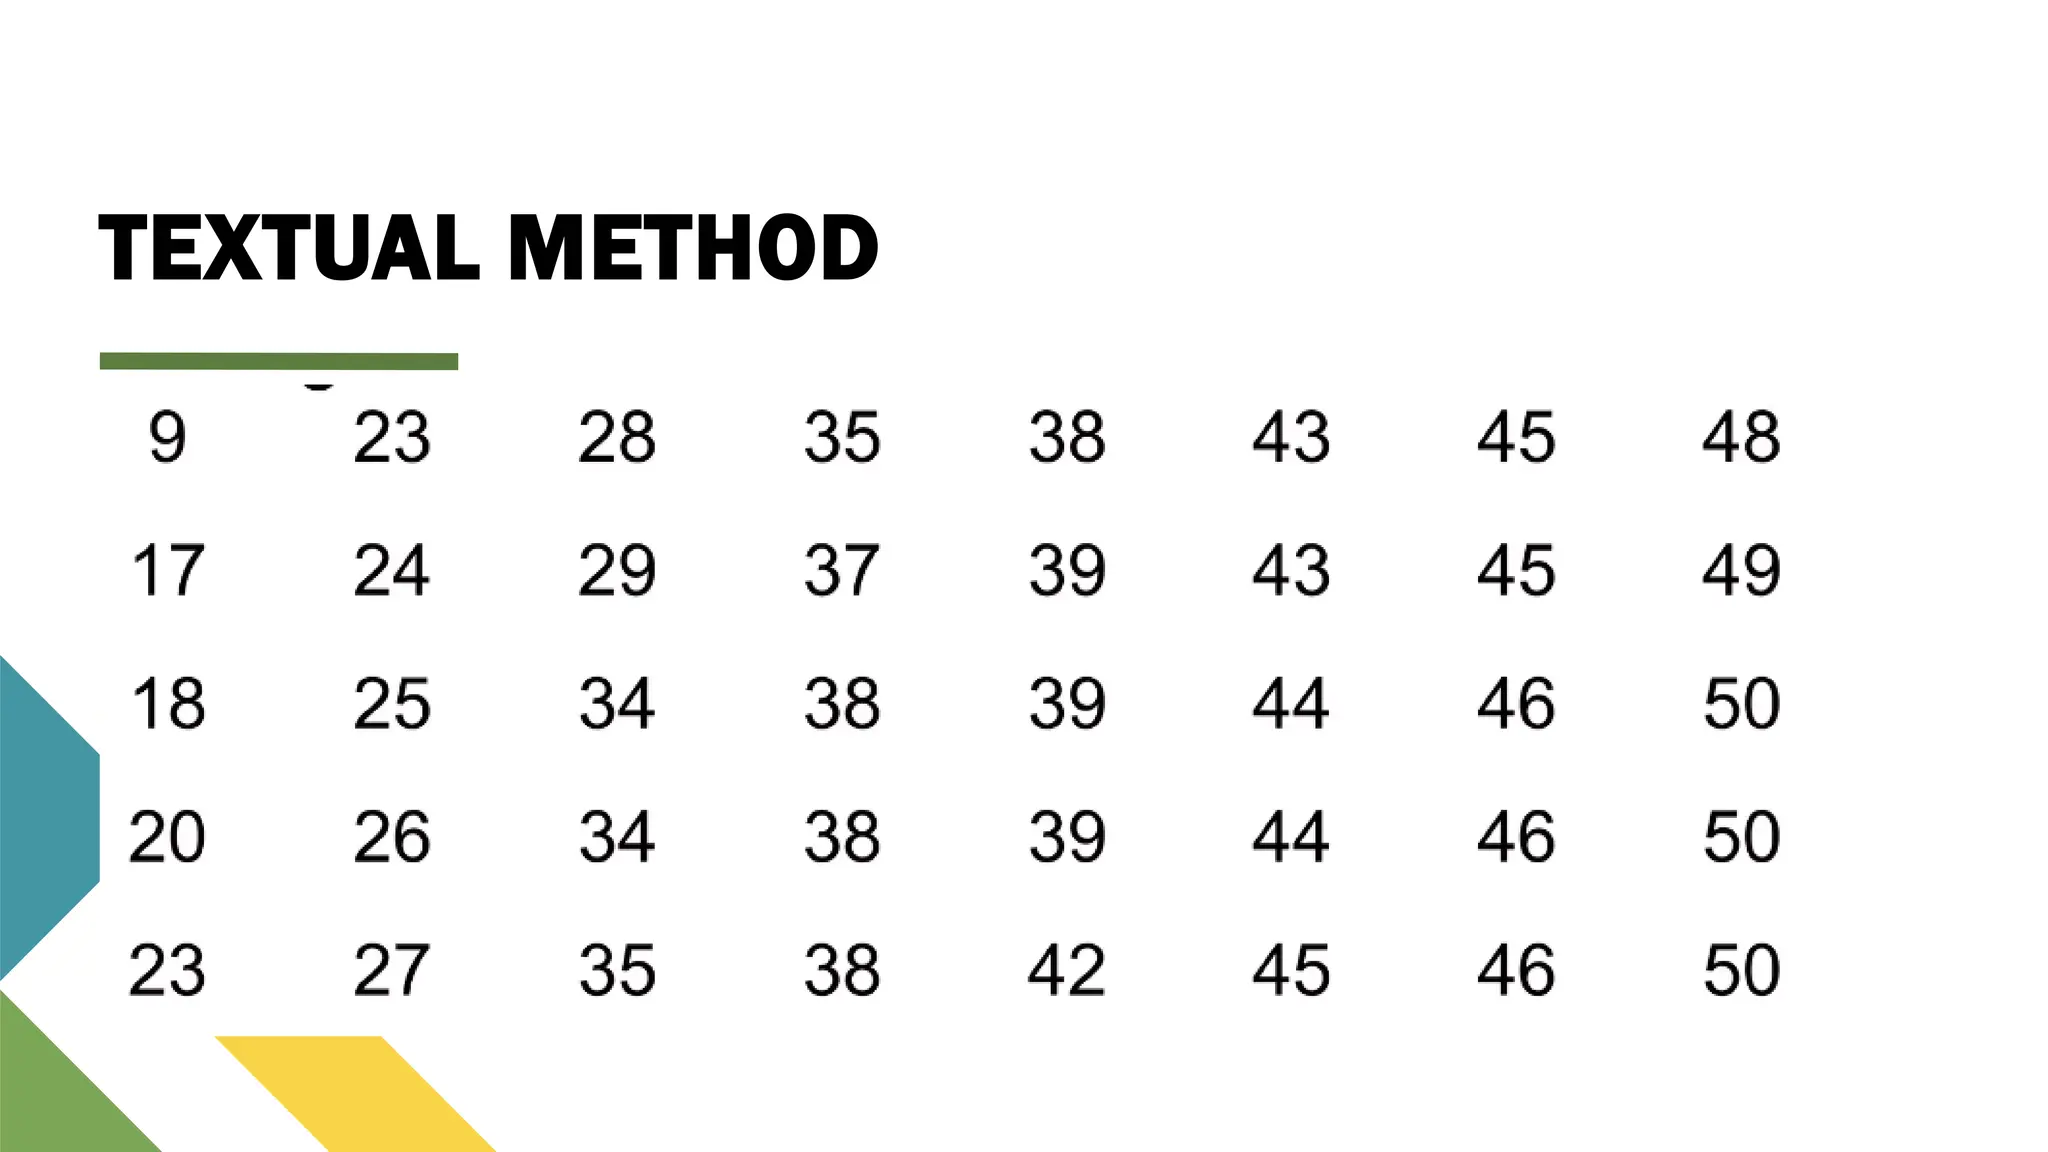
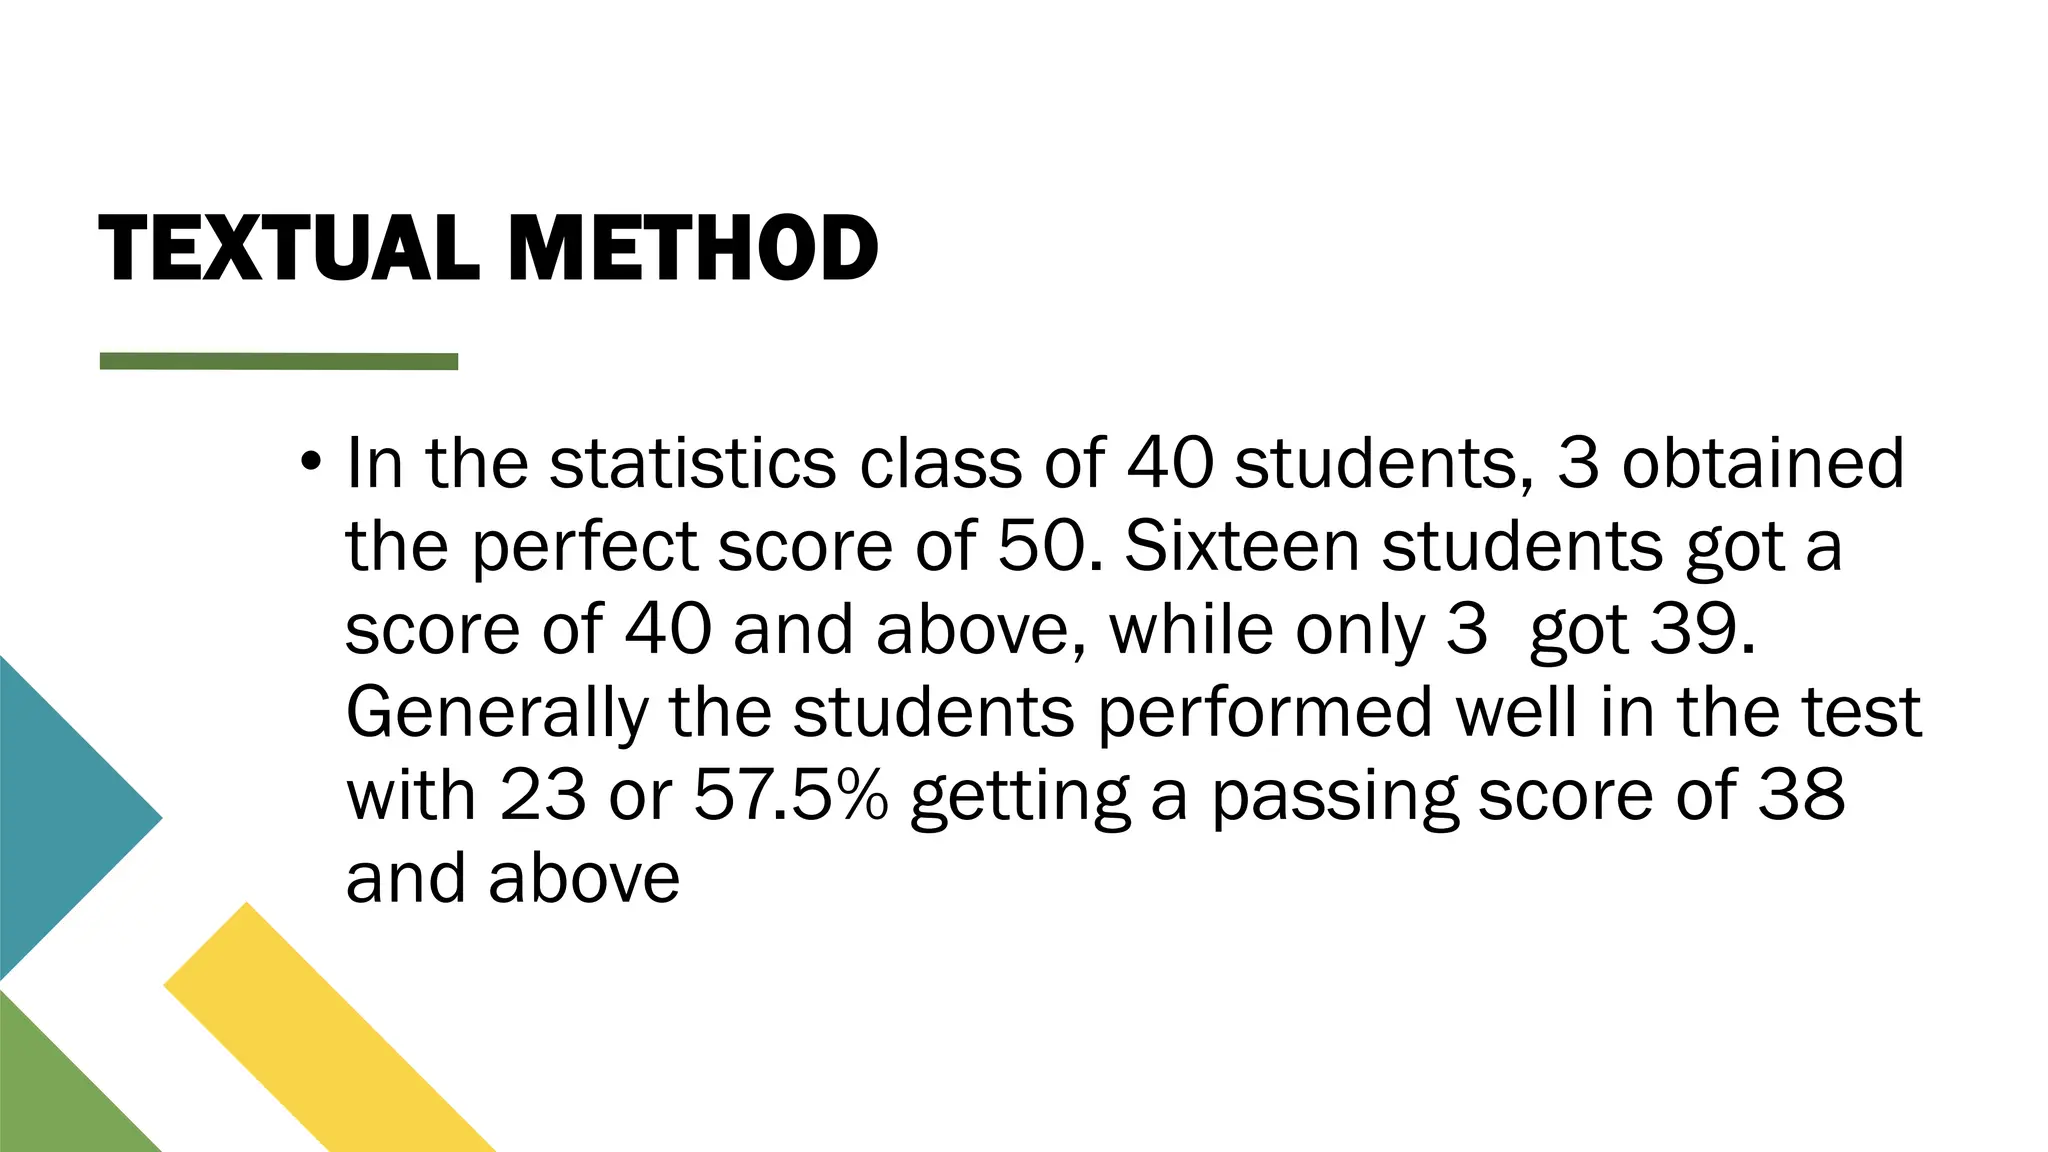
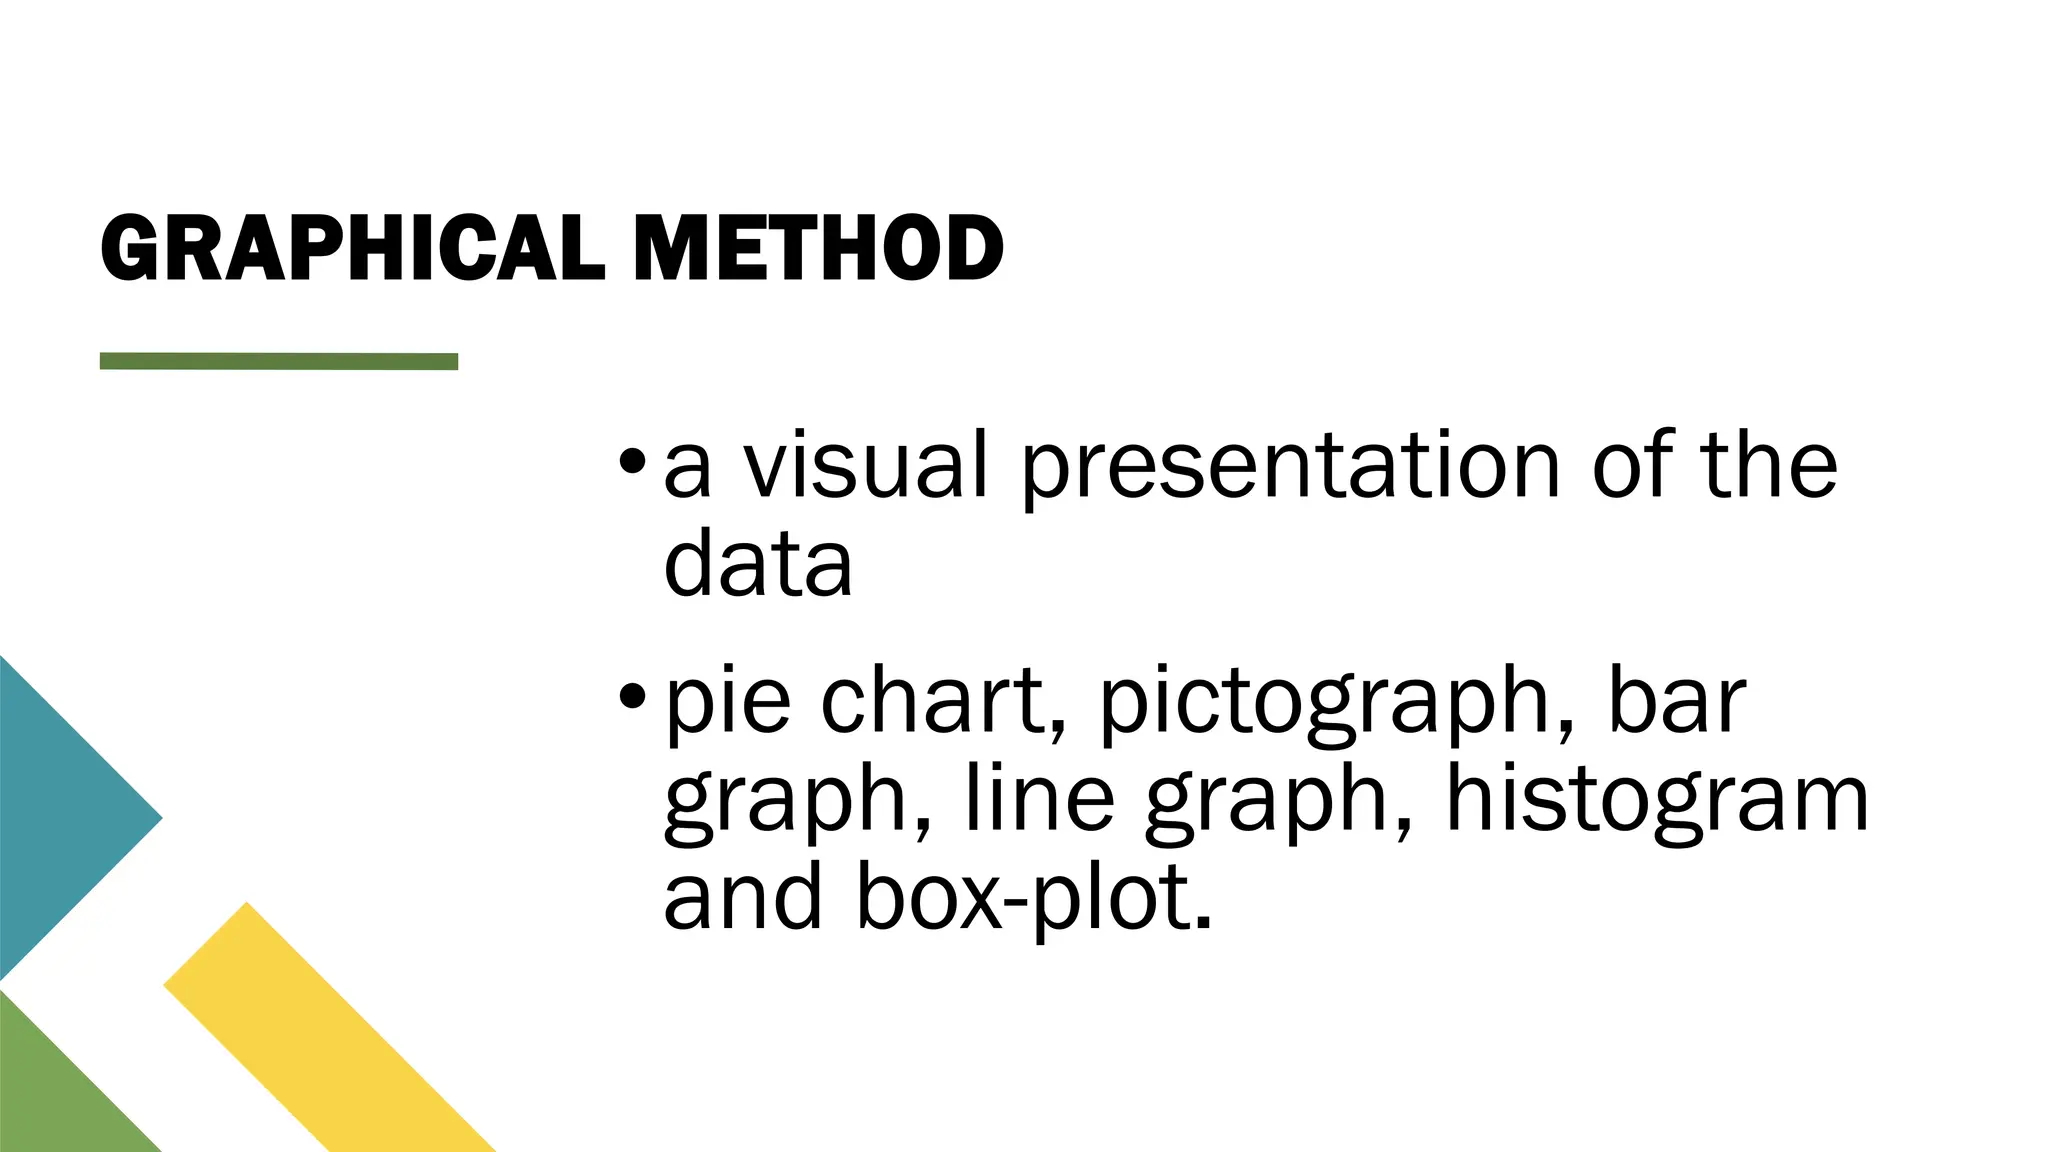
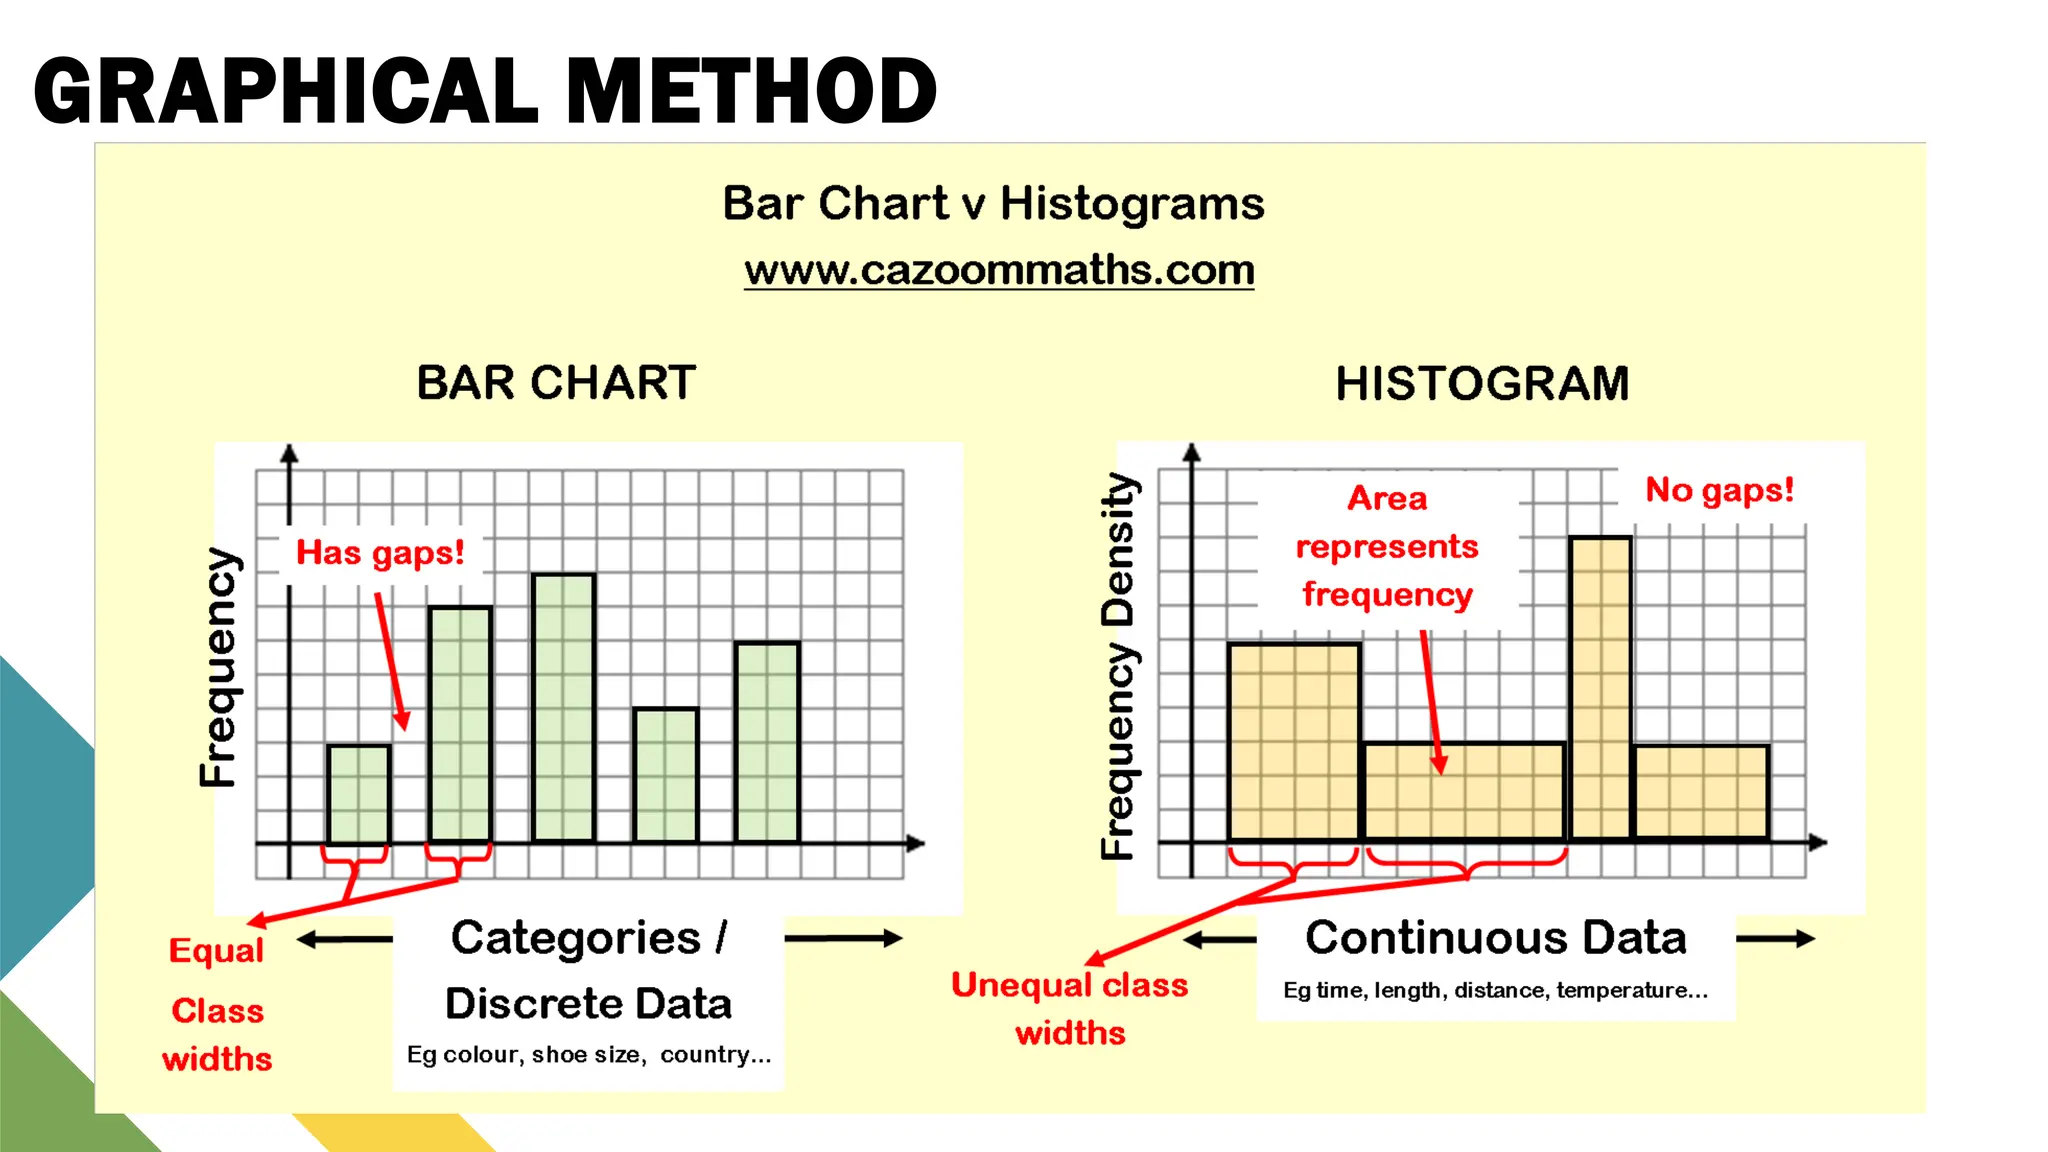
The document outlines methods for effectively presenting data, including textual, graphical, and tabular techniques. Textual presentation involves describing key highlights, while graphical methods utilize visual tools such as pie charts and bar graphs. The information also illustrates how to summarize a class's performance using these methods.