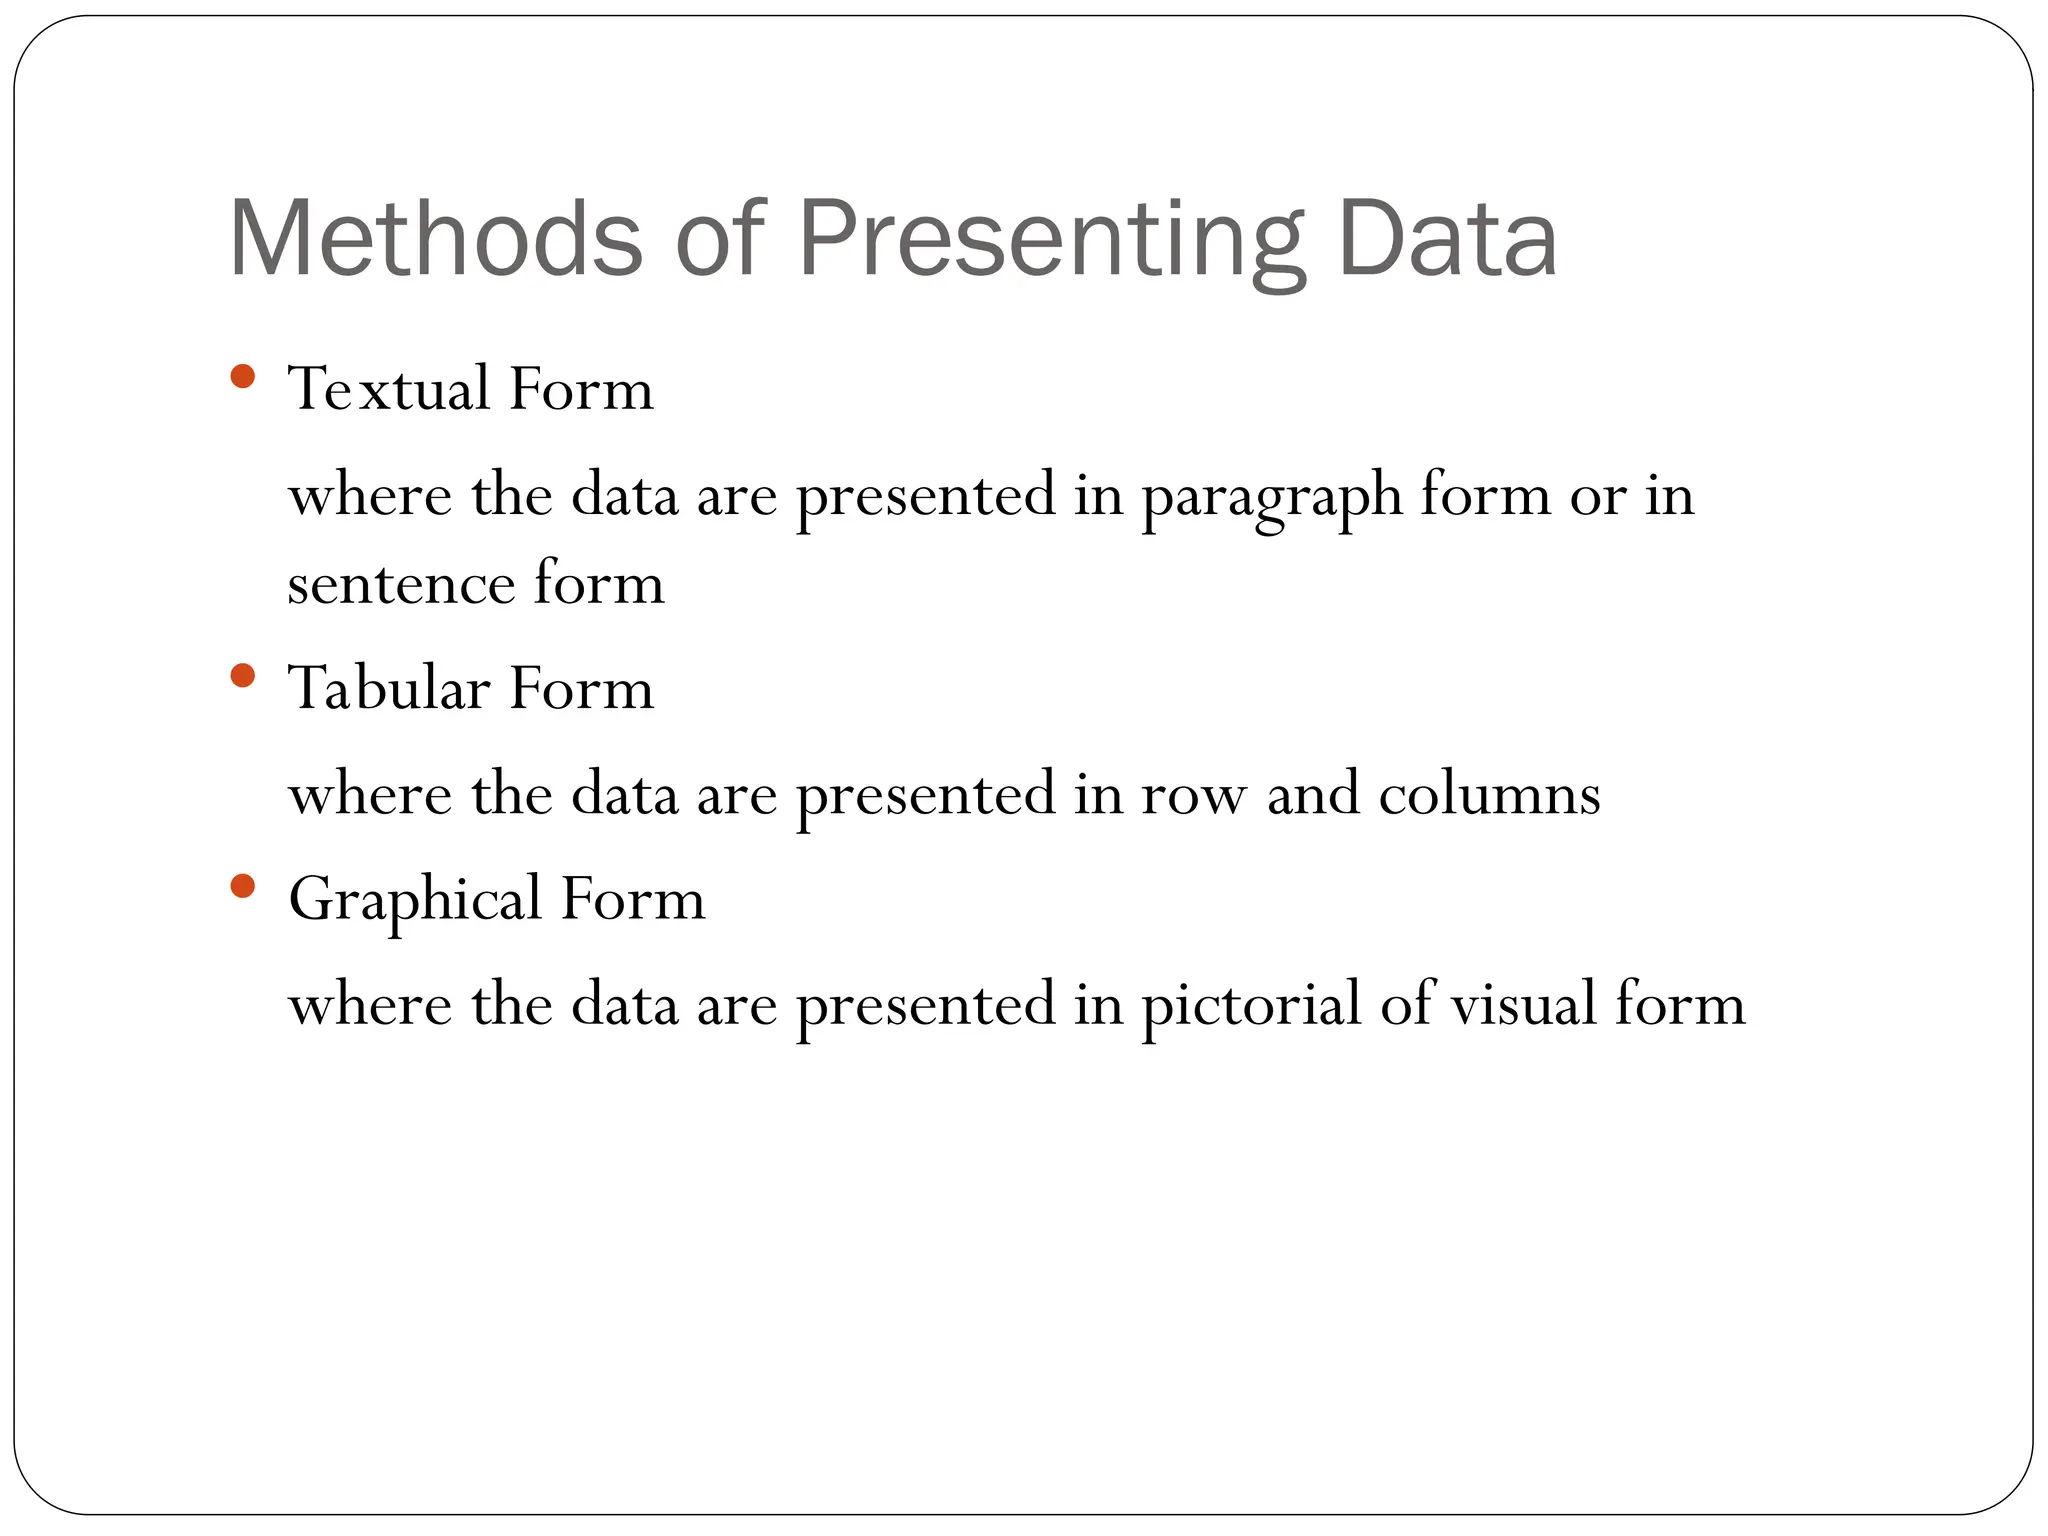
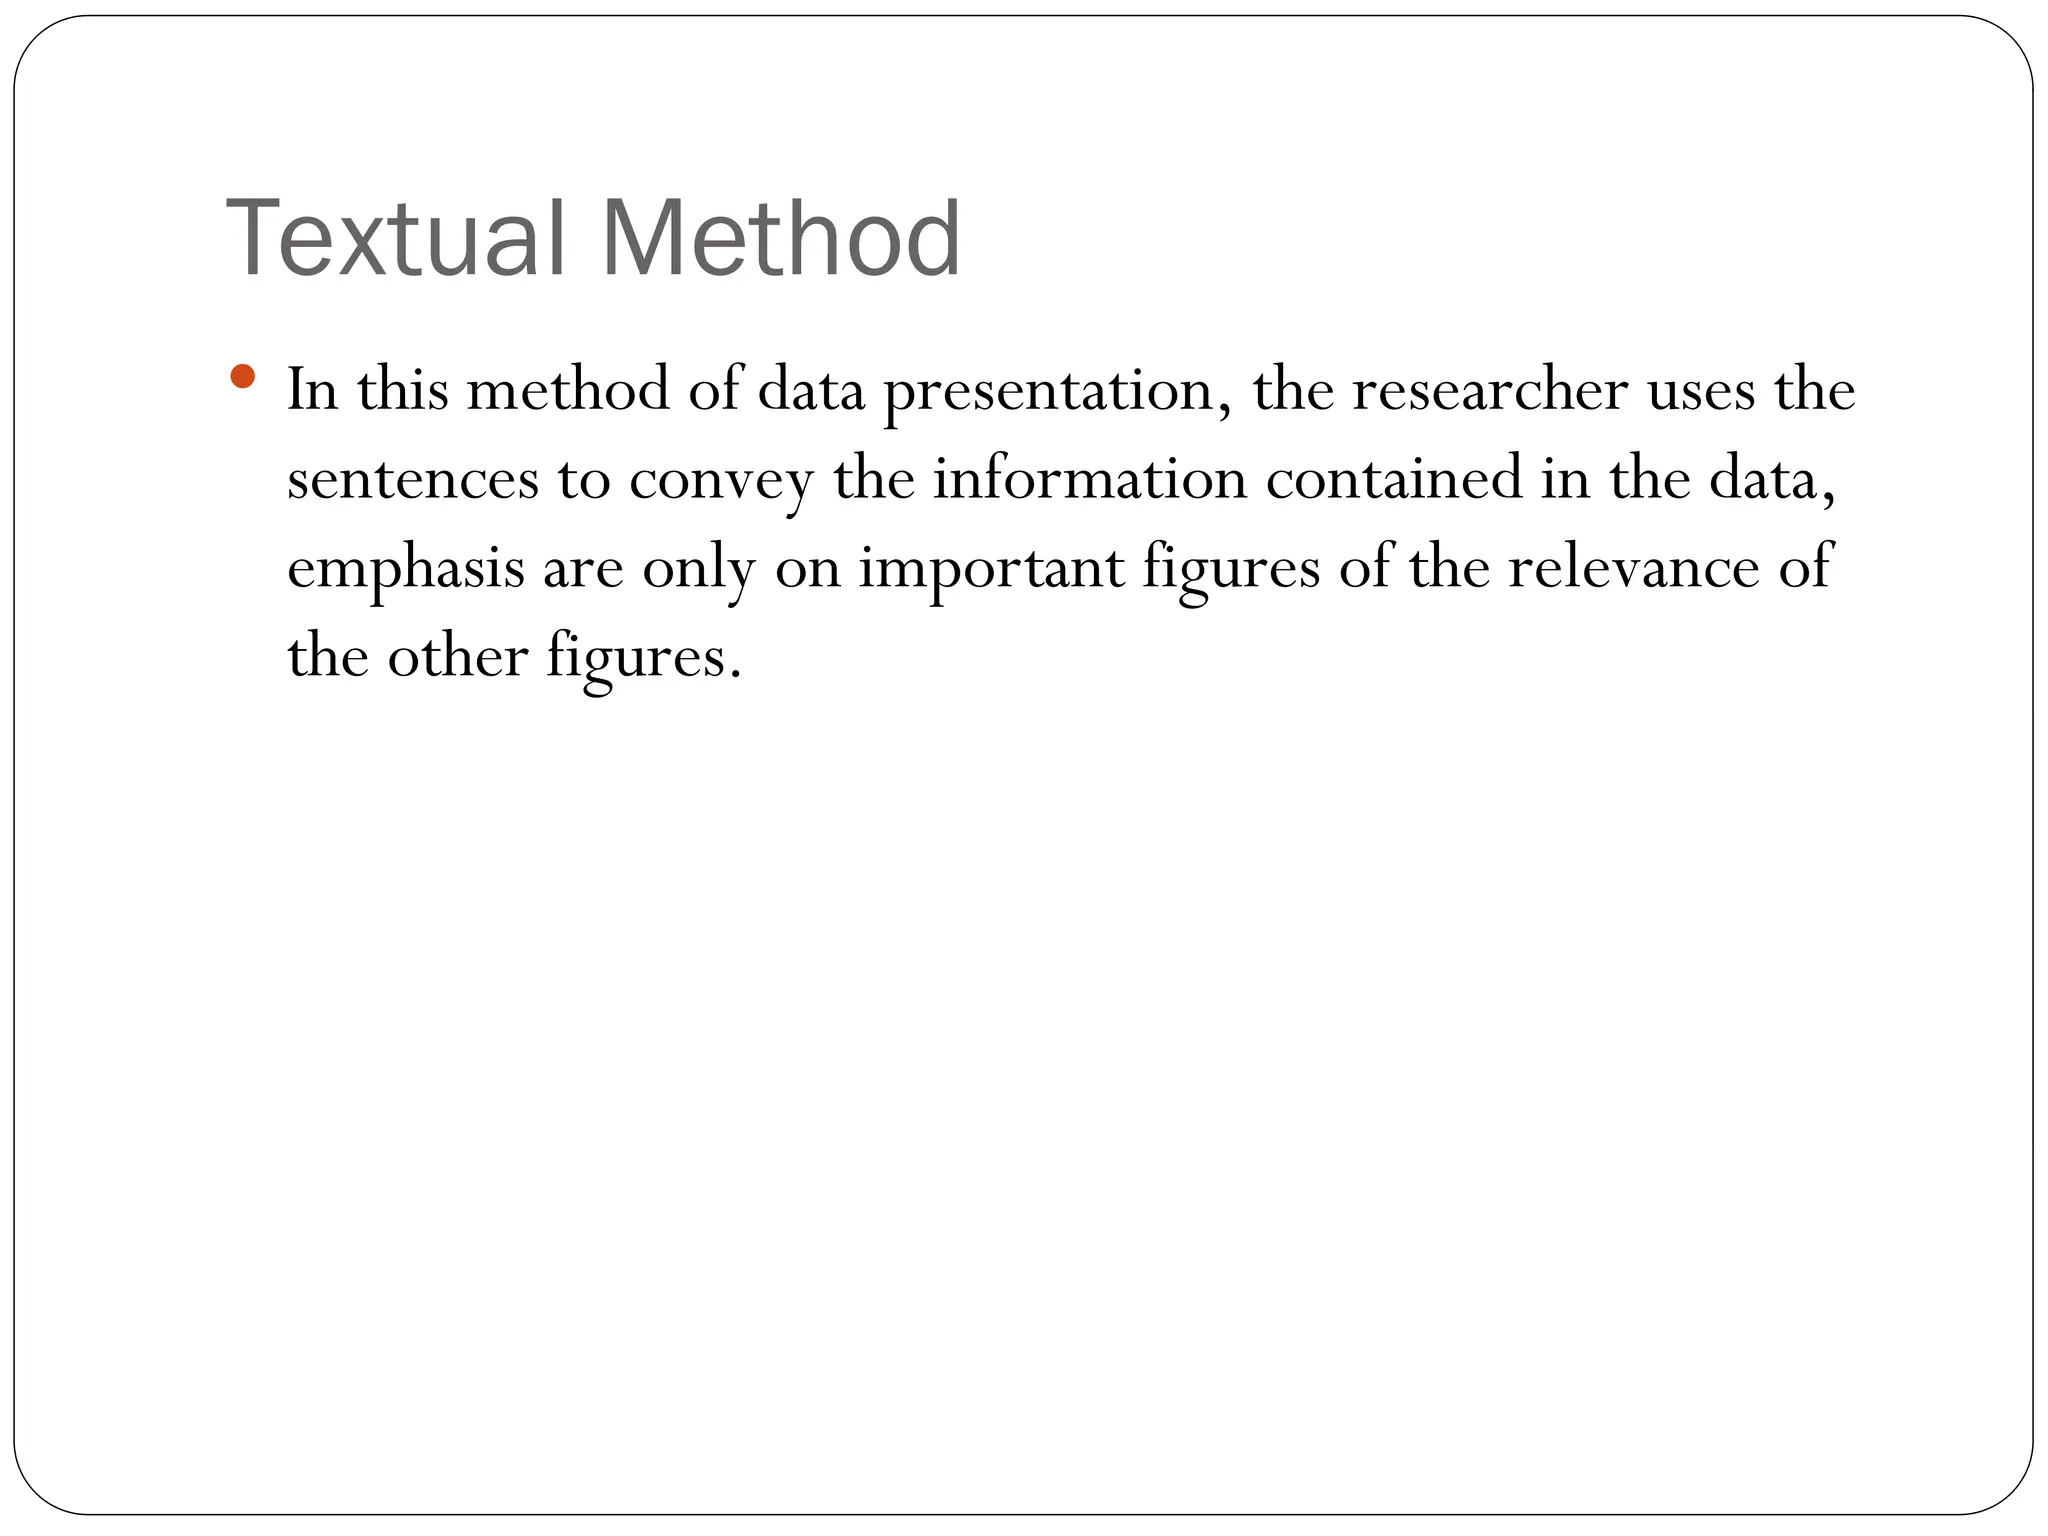
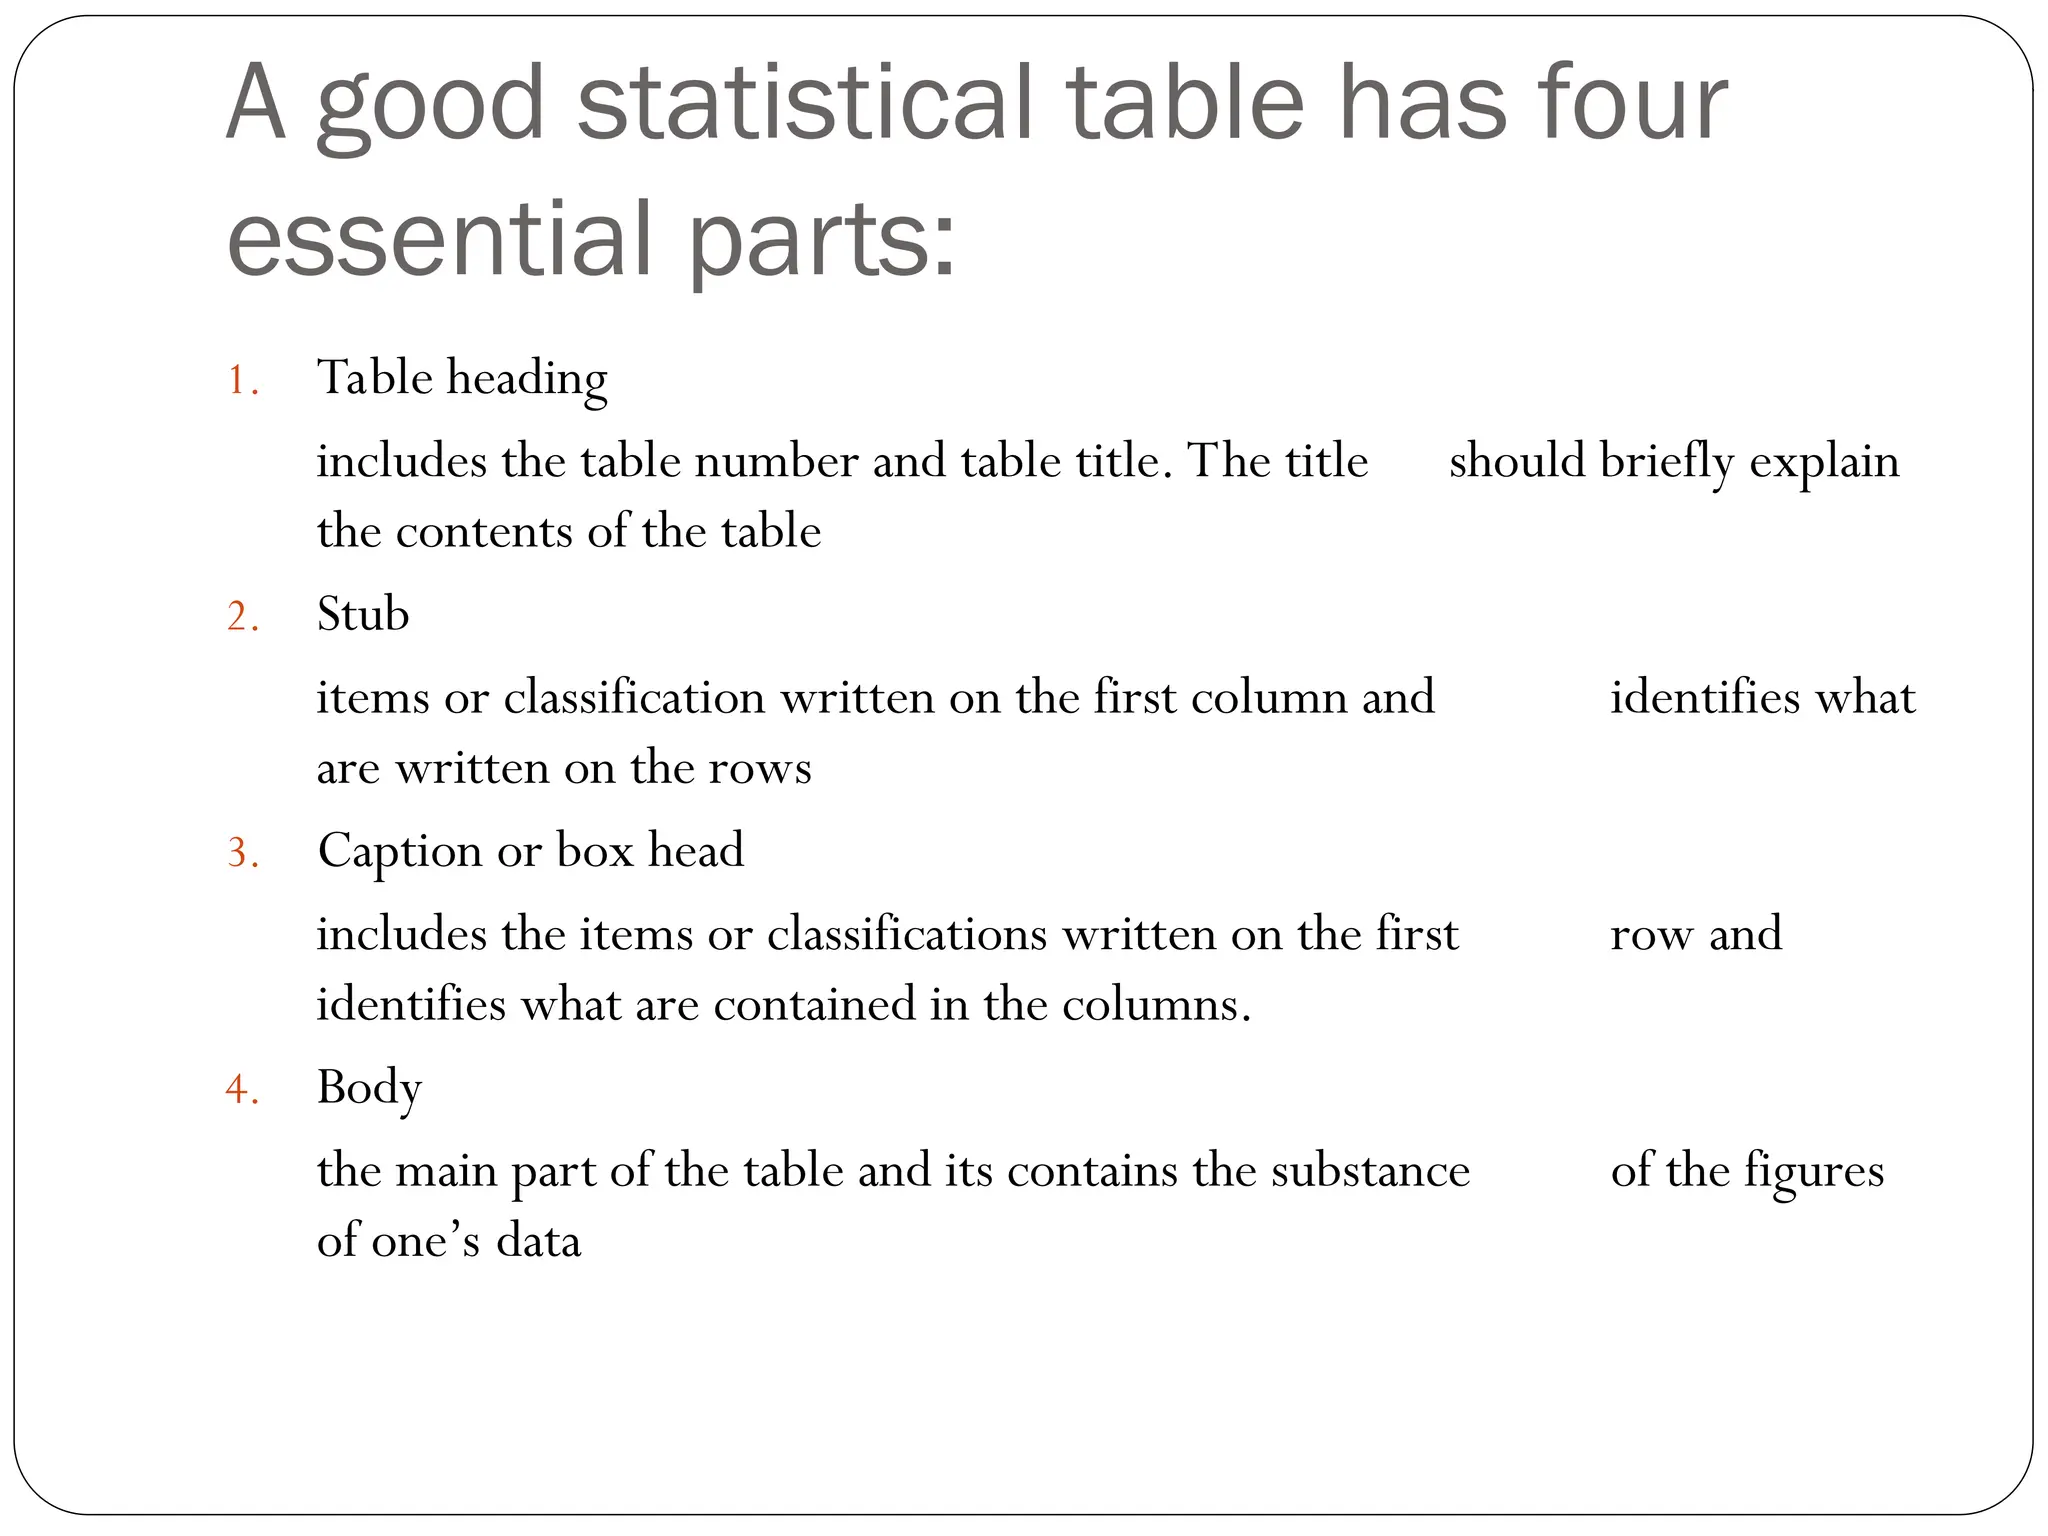
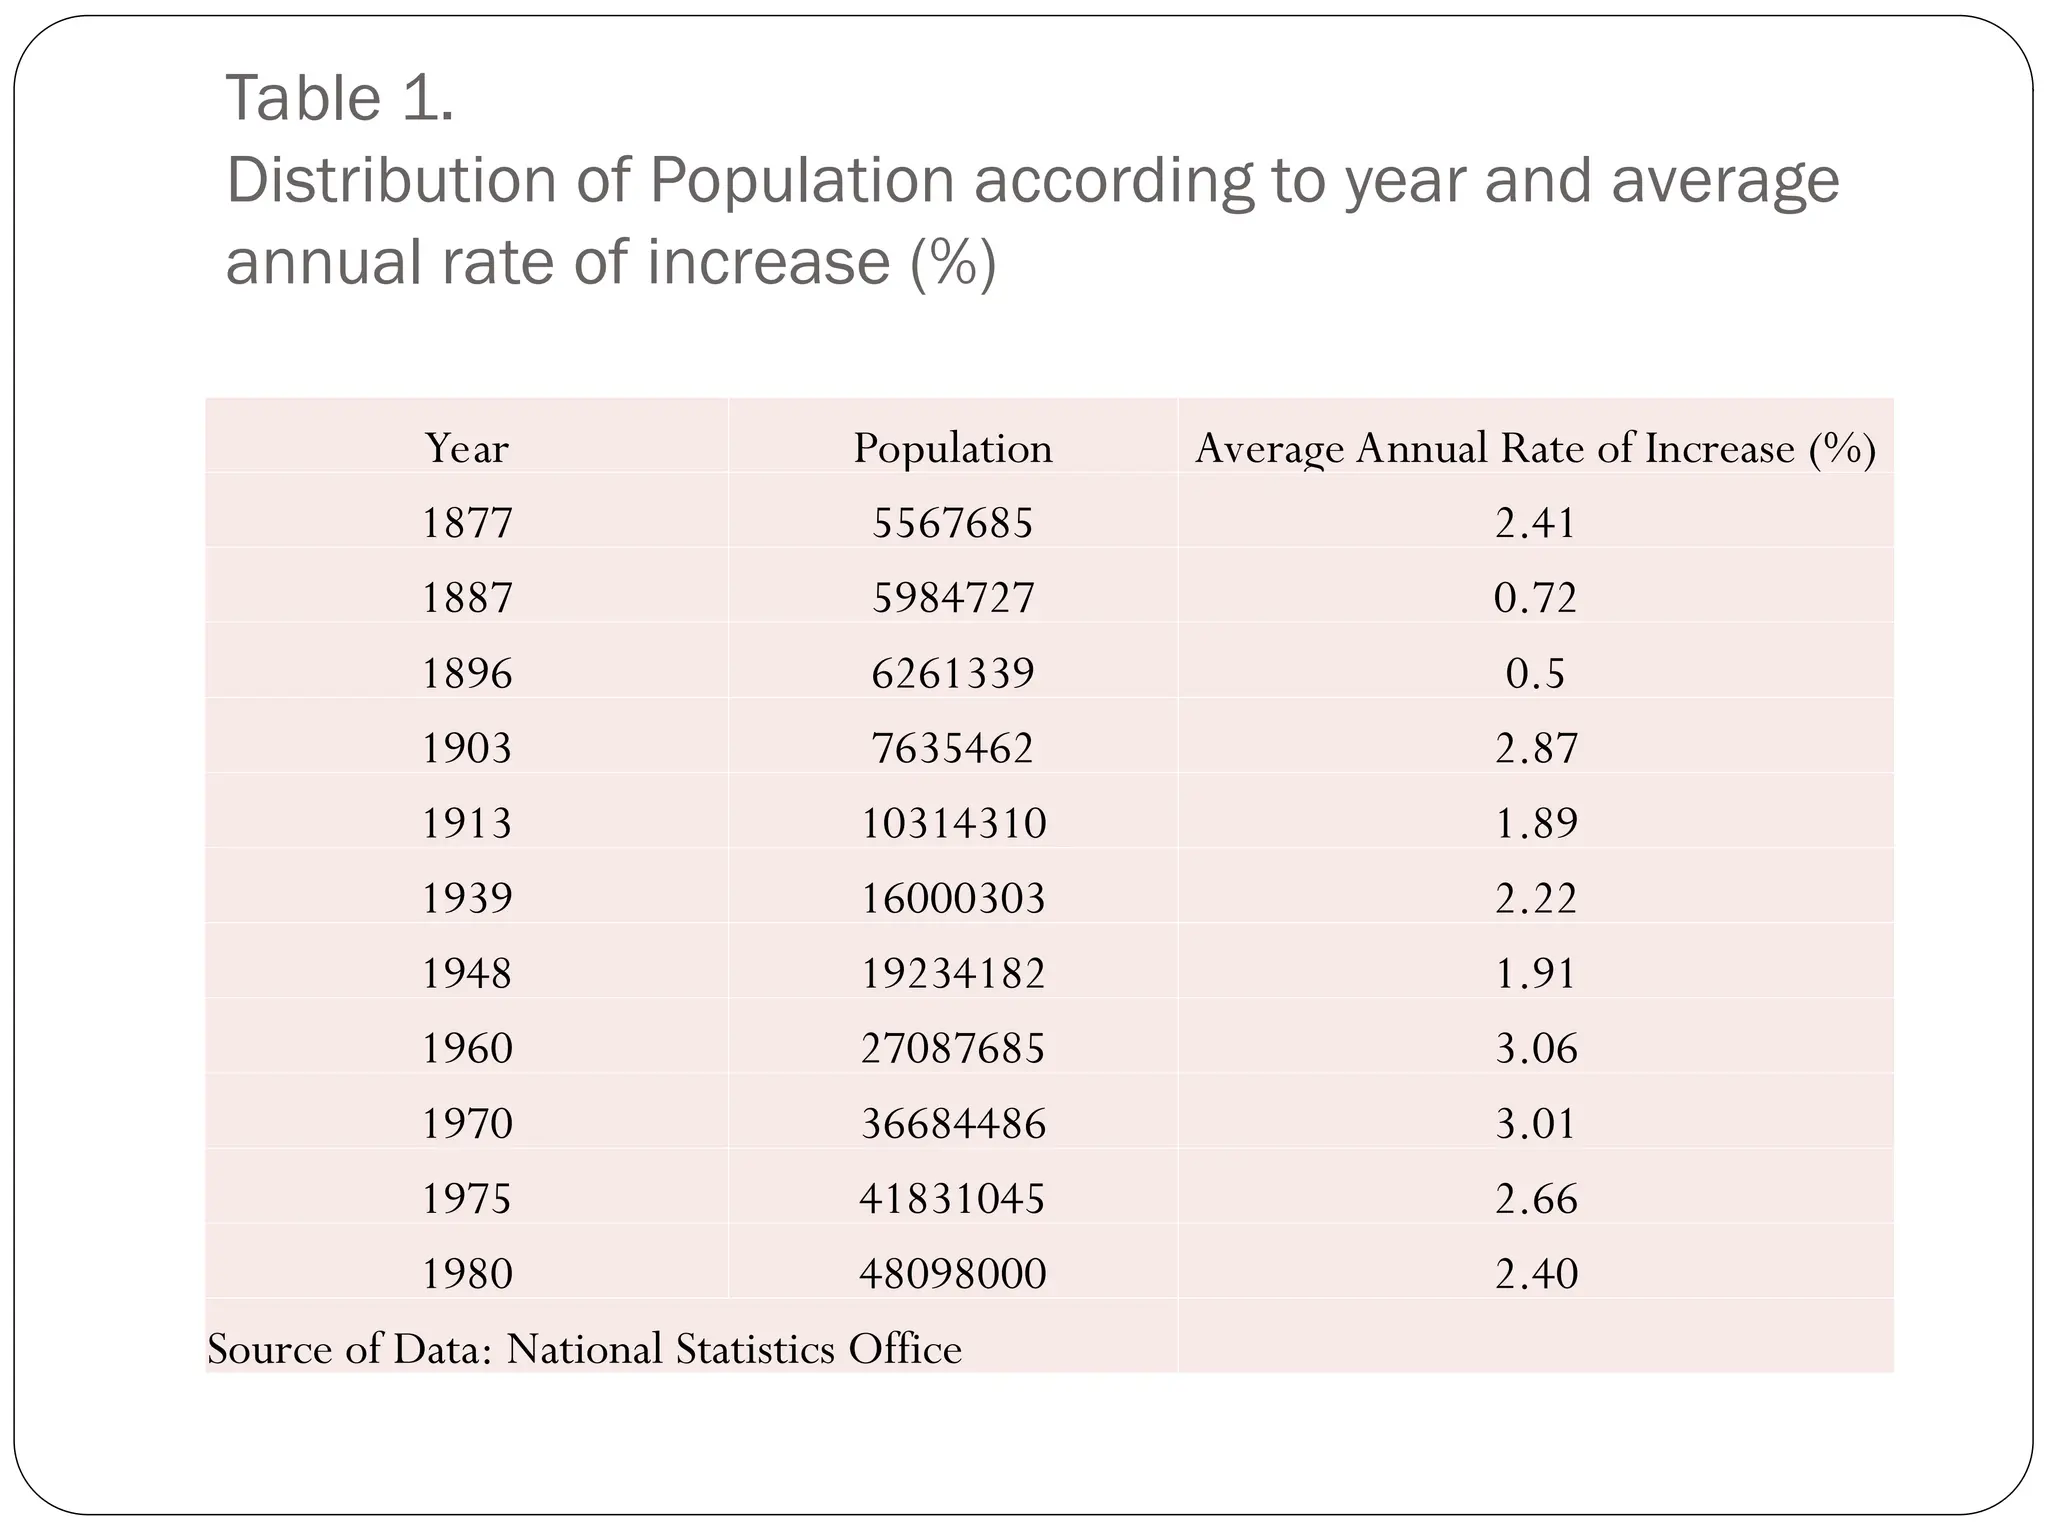
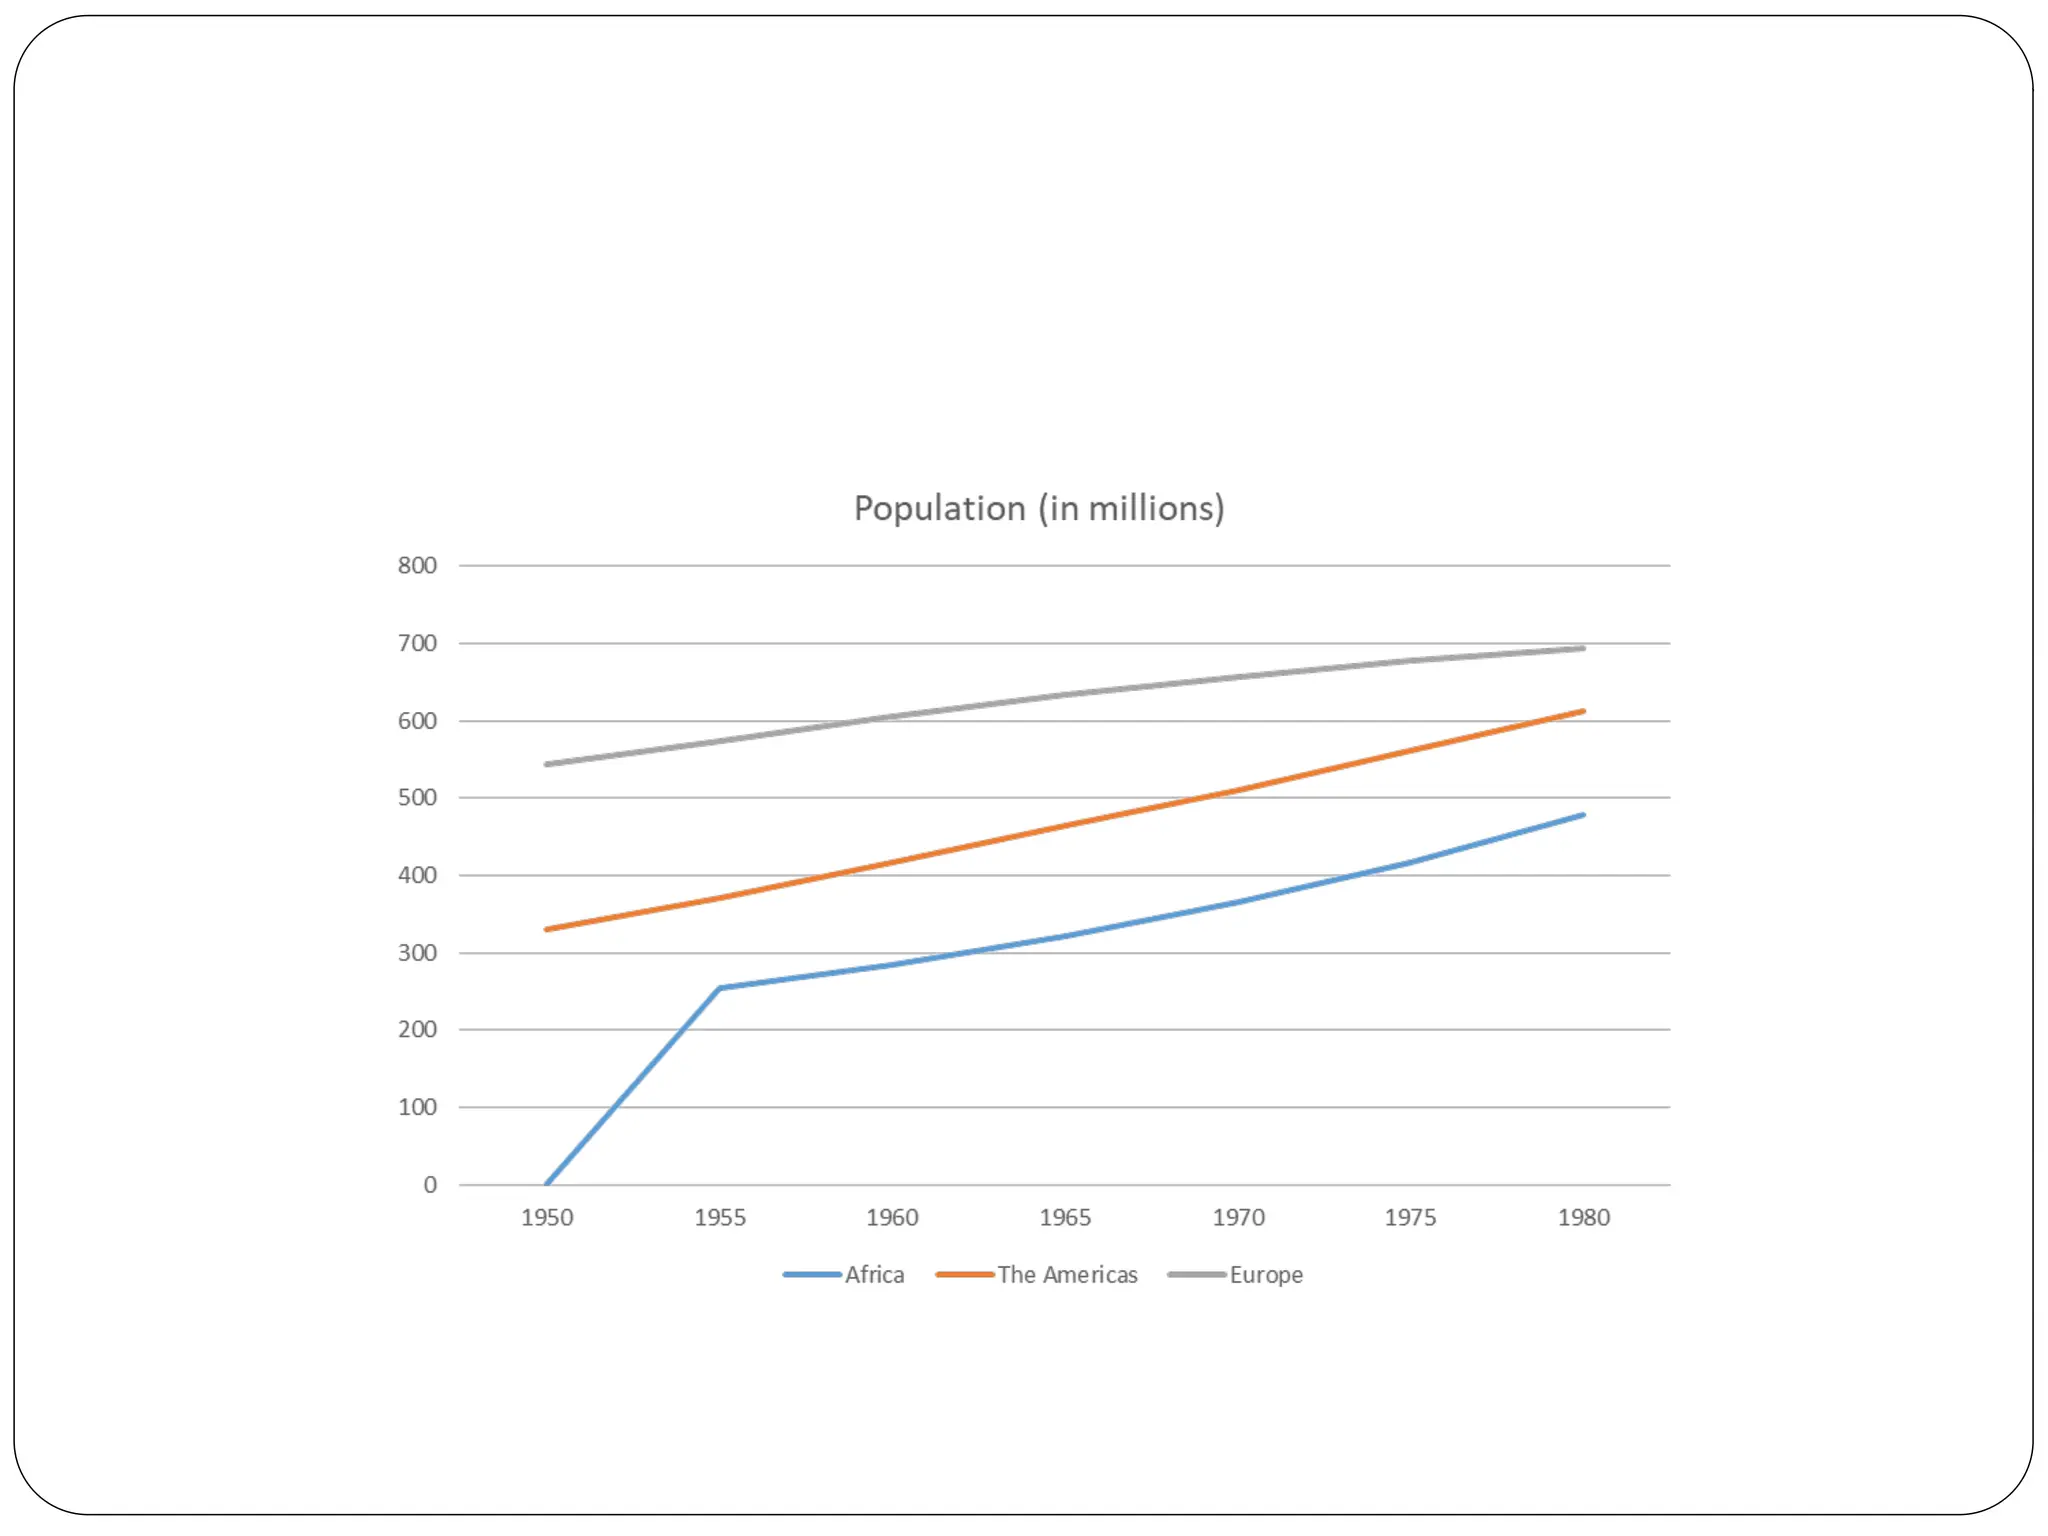
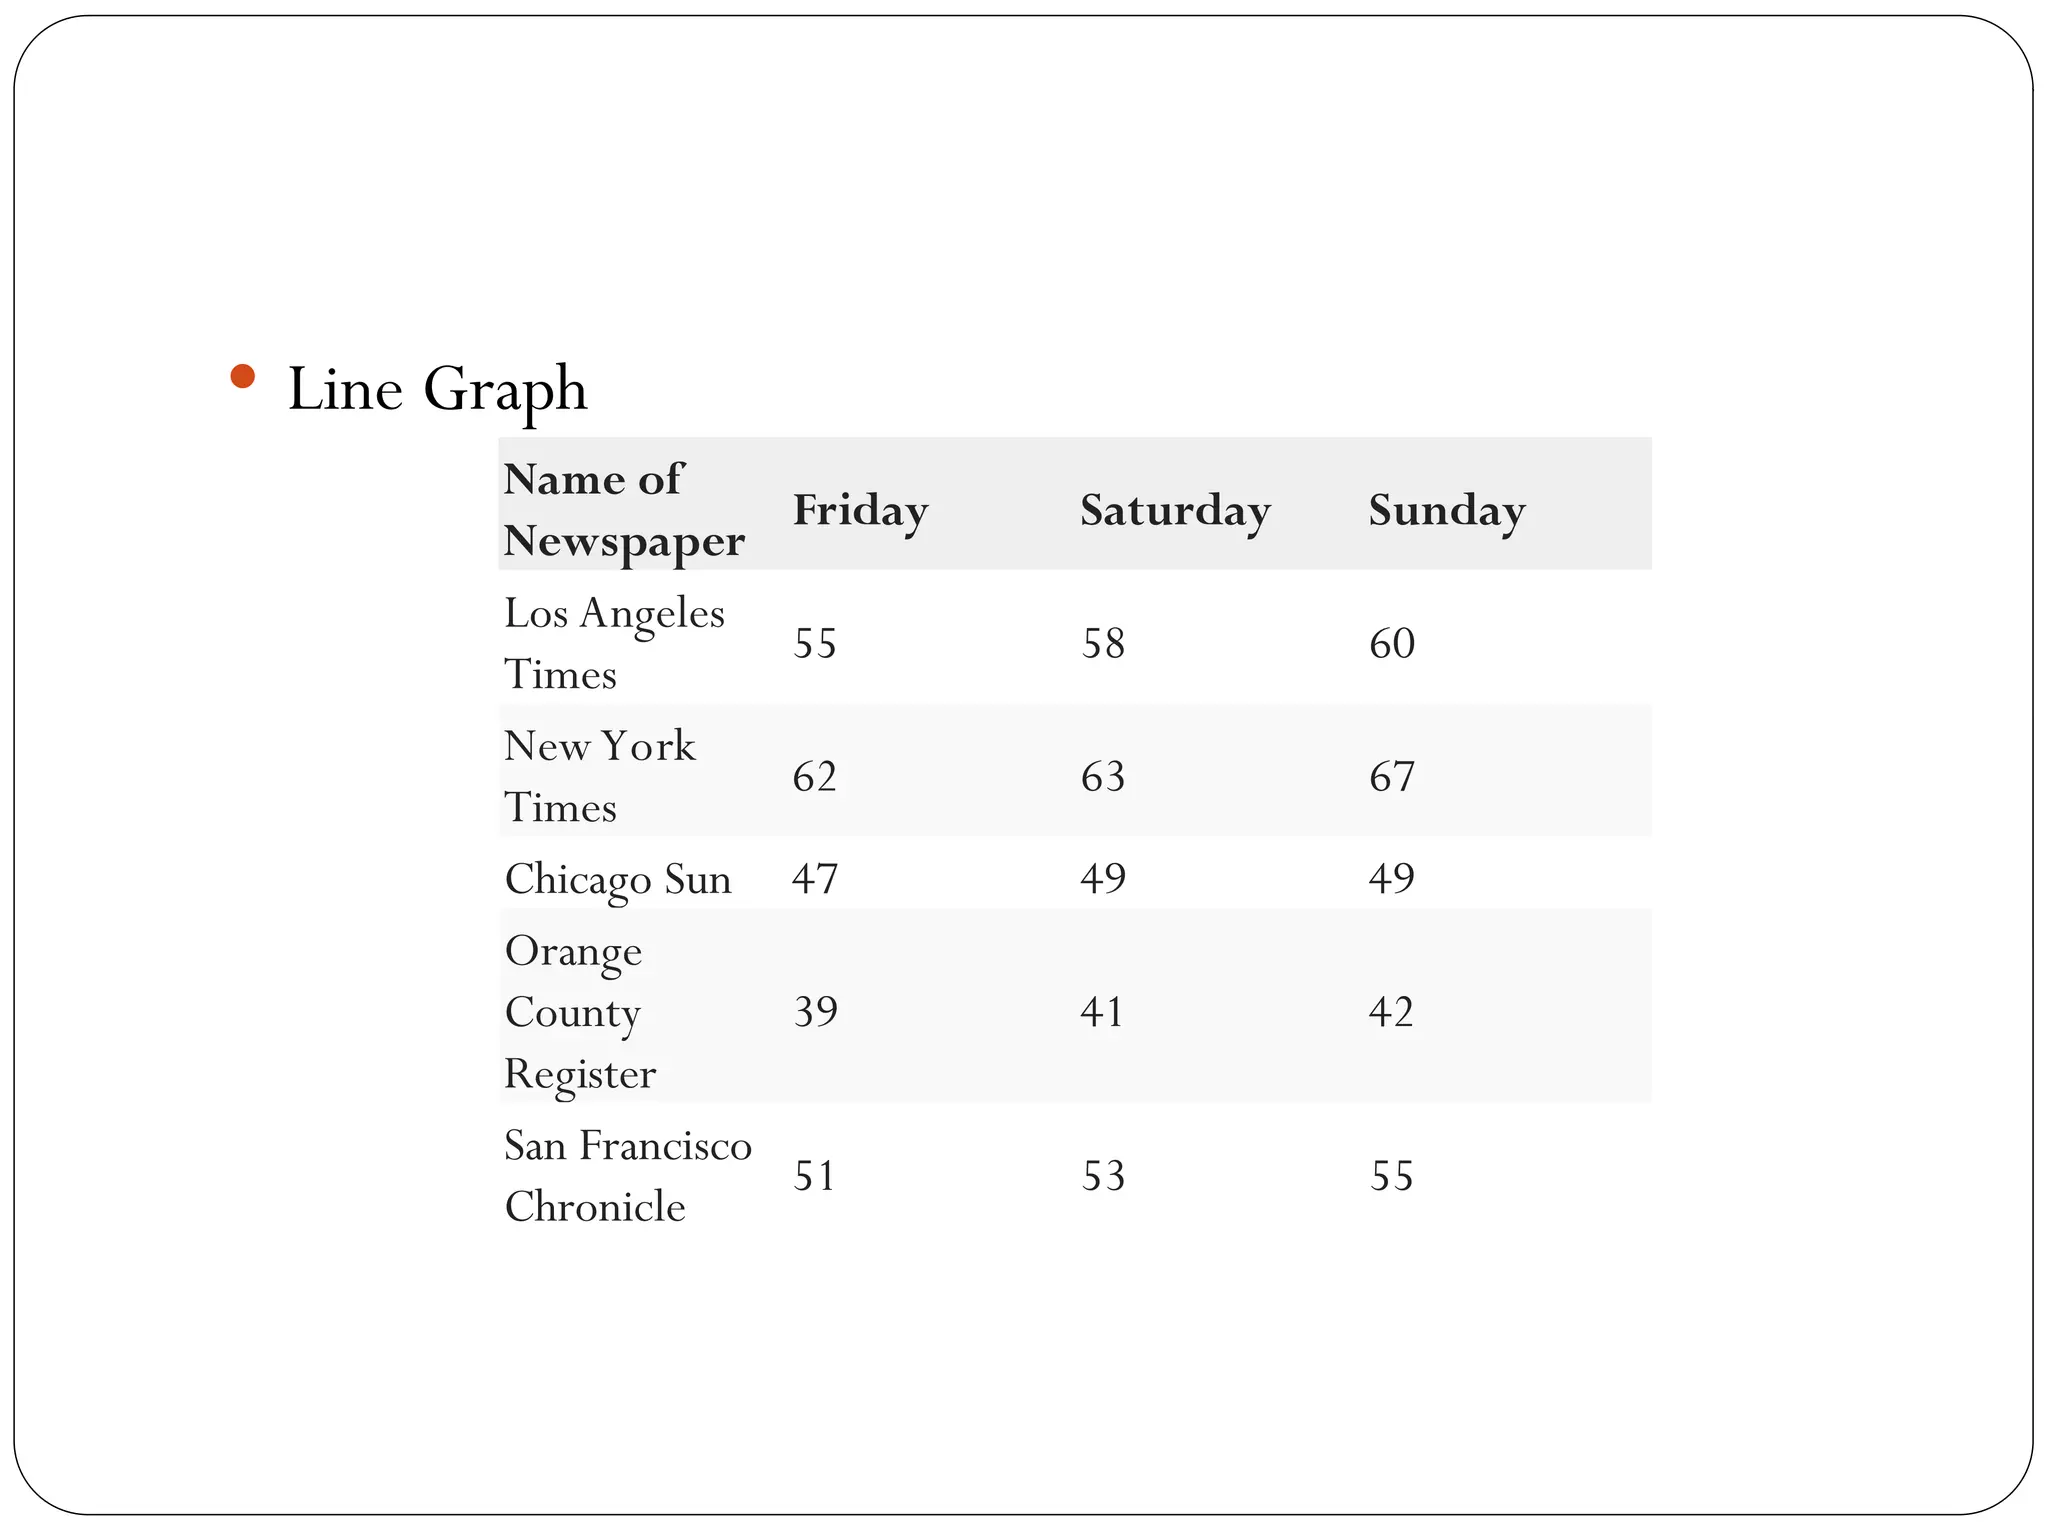
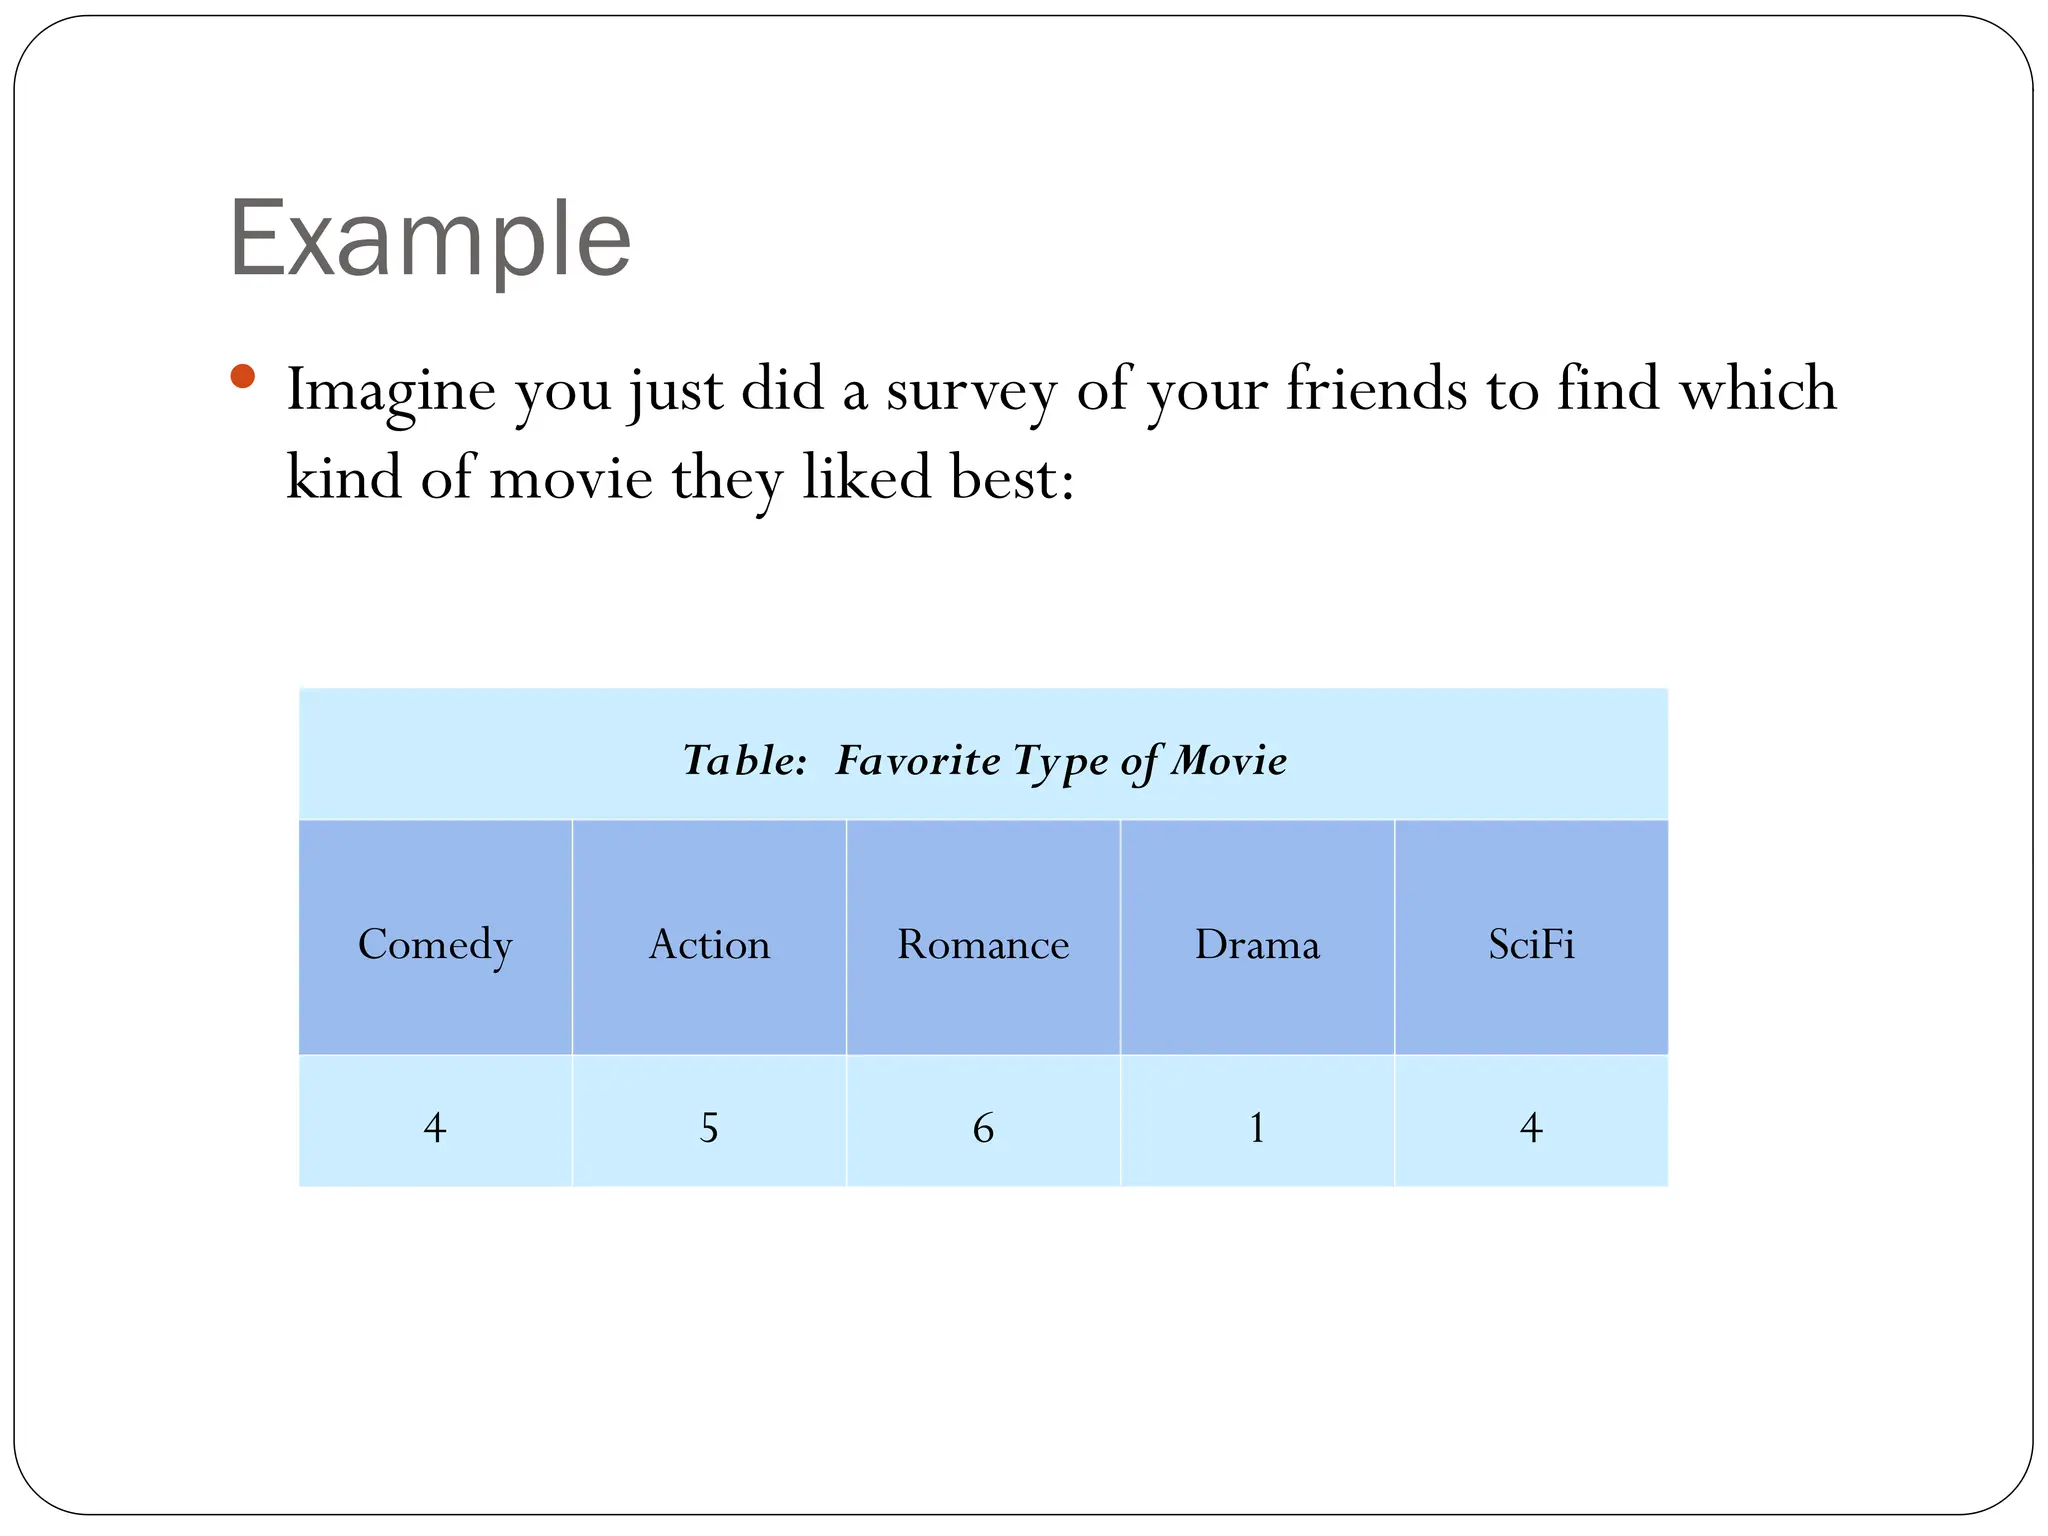
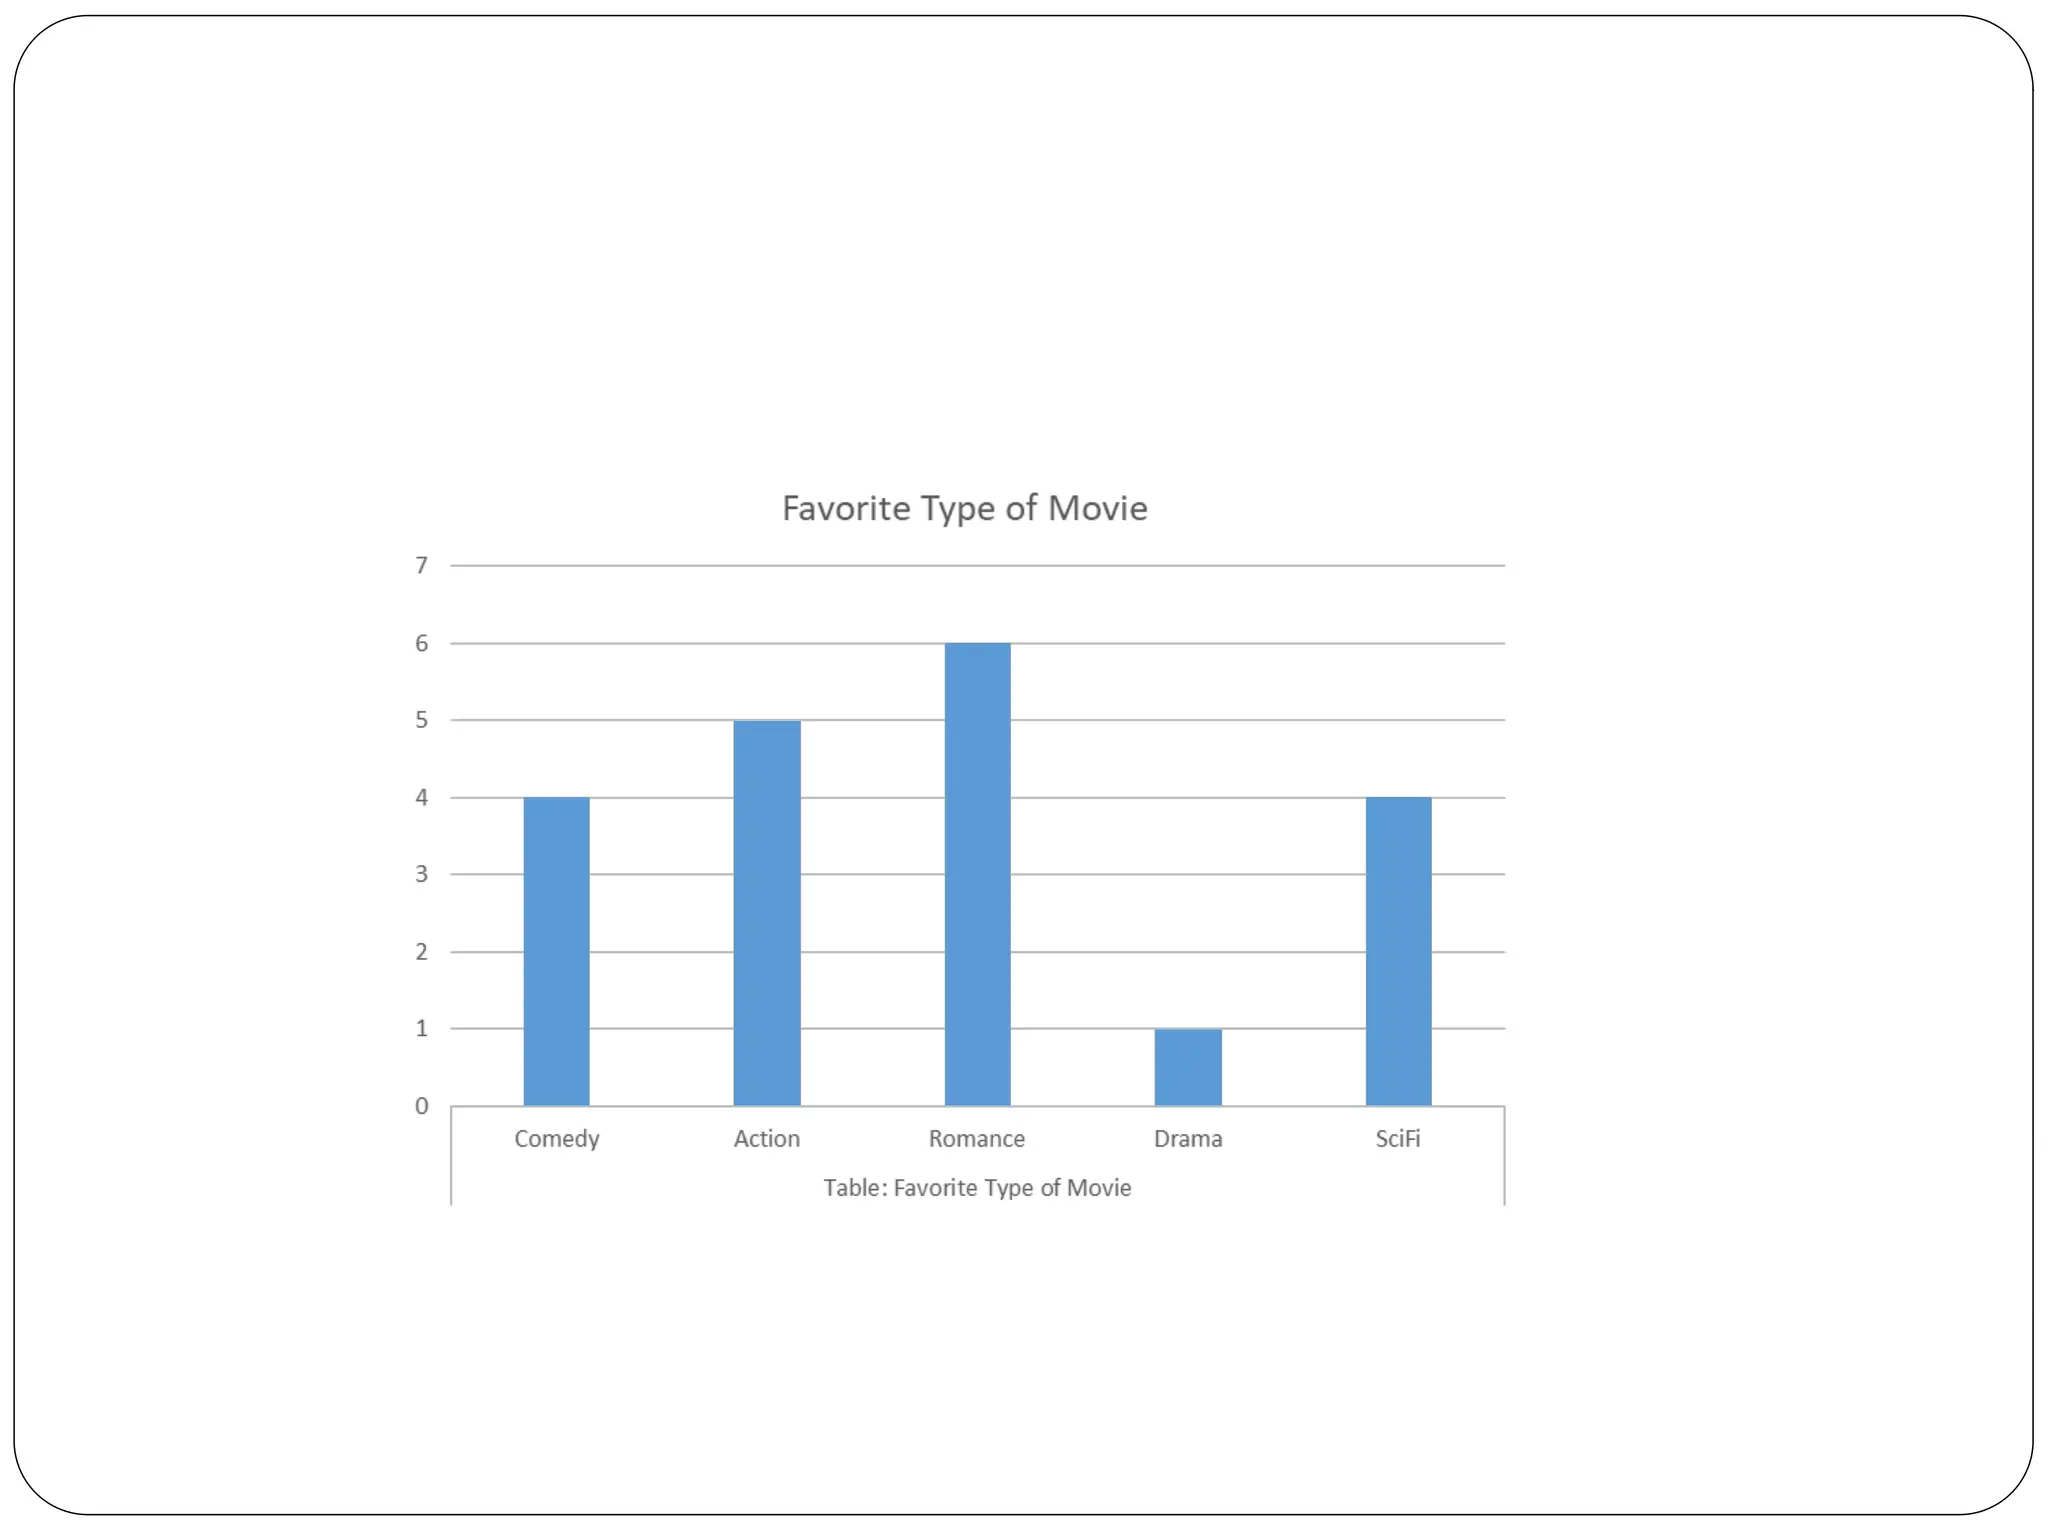
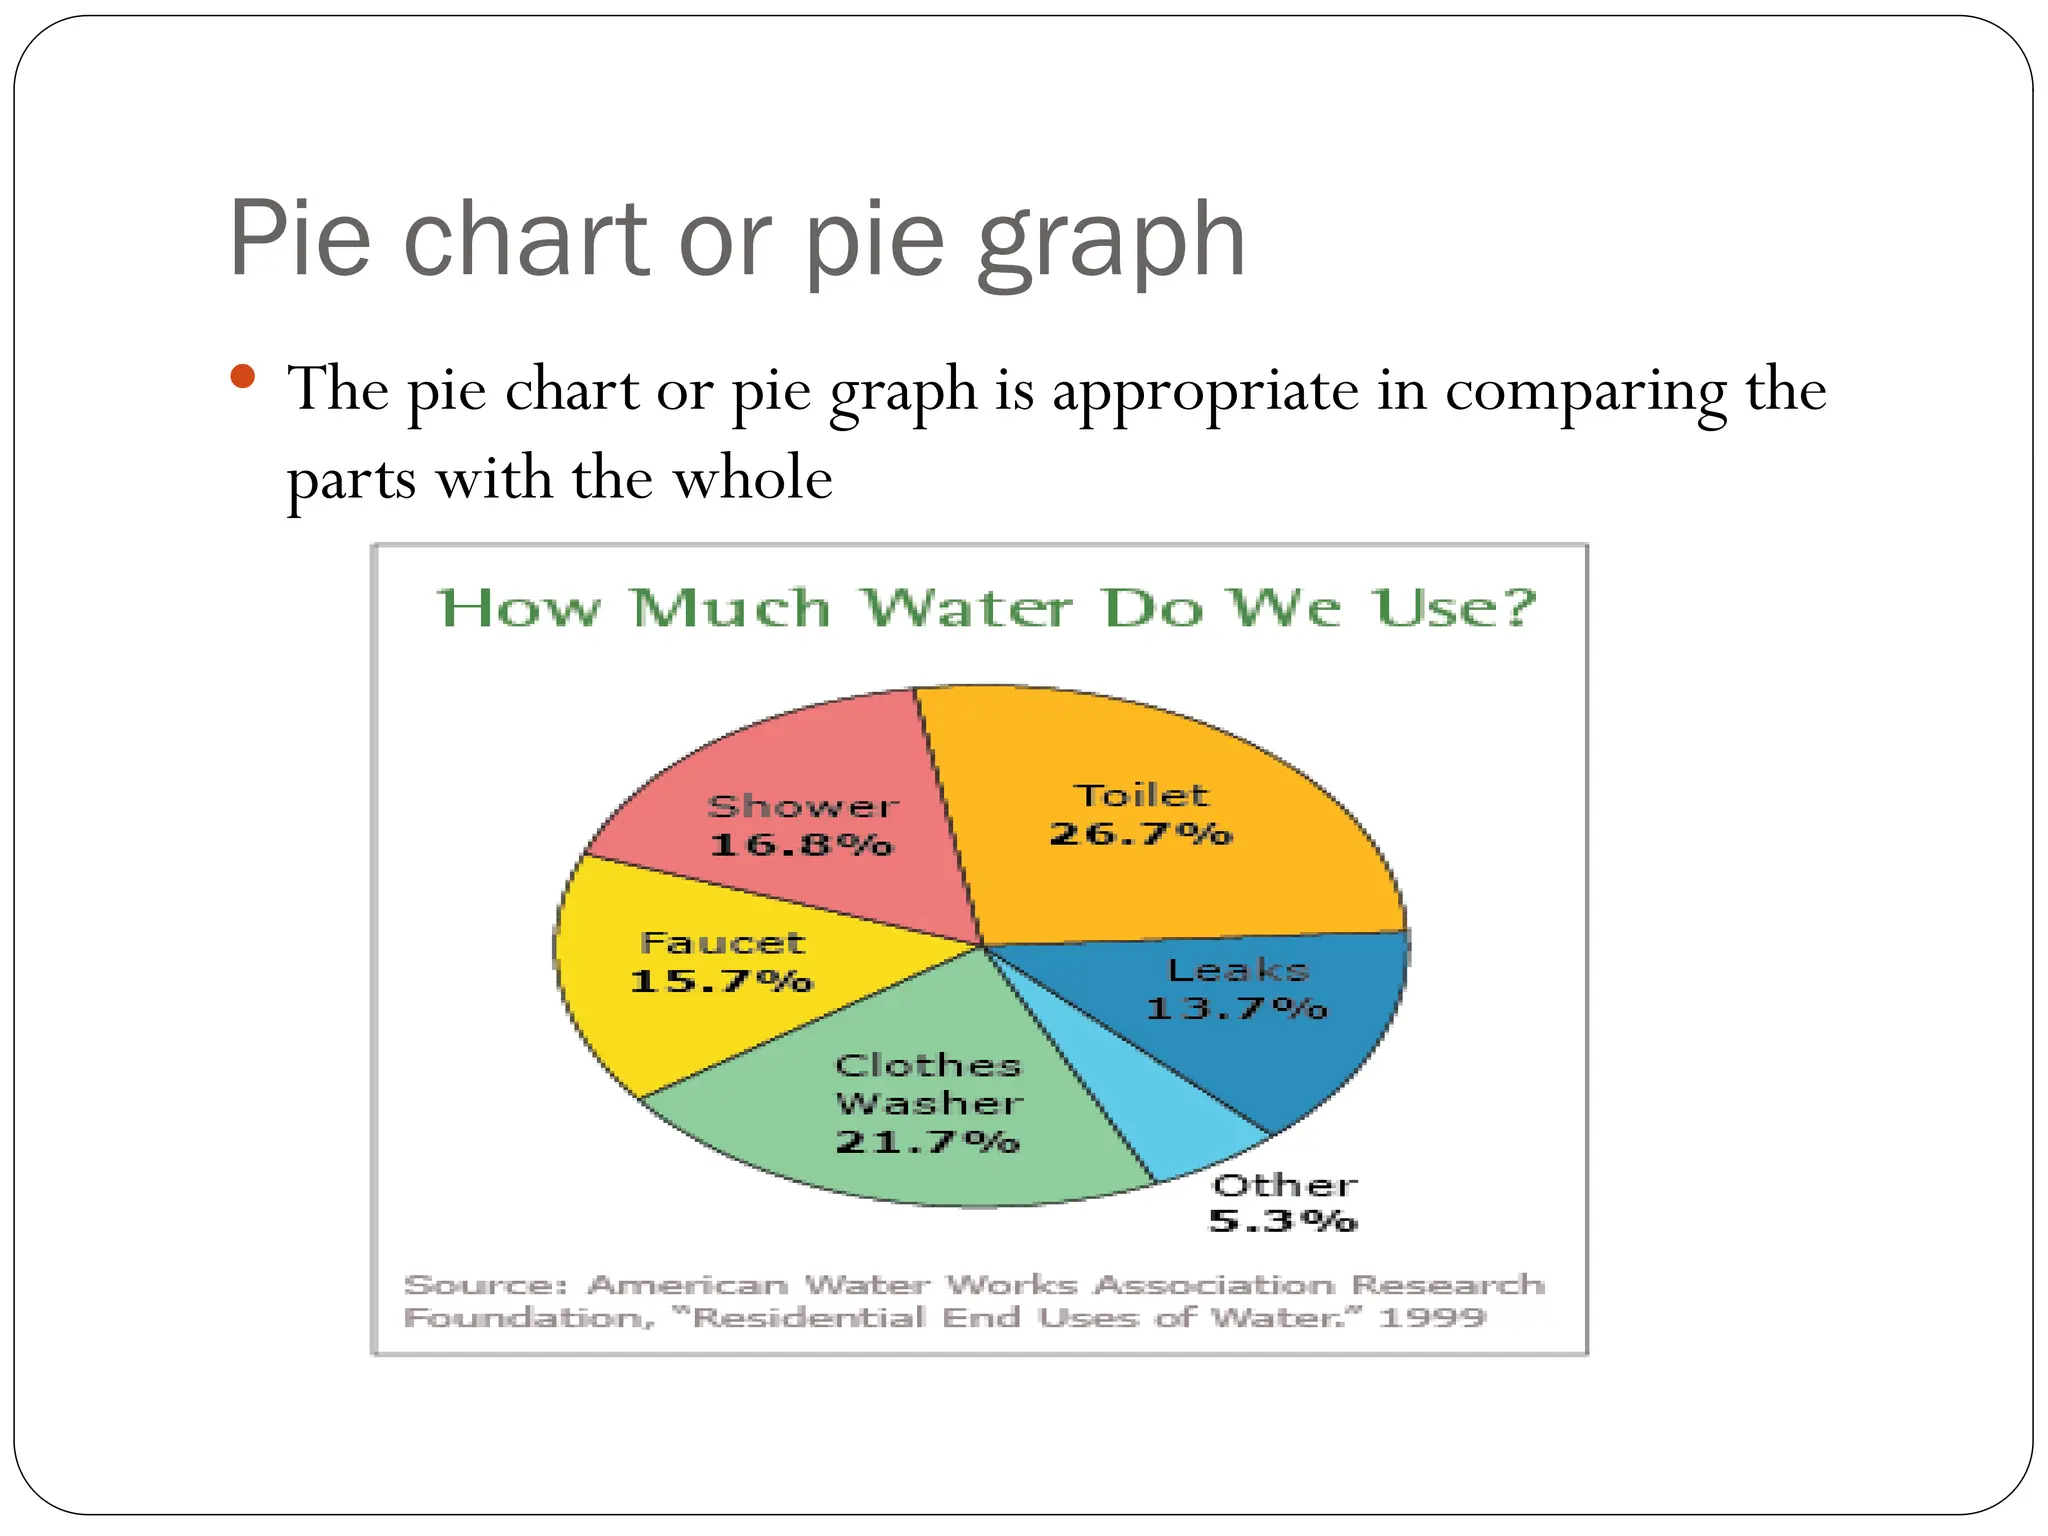
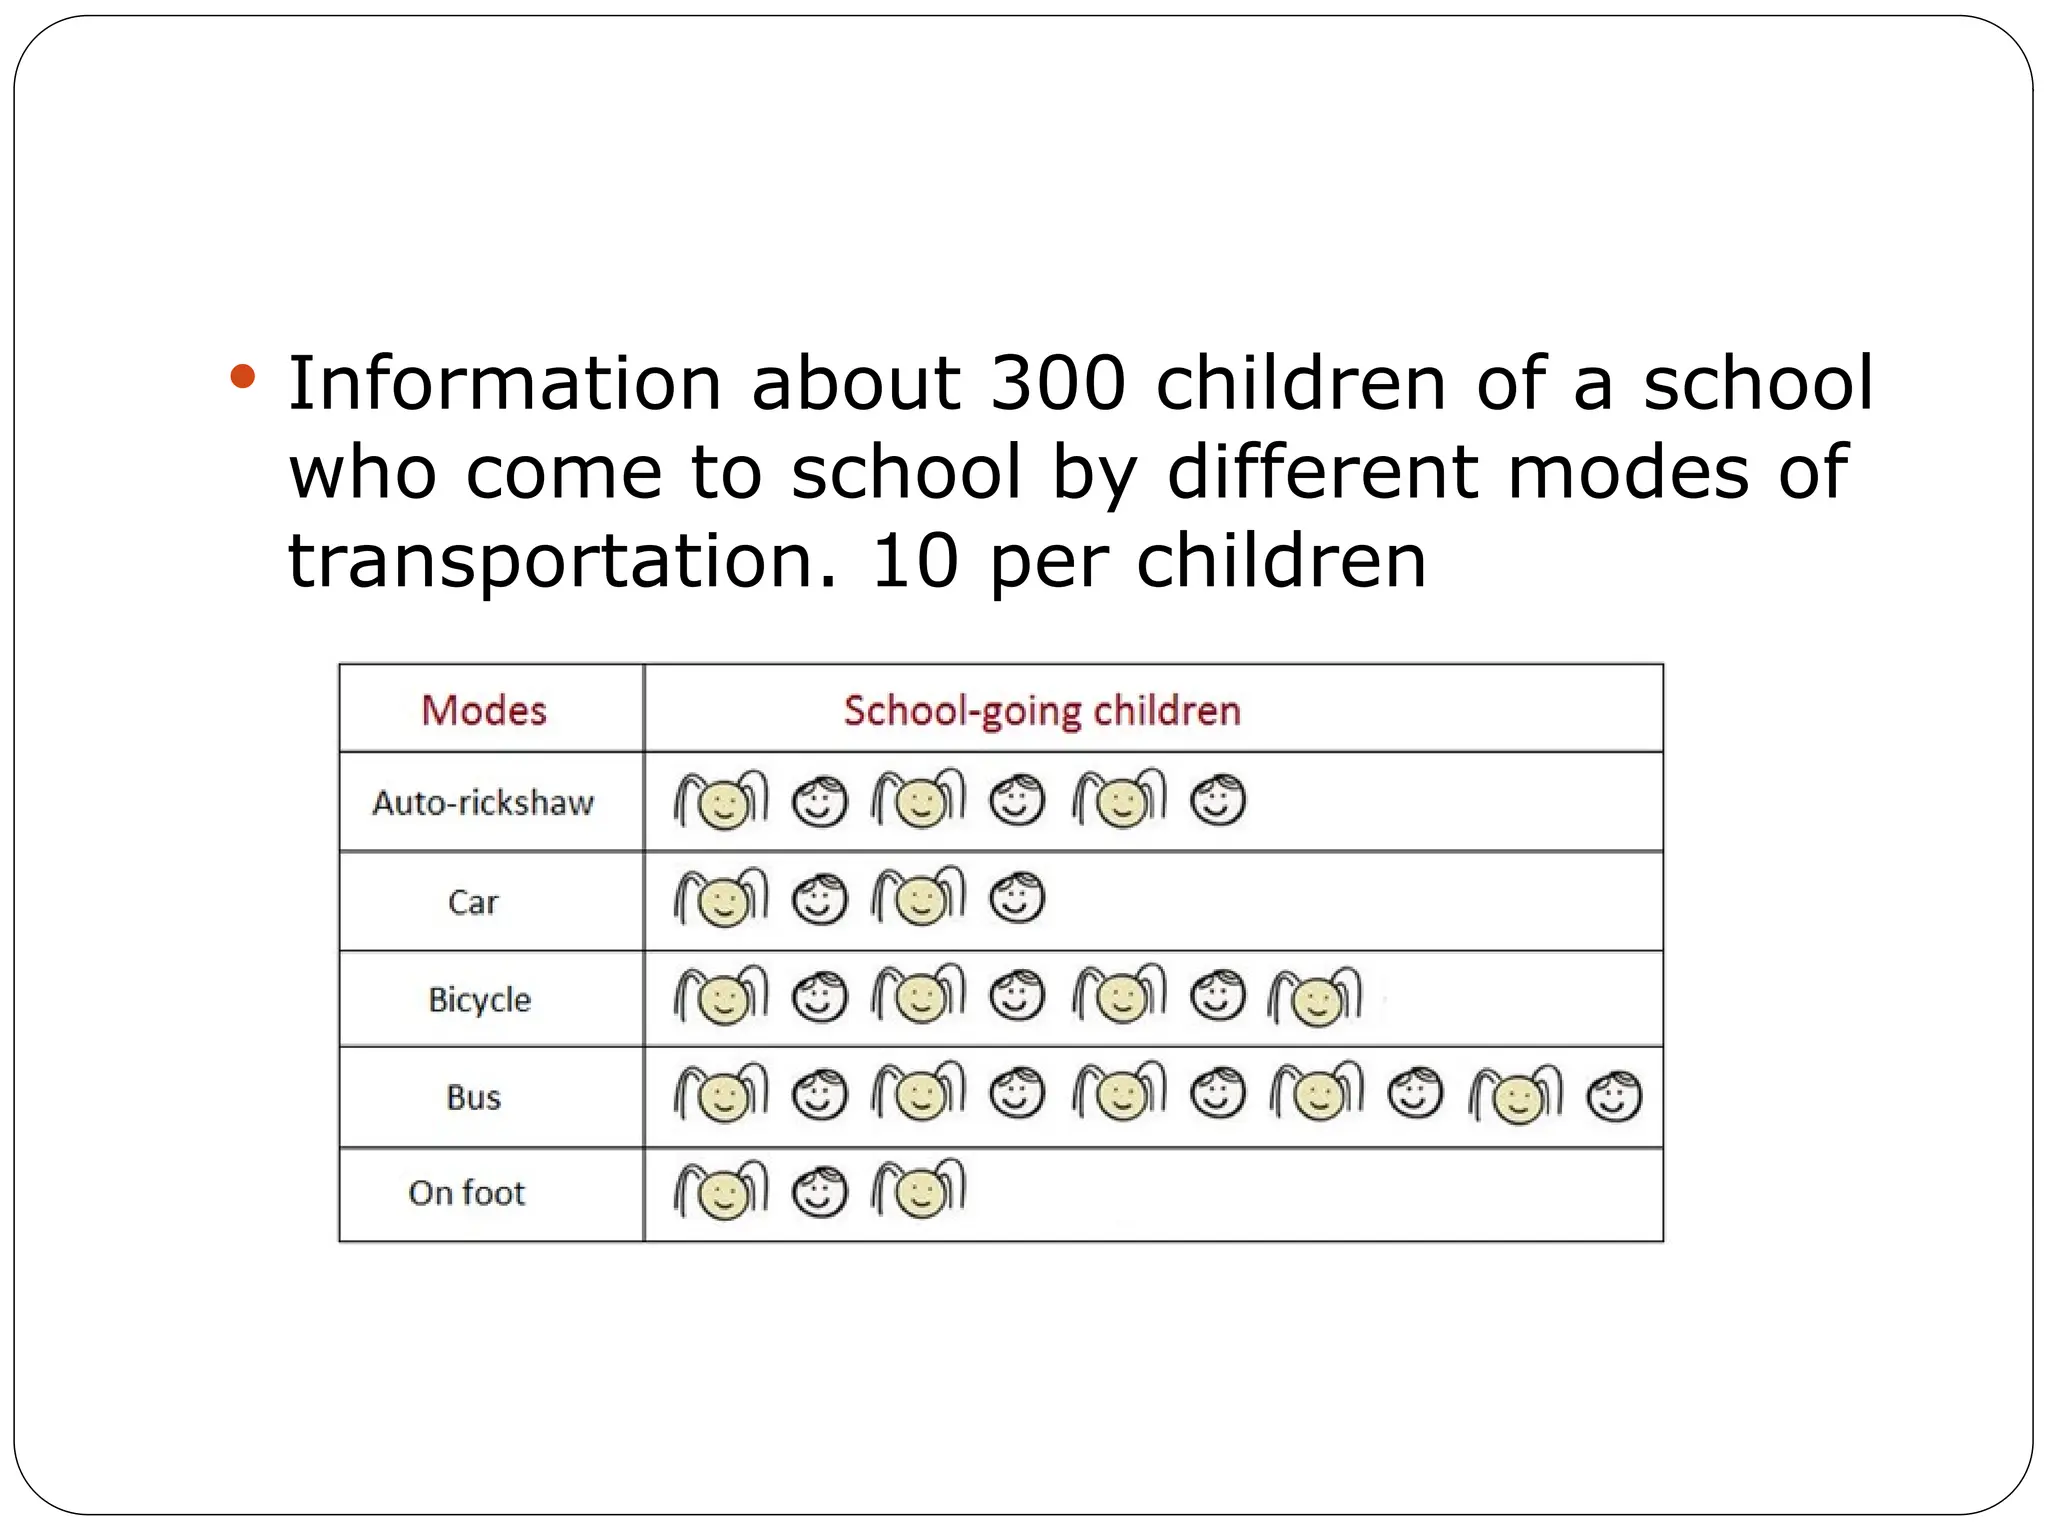
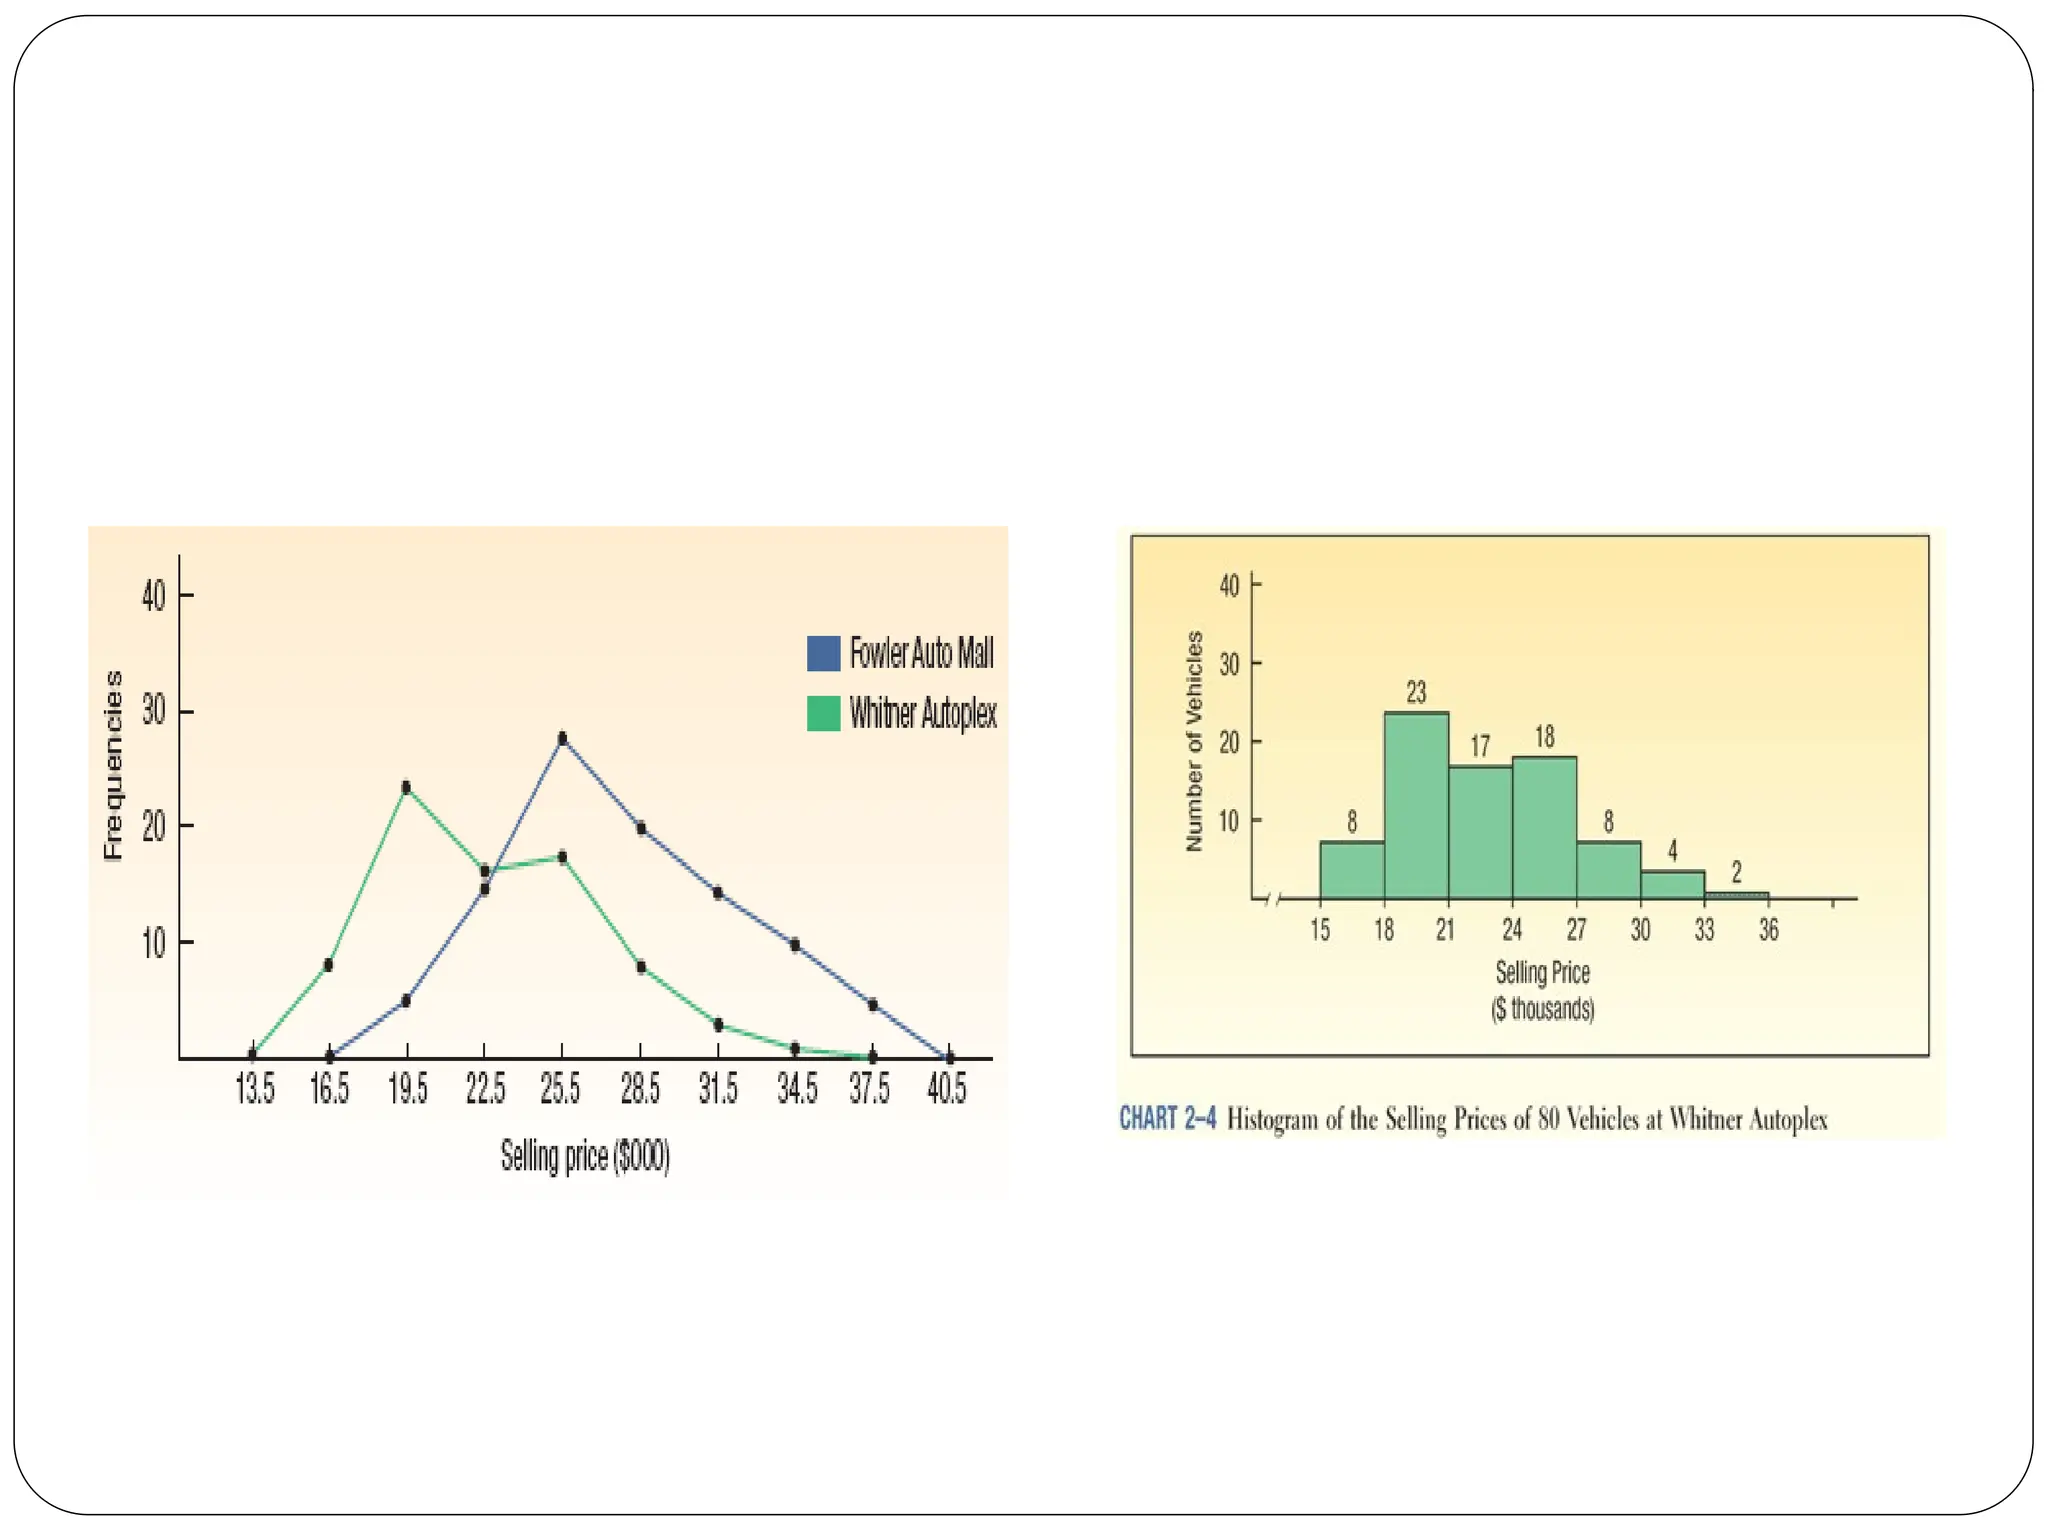
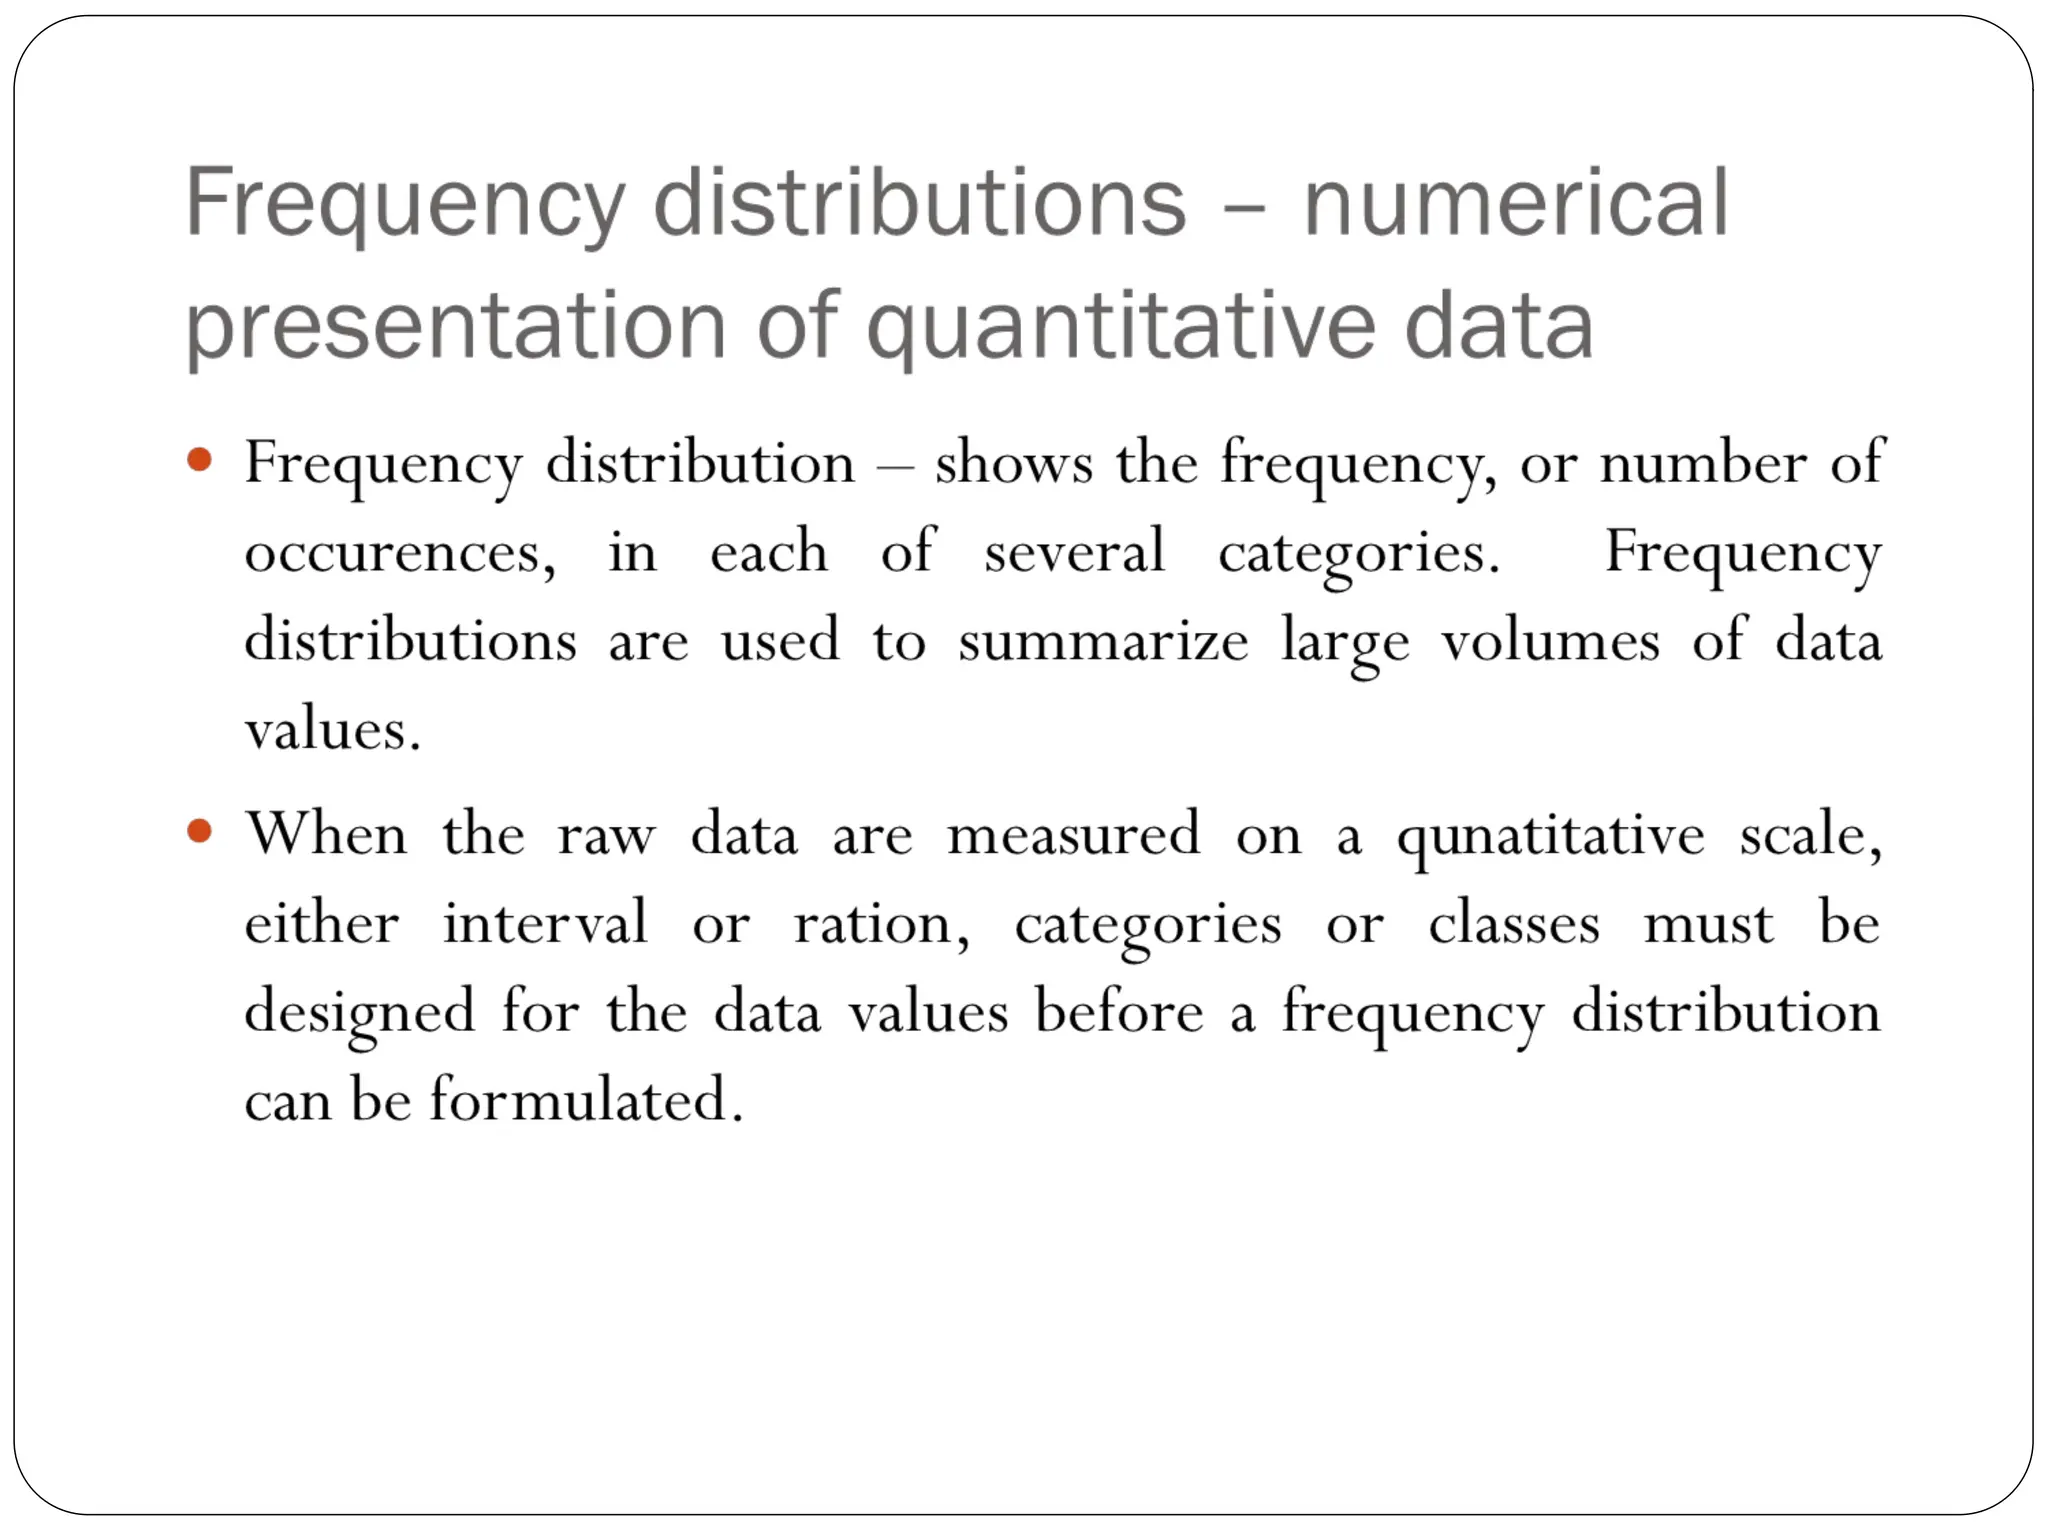
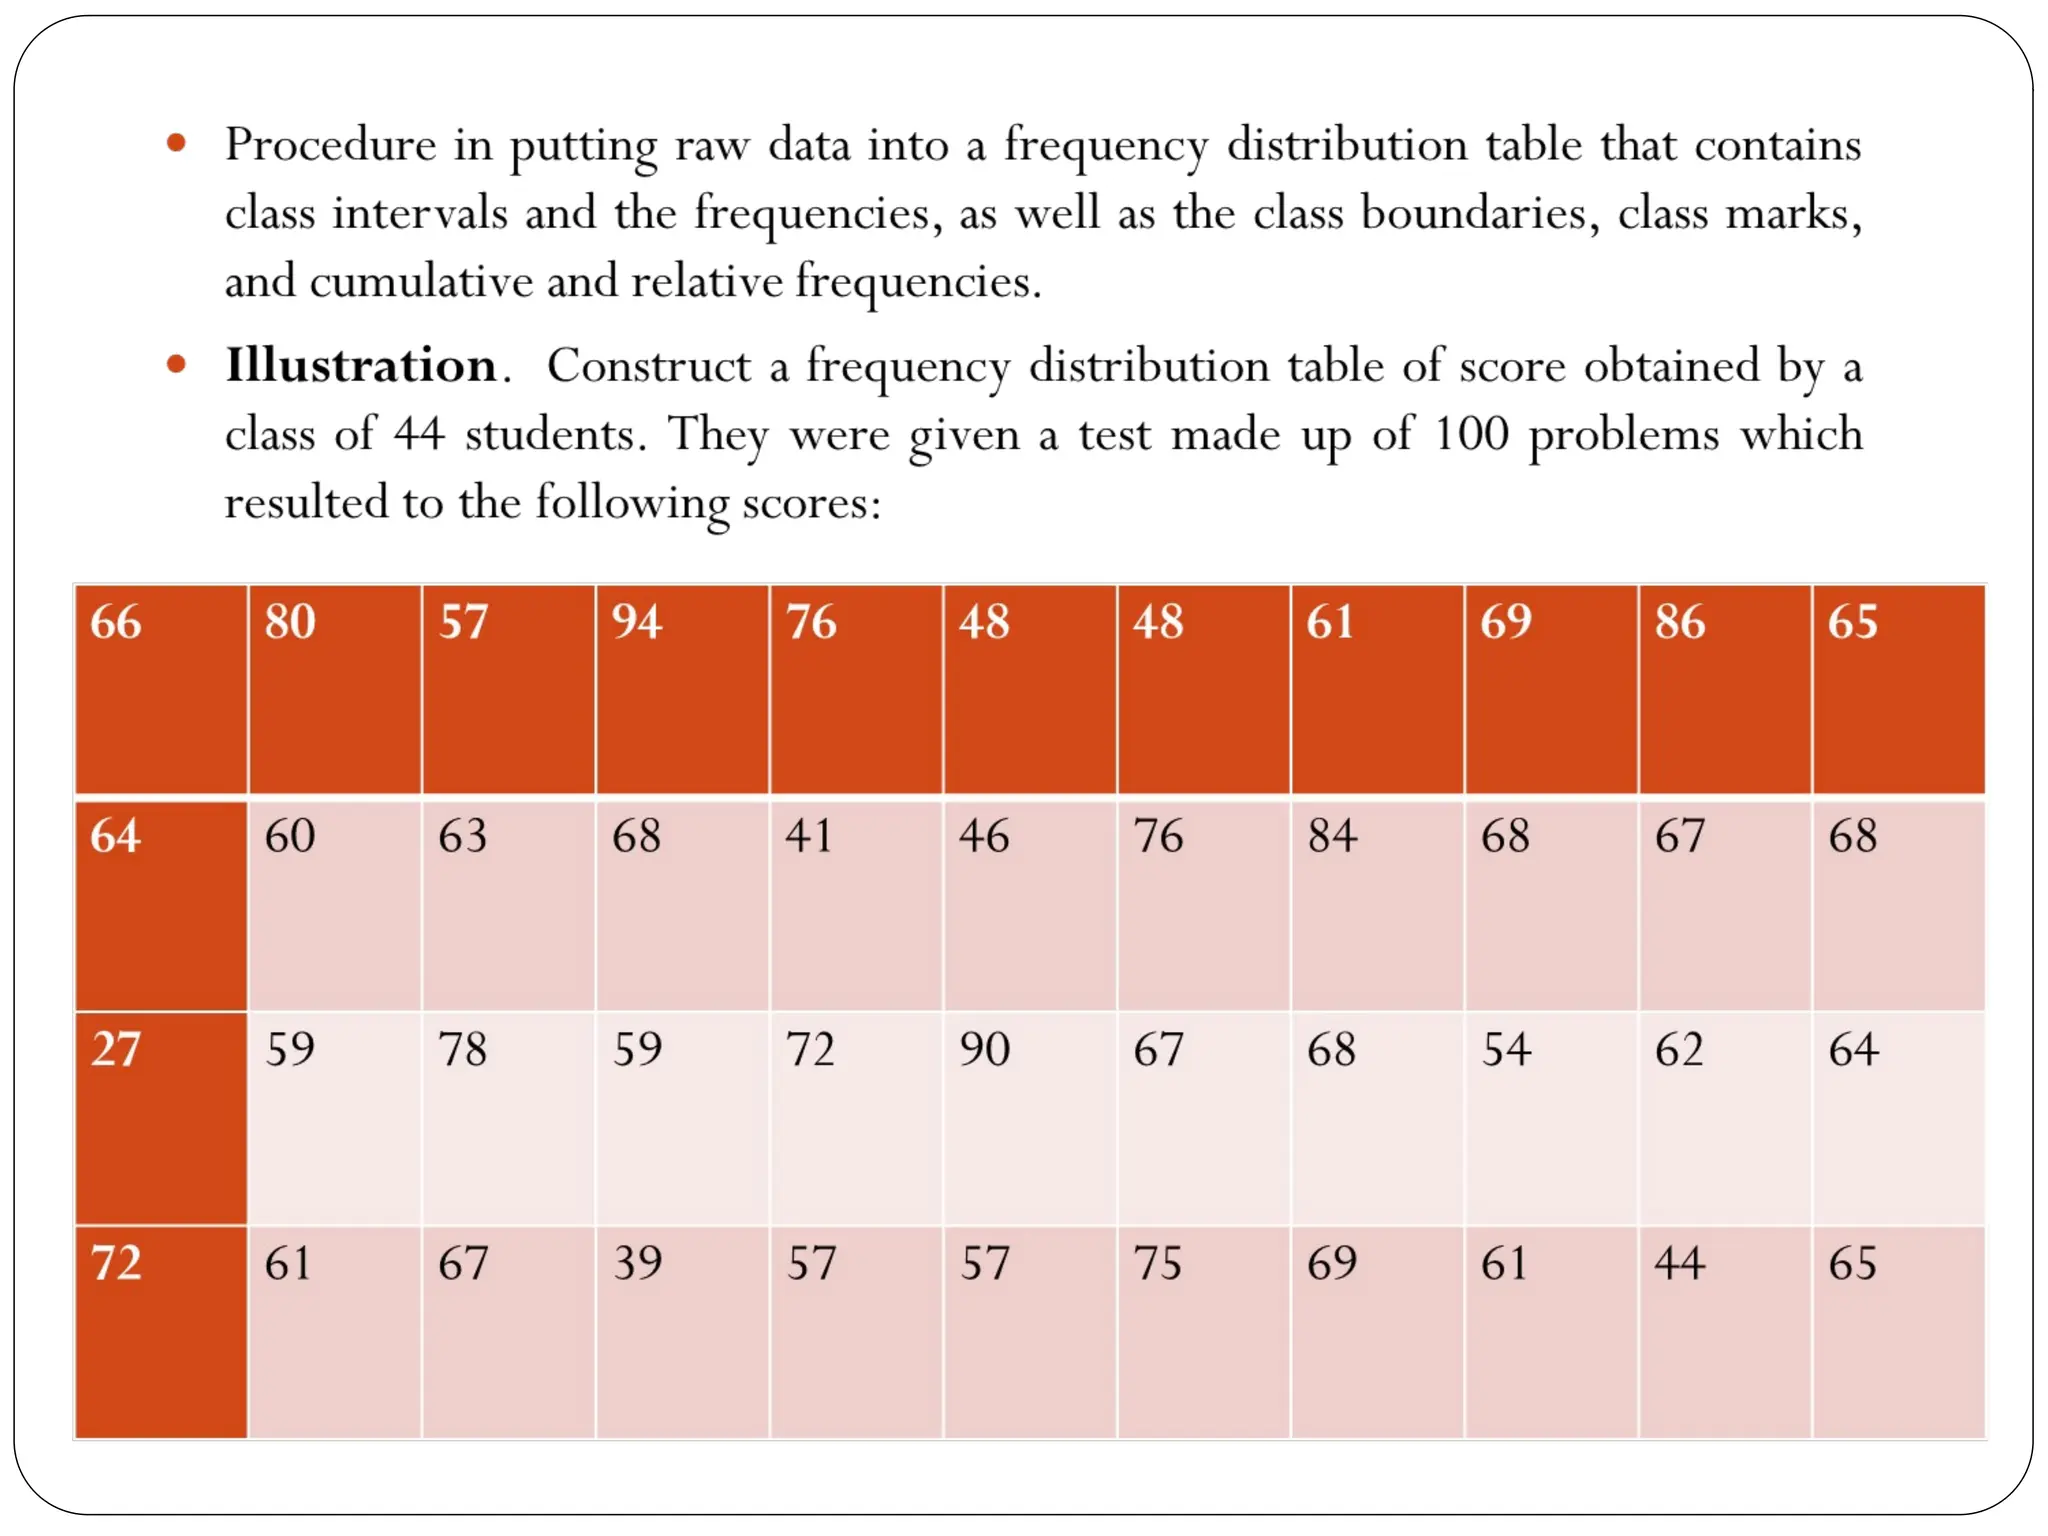
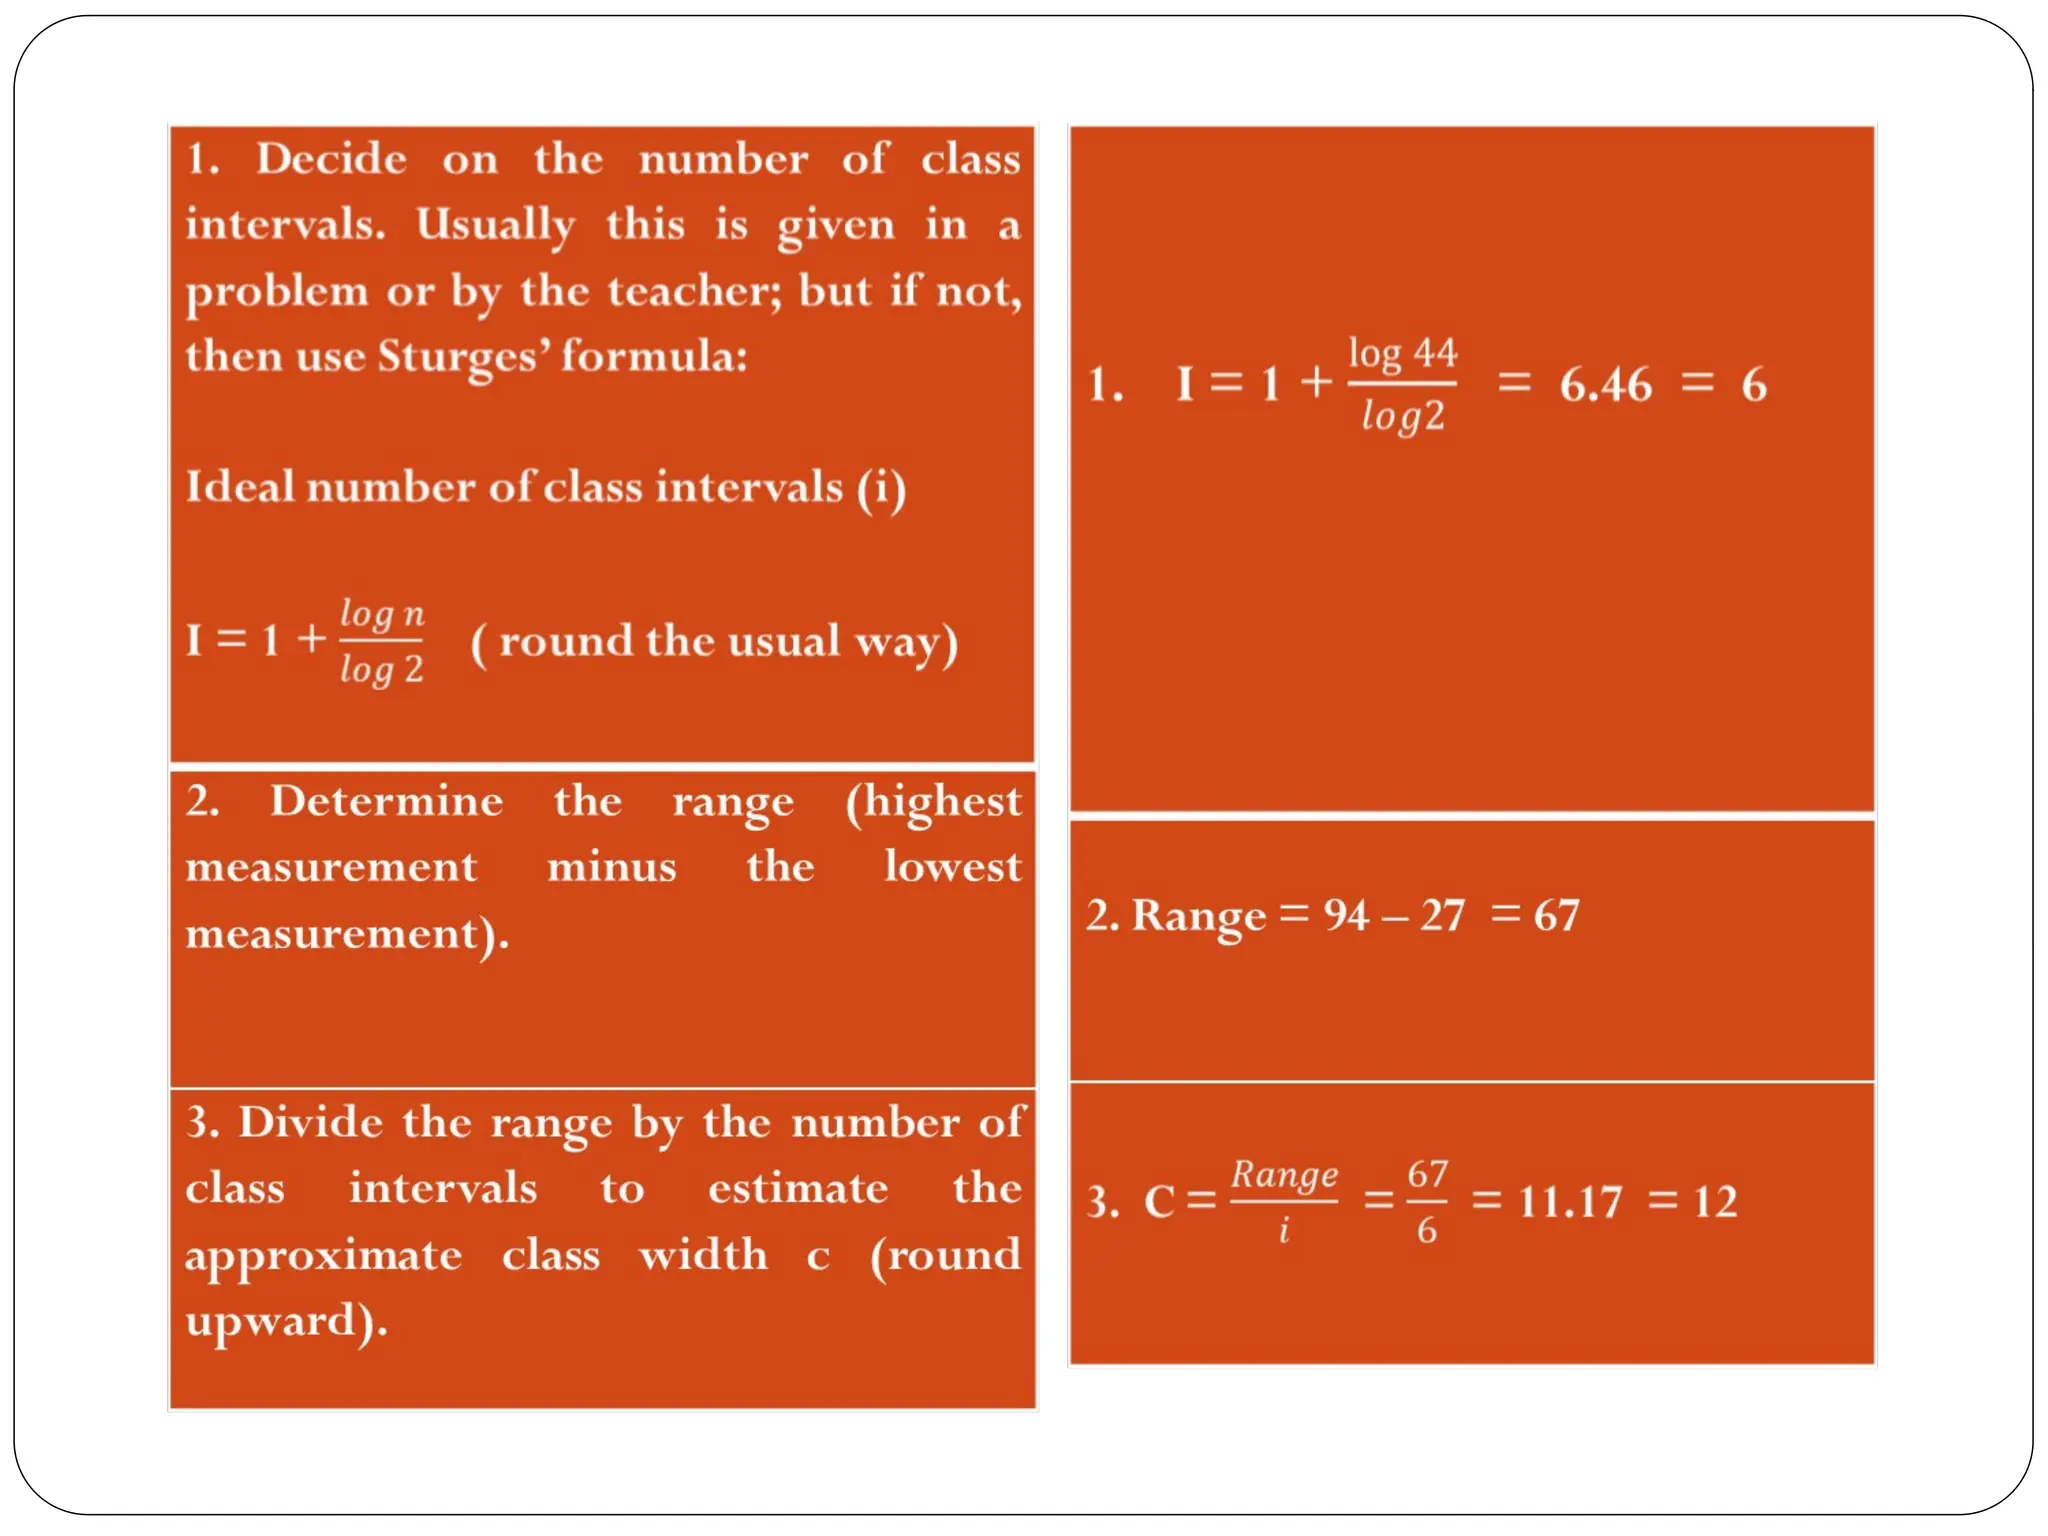
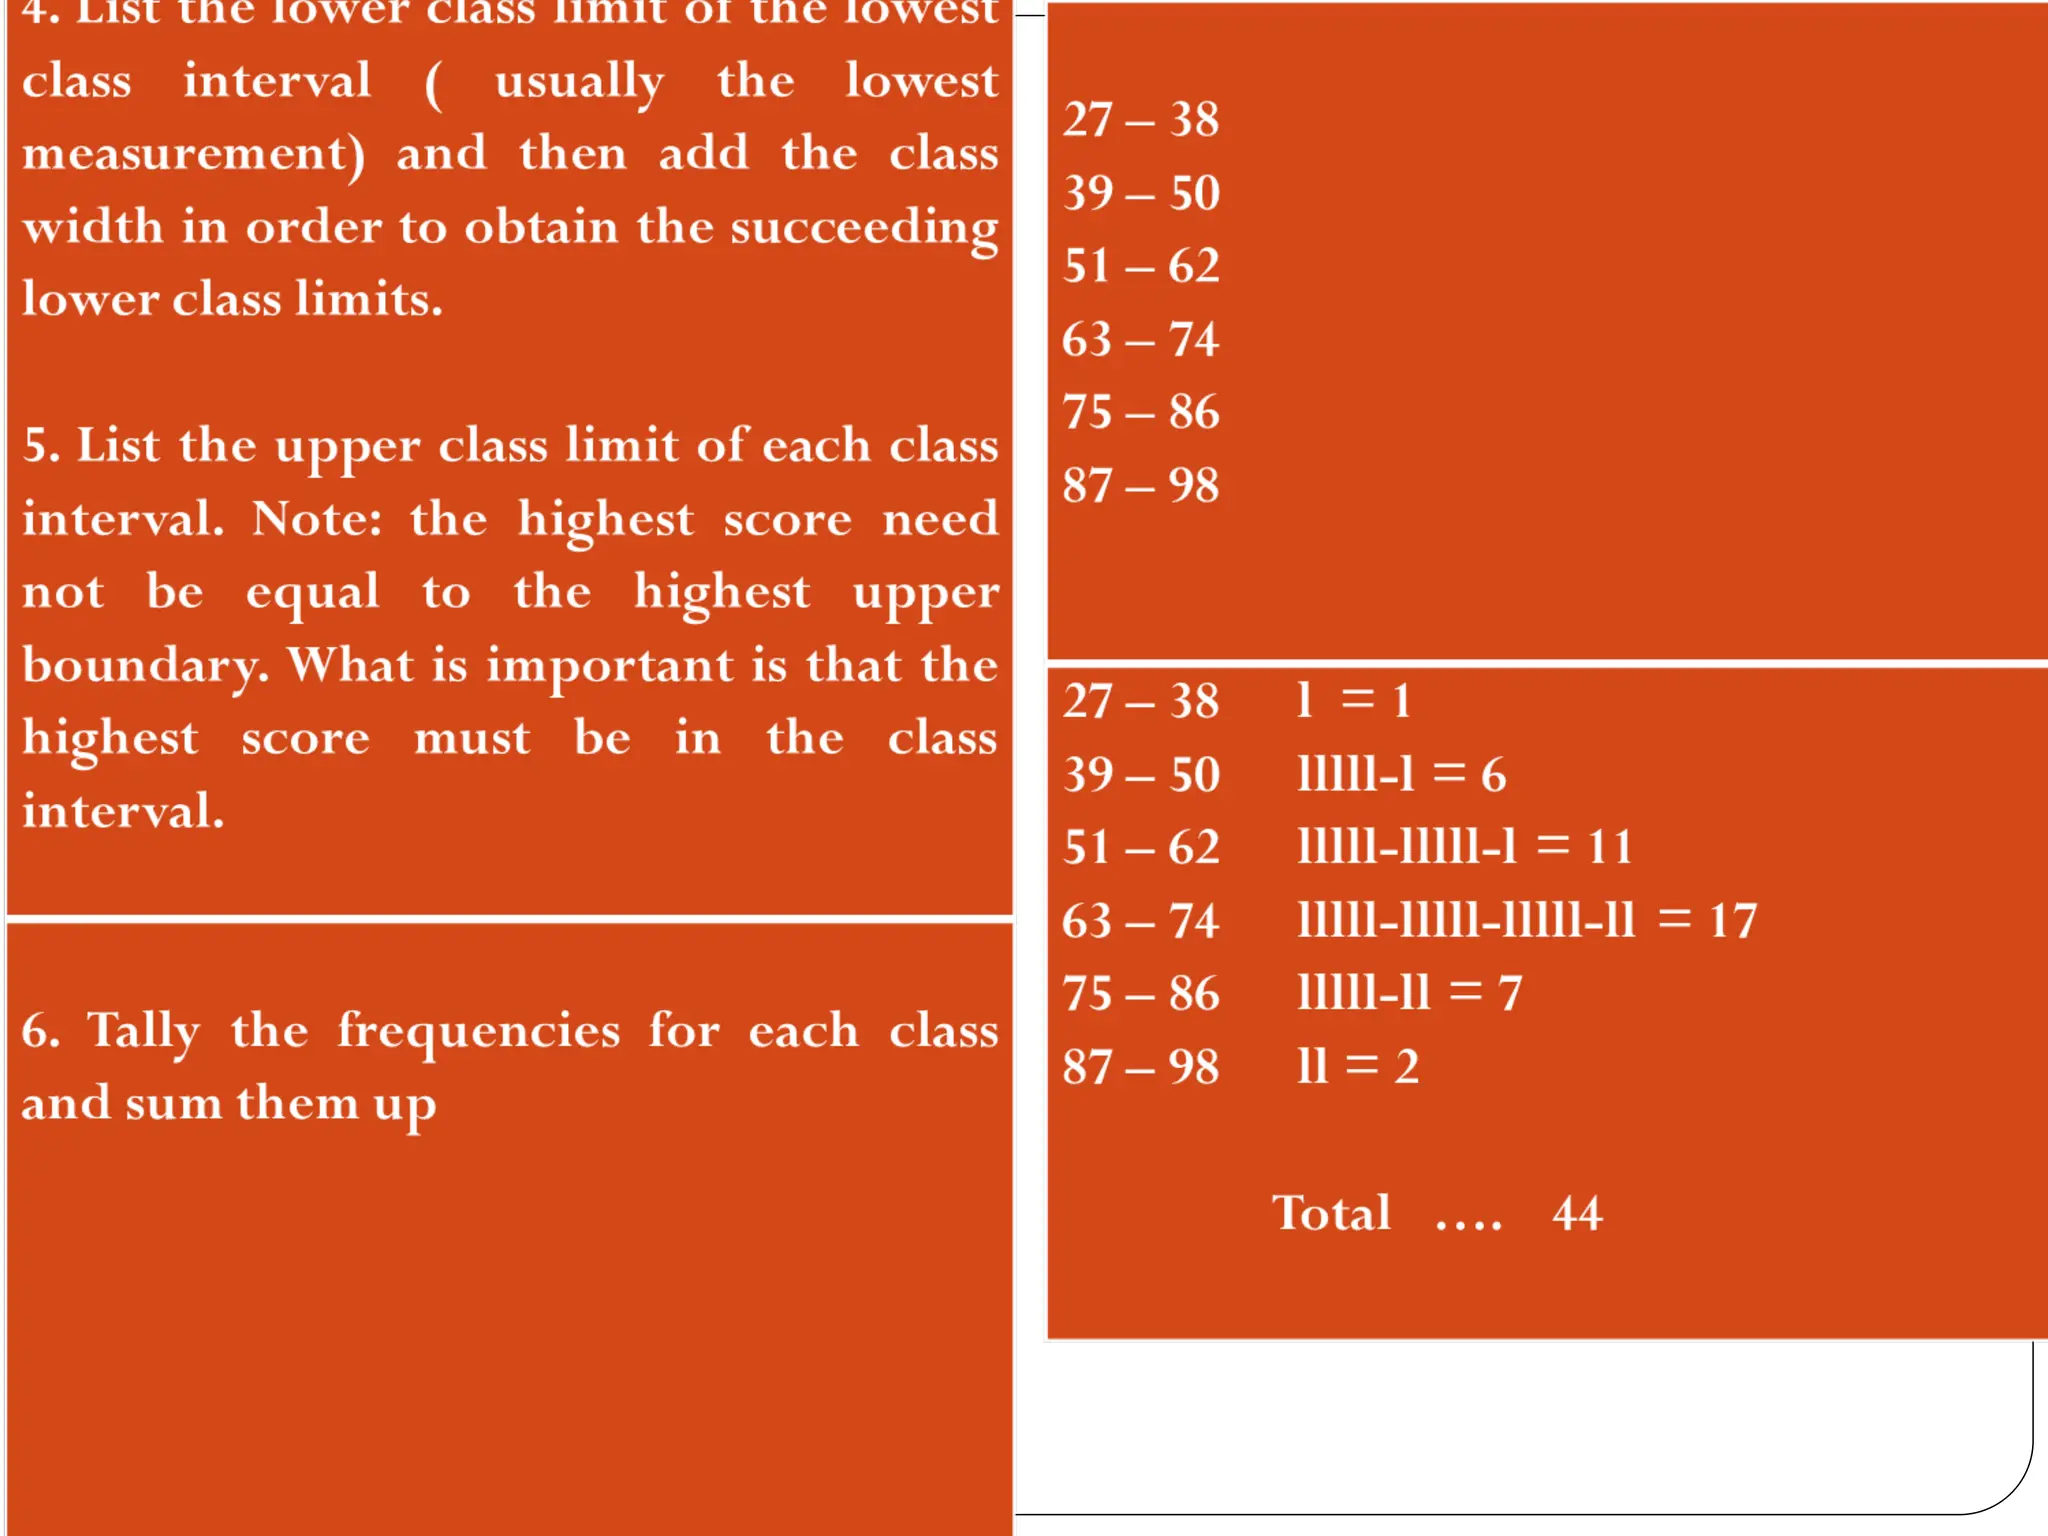
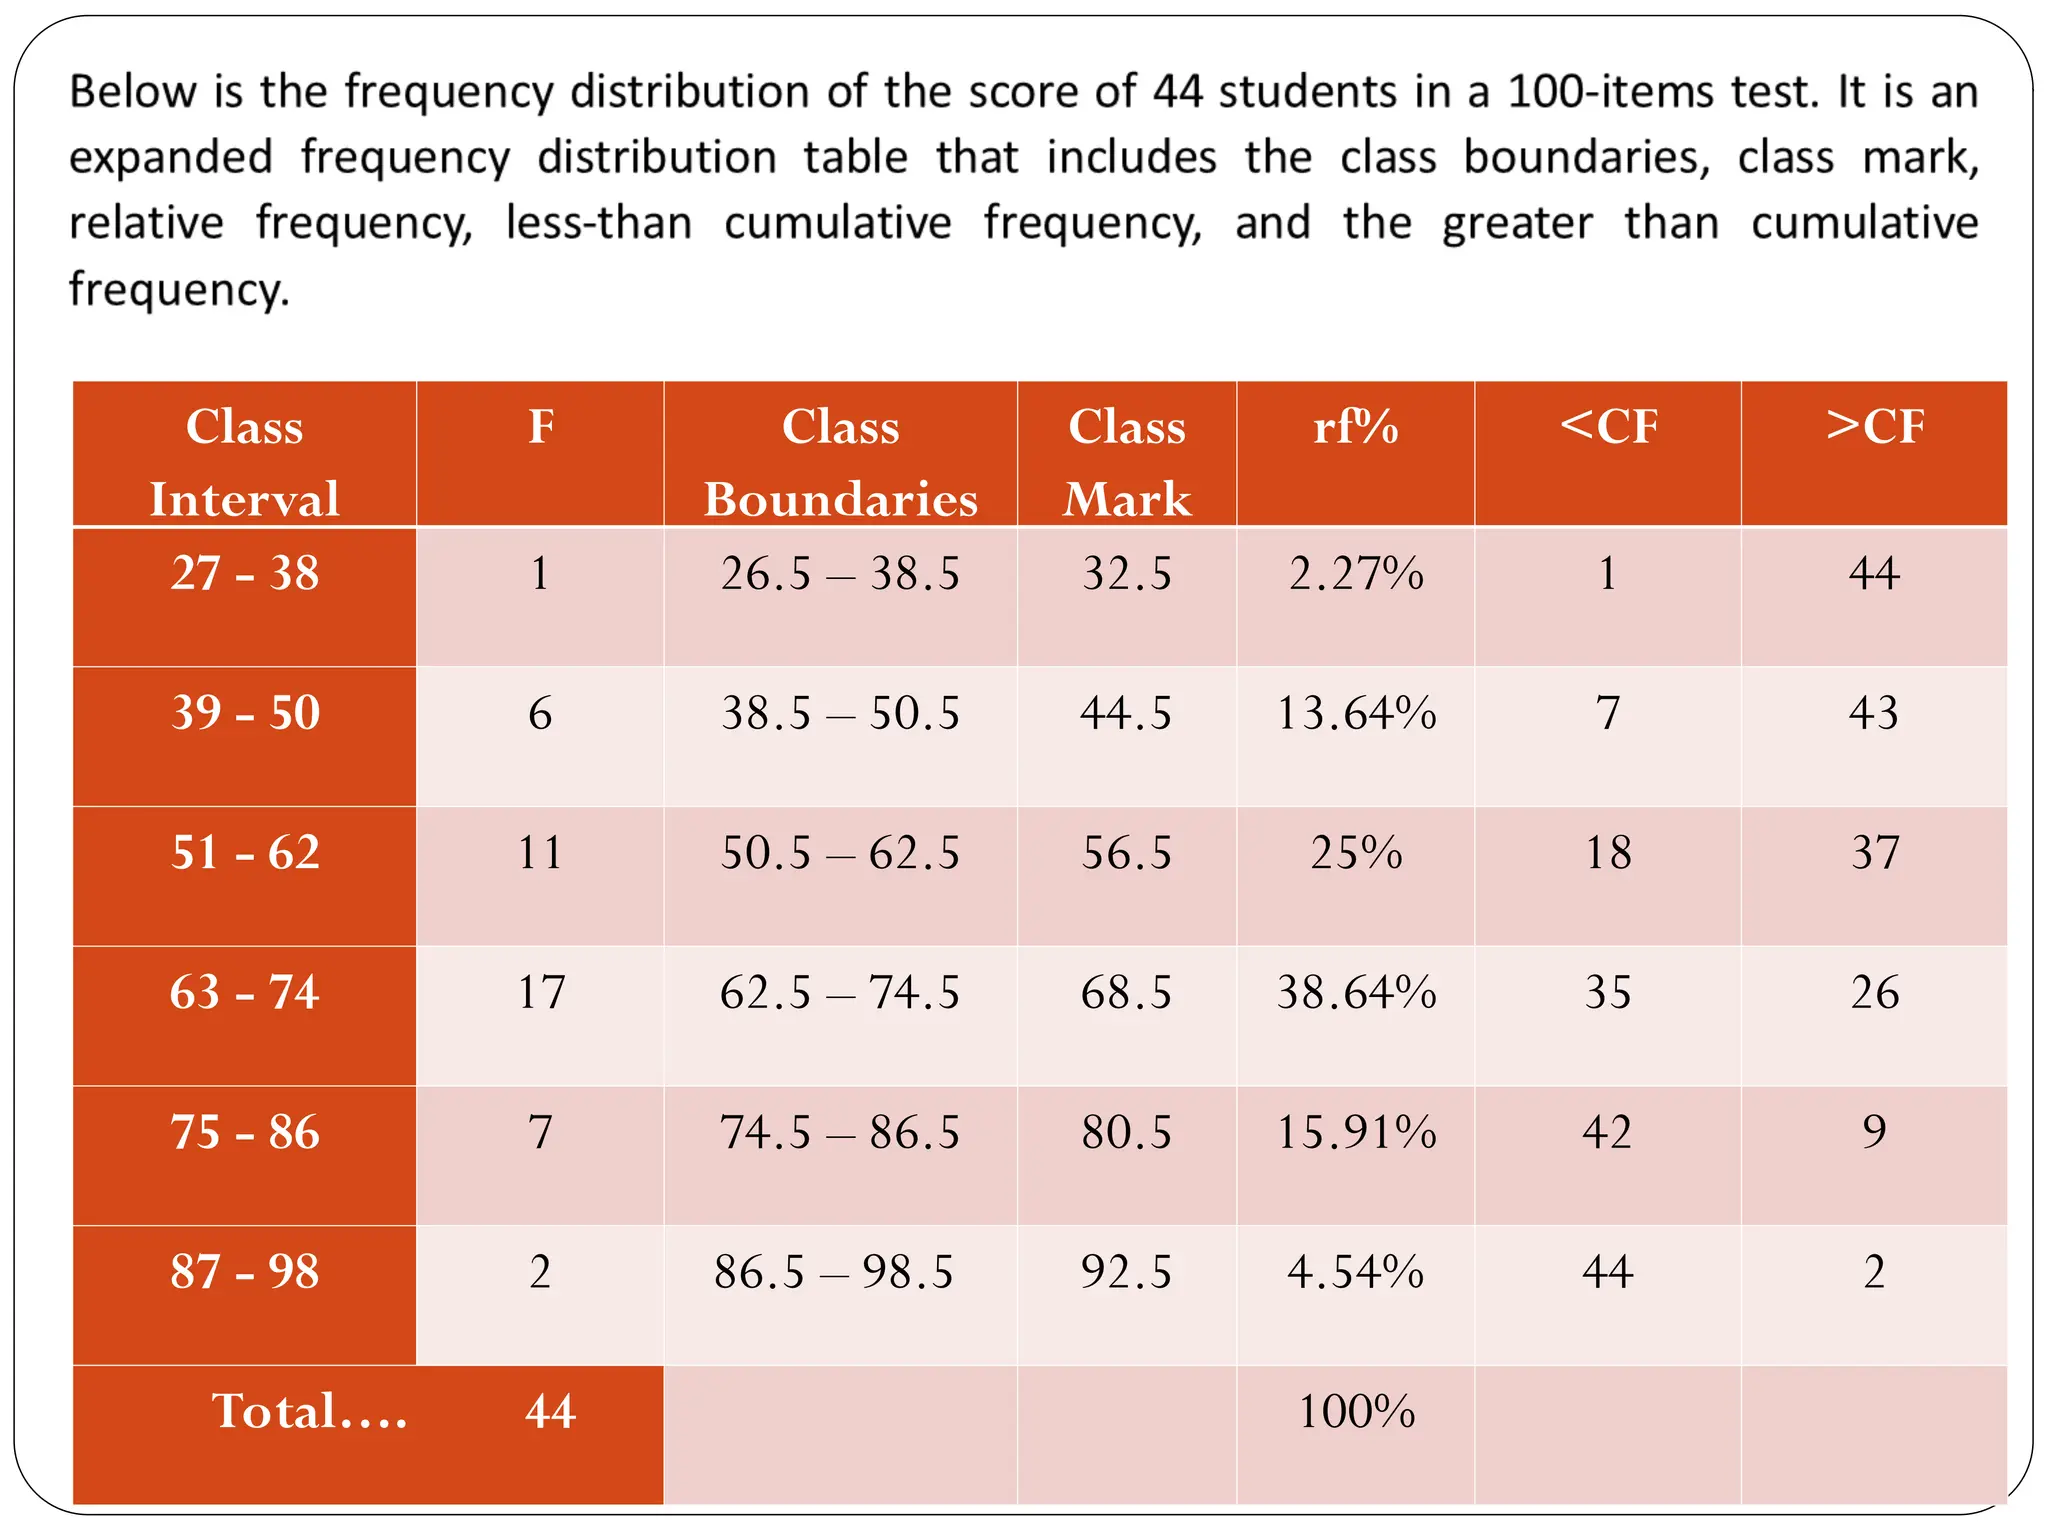
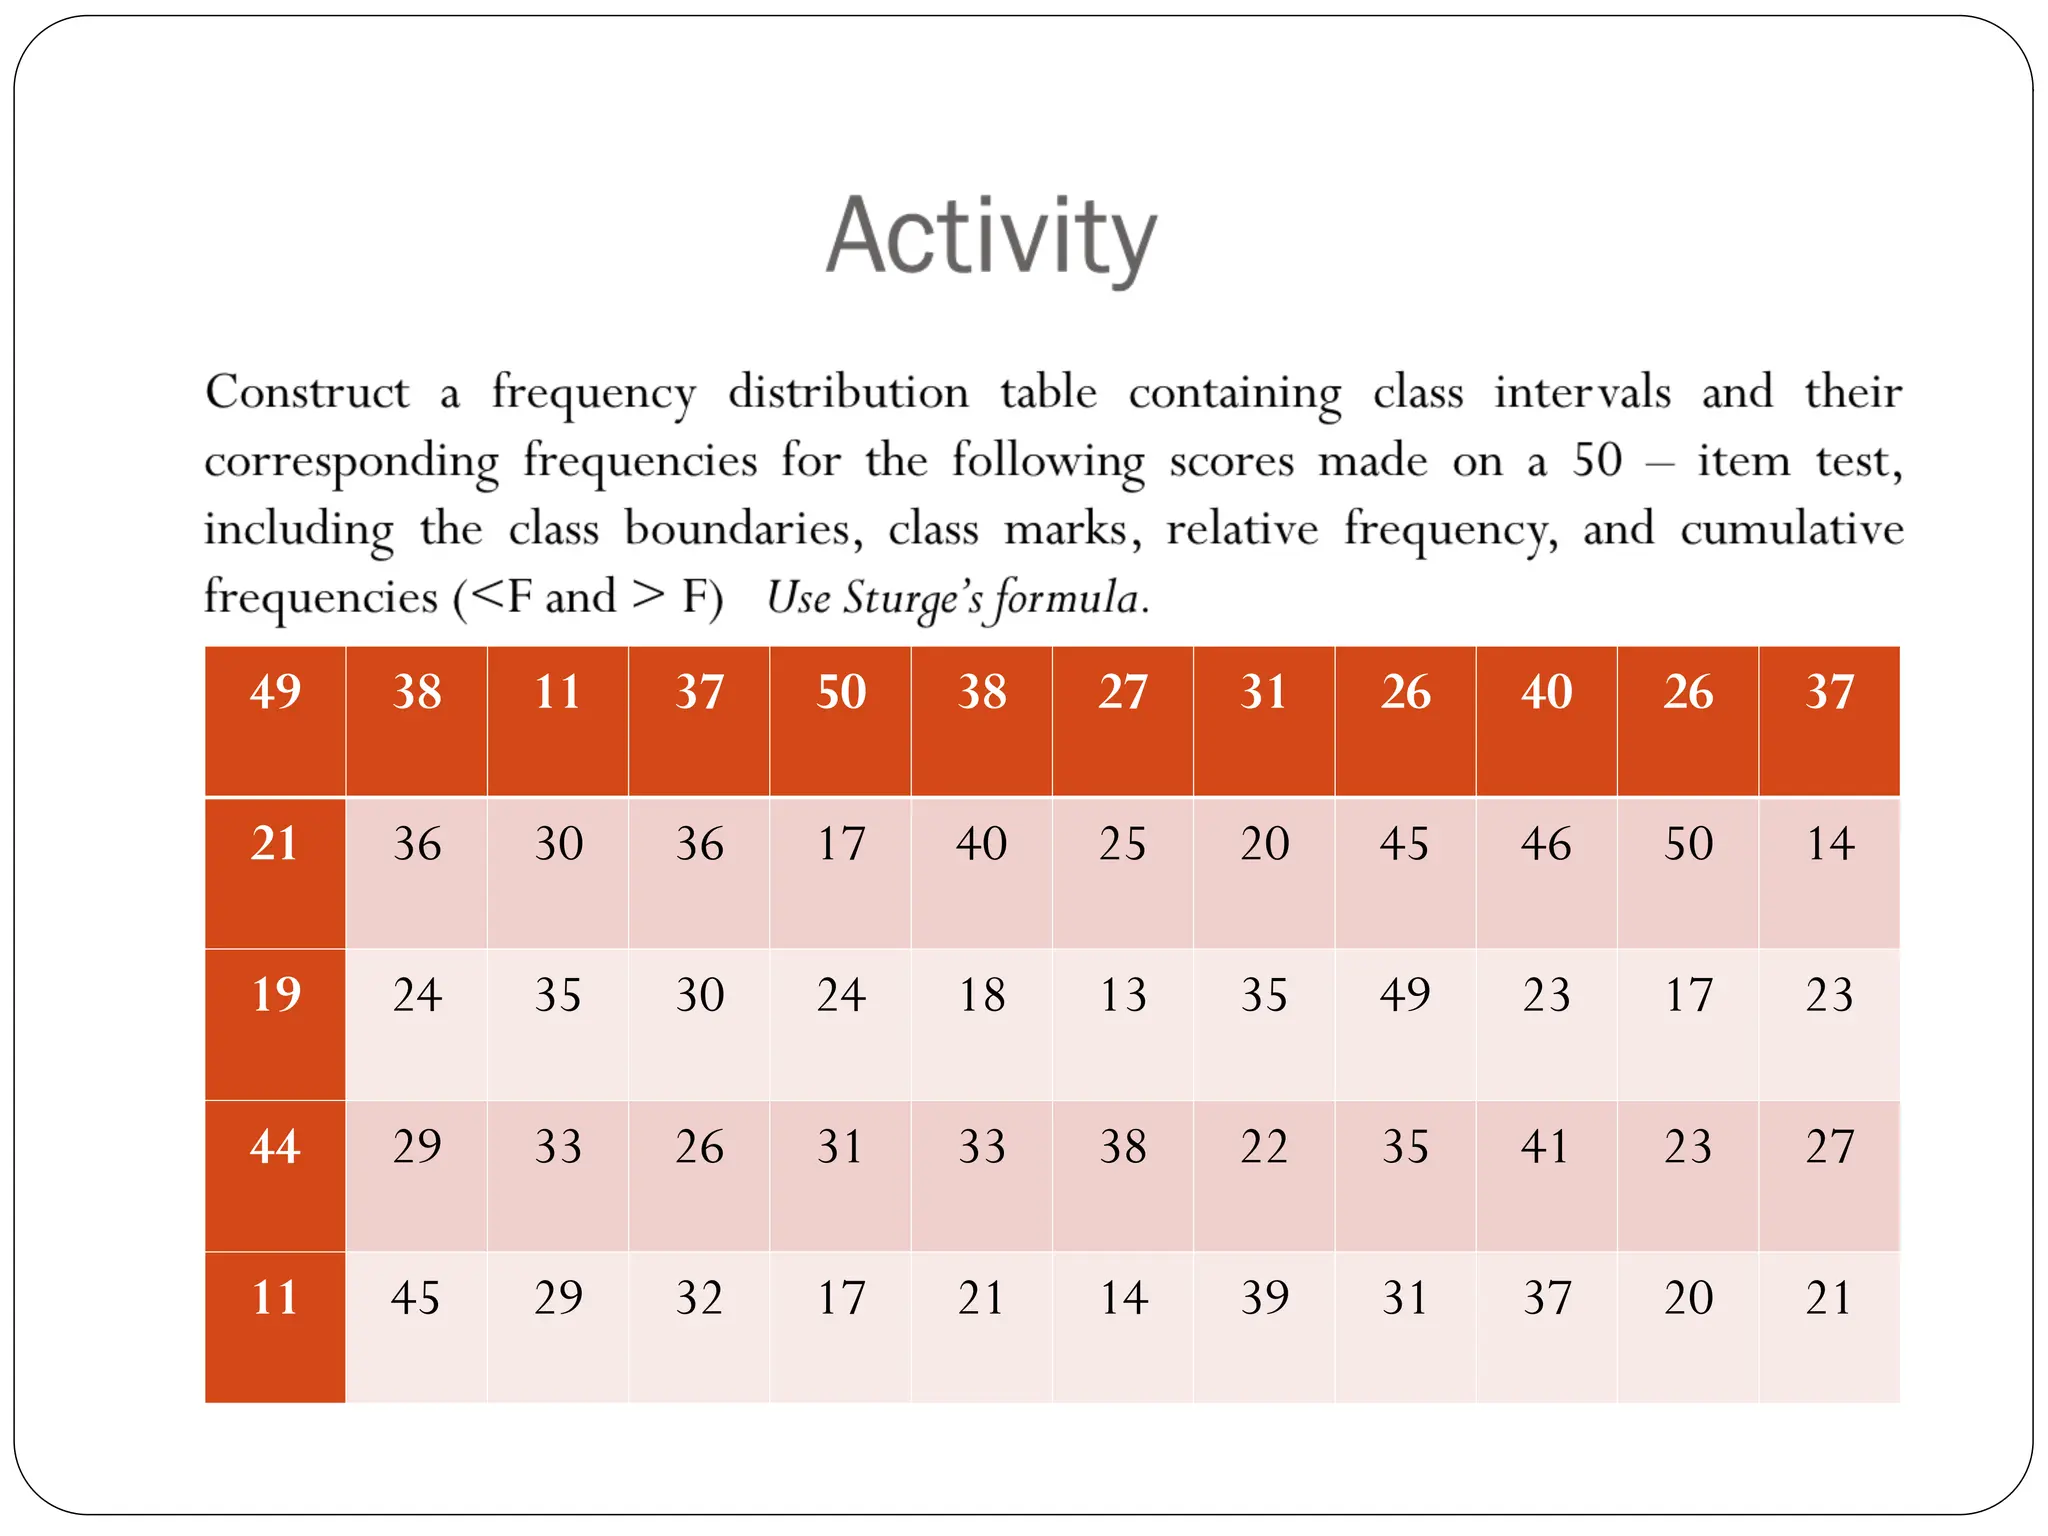
Module 2: Presentation of Data
Objectives
 At the end of this module, you should be able to:
 Familiarize with the different methods of data presentation
 Organize data by constructing a frequency distribution table
 Draw the appropriate graph for a given set of data
Methods of Presenting Data
 Textual Form
where the data are presented in paragraph form or in
sentence form
 Tabular Form
where the data are presented in row and columns
 Graphical Form
where the data are presented in pictorial of visual form
Textual Method
 In this method of data presentation, the researcher uses the
sentences to convey the information contained in the data,
emphasis are only on important figures of the relevance of
the other figures.
Tabular Method
 This method of data presentation makes use of the table
where data are arranged systematically into rows and
columns. This systematic arrangement of data is called
statistical table. Through this process data can be readily
understood and comparisons are more easily be made.
A good statistical table has four
essential parts:
1. Table heading
includes the table number and table title. The title should briefly explain
the contents of the table
2. Stub
items or classification written on the first column and identifies what
are written on the rows
3. Caption or box head
includes the items or classifications written on the first row and
identifies what are contained in the columns.
4. Body
the main part of the table and its contains the substance of the figures
of one’s data
In the construction of a table, the following
guidelines should prove helpful.
 Every table must be self-explanatory
 The title should be clear and descriptive
 The title gives information about what, where, how and
when the data were taken.
Table 1.
Distribution of Population according to year and average
annual rate of increase (%)
Year Population Average Annual Rate of Increase (%)
1877 5567685 2.41
1887 5984727 0.72
1896 6261339 0.5
1903 7635462 2.87
1913 10314310 1.89
1939 16000303 2.22
1948 19234182 1.91
1960 27087685 3.06
1970 36684486 3.01
1975 41831045 2.66
1980 48098000 2.40
Source of Data: National Statistics Office
Frequency Distribution
 A frequency distribution is an arrangement of data that shows
the frequency of occurrence of the different values of the
variables.
 In constructing a qualitative frequency distribution, the
following steps are considered:
a. Enumerate the categories or classifications and define
these as your classes.
b. Count the number of observations falling under each
category. These are the frequencies of the different classes.
Example of a qualitative frequency (according to
particular category)
Year level Number of student
FirstYear 694
SecondYear 339
ThirdYear 214
FourthYear 111
Graphical Method
 This method of data presentation makes use of graphs or
charts. A graph is a pictorial representation of a set of data
showing relationships. Some of the most common type of
graphs are the bar graph, line graph, pie graph and
pictograph.
Types of Graph
 Line graph
The line graph shows the relationship between to or more
sets of quantities. This type of graph is appropriate for a
variable that varies with time.
Population (in millions)
(Sub)continent 1950 1955 1960 1965 1970 1975 1980
Africa 228 254 285 322 366 417 479
The Americas 331 370 416 464 511 561 613
Europe 543 574 605 634 657 677 694
 Line Graph
Name of
Newspaper
Friday Saturday Sunday
Los Angeles
Times
55 58 60
NewYork
Times
62 63 67
Chicago Sun 47 49 49
Orange
County
Register
39 41 42
San Francisco
Chronicle
51 53 55
 Bar graph
The bar graph consists of vertical or horizontal bars of
equal widths. The length of the bars represent the magnitudes of
the quantities being compared. This type of graph is most
appropriate for comparing data at a particular time.
Example
 Imagine you just did a survey of your friends to find which
kind of movie they liked best:
Table: Favorite Type of Movie
Comedy Action Romance Drama SciFi
4 5 6 1 4
Pie chart or pie graph
 The pie chart or pie graph is appropriate in comparing the
parts with the whole
Pictograph
 Another way of representing numerical values is though the
use of pictographs or picture graphs. In this type of chart,
actual pictures of facsimiles of the objects under study are
used the represent values. Each figure is considered a unit
representing a definite number.
 Information about 300 children of a school
who come to school by different modes of
transportation. 10 per children
Graphical Representation of a
Frequency
 There are two graphical methods in the presentation of
frequency distribution
 Histogram Versus Frequency
Polygon
 Both provide a quick picture of the main characteristics of the
data (highs, lows, points of concentration, etc.)
 The histogram has the advantage of depicting each class as a
rectangle, with the height of the rectangular bar representing the
number in each class.
 The frequency polygon has an advantage over the histogram. It
allows us to compare directly two or more frequency
distributions.
Class
Interval
F Class
Boundaries
Class
Mark
rf% <CF >CF
27 - 38 1 26.5 – 38.5 32.5 2.27% 1 44
39 - 50 6 38.5 – 50.5 44.5 13.64% 7 43
51 - 62 11 50.5 – 62.5 56.5 25% 18 37
63 - 74 17 62.5 – 74.5 68.5 38.64% 35 26
75 - 86 7 74.5 – 86.5 80.5 15.91% 42 9
87 - 98 2 86.5 – 98.5 92.5 4.54% 44 2
Total…. 44 100%
49 38 11 37 50 38 27 31 26 40 26 37
21 36 30 36 17 40 25 20 45 46 50 14
19 24 35 30 24 18 13 35 49 23 17 23
44 29 33 26 31 33 38 22 35 41 23 27
11 45 29 32 17 21 14 39 31 37 20 21
It's a presentation of data in Statistics.

It's a presentation of data in Statistics.

  • 1.
  • 2.
    Objectives  At theend of this module, you should be able to:  Familiarize with the different methods of data presentation  Organize data by constructing a frequency distribution table  Draw the appropriate graph for a given set of data
  • 3.
    Methods of PresentingData  Textual Form where the data are presented in paragraph form or in sentence form  Tabular Form where the data are presented in row and columns  Graphical Form where the data are presented in pictorial of visual form
  • 4.
    Textual Method  Inthis method of data presentation, the researcher uses the sentences to convey the information contained in the data, emphasis are only on important figures of the relevance of the other figures.
  • 5.
    Tabular Method  Thismethod of data presentation makes use of the table where data are arranged systematically into rows and columns. This systematic arrangement of data is called statistical table. Through this process data can be readily understood and comparisons are more easily be made.
  • 6.
    A good statisticaltable has four essential parts: 1. Table heading includes the table number and table title. The title should briefly explain the contents of the table 2. Stub items or classification written on the first column and identifies what are written on the rows 3. Caption or box head includes the items or classifications written on the first row and identifies what are contained in the columns. 4. Body the main part of the table and its contains the substance of the figures of one’s data
  • 7.
    In the constructionof a table, the following guidelines should prove helpful.  Every table must be self-explanatory  The title should be clear and descriptive  The title gives information about what, where, how and when the data were taken.
  • 8.
    Table 1. Distribution ofPopulation according to year and average annual rate of increase (%) Year Population Average Annual Rate of Increase (%) 1877 5567685 2.41 1887 5984727 0.72 1896 6261339 0.5 1903 7635462 2.87 1913 10314310 1.89 1939 16000303 2.22 1948 19234182 1.91 1960 27087685 3.06 1970 36684486 3.01 1975 41831045 2.66 1980 48098000 2.40 Source of Data: National Statistics Office
  • 9.
    Frequency Distribution  Afrequency distribution is an arrangement of data that shows the frequency of occurrence of the different values of the variables.  In constructing a qualitative frequency distribution, the following steps are considered: a. Enumerate the categories or classifications and define these as your classes. b. Count the number of observations falling under each category. These are the frequencies of the different classes.
  • 10.
    Example of aqualitative frequency (according to particular category) Year level Number of student FirstYear 694 SecondYear 339 ThirdYear 214 FourthYear 111
  • 11.
    Graphical Method  Thismethod of data presentation makes use of graphs or charts. A graph is a pictorial representation of a set of data showing relationships. Some of the most common type of graphs are the bar graph, line graph, pie graph and pictograph.
  • 12.
    Types of Graph Line graph The line graph shows the relationship between to or more sets of quantities. This type of graph is appropriate for a variable that varies with time. Population (in millions) (Sub)continent 1950 1955 1960 1965 1970 1975 1980 Africa 228 254 285 322 366 417 479 The Americas 331 370 416 464 511 561 613 Europe 543 574 605 634 657 677 694
  • 14.
     Line Graph Nameof Newspaper Friday Saturday Sunday Los Angeles Times 55 58 60 NewYork Times 62 63 67 Chicago Sun 47 49 49 Orange County Register 39 41 42 San Francisco Chronicle 51 53 55
  • 15.
     Bar graph Thebar graph consists of vertical or horizontal bars of equal widths. The length of the bars represent the magnitudes of the quantities being compared. This type of graph is most appropriate for comparing data at a particular time.
  • 16.
    Example  Imagine youjust did a survey of your friends to find which kind of movie they liked best: Table: Favorite Type of Movie Comedy Action Romance Drama SciFi 4 5 6 1 4
  • 18.
    Pie chart orpie graph  The pie chart or pie graph is appropriate in comparing the parts with the whole
  • 19.
    Pictograph  Another wayof representing numerical values is though the use of pictographs or picture graphs. In this type of chart, actual pictures of facsimiles of the objects under study are used the represent values. Each figure is considered a unit representing a definite number.
  • 20.
     Information about300 children of a school who come to school by different modes of transportation. 10 per children
  • 21.
    Graphical Representation ofa Frequency  There are two graphical methods in the presentation of frequency distribution  Histogram Versus Frequency Polygon  Both provide a quick picture of the main characteristics of the data (highs, lows, points of concentration, etc.)  The histogram has the advantage of depicting each class as a rectangle, with the height of the rectangular bar representing the number in each class.  The frequency polygon has an advantage over the histogram. It allows us to compare directly two or more frequency distributions.
  • 27.
    Class Interval F Class Boundaries Class Mark rf% <CF>CF 27 - 38 1 26.5 – 38.5 32.5 2.27% 1 44 39 - 50 6 38.5 – 50.5 44.5 13.64% 7 43 51 - 62 11 50.5 – 62.5 56.5 25% 18 37 63 - 74 17 62.5 – 74.5 68.5 38.64% 35 26 75 - 86 7 74.5 – 86.5 80.5 15.91% 42 9 87 - 98 2 86.5 – 98.5 92.5 4.54% 44 2 Total…. 44 100%
  • 28.
    49 38 1137 50 38 27 31 26 40 26 37 21 36 30 36 17 40 25 20 45 46 50 14 19 24 35 30 24 18 13 35 49 23 17 23 44 29 33 26 31 33 38 22 35 41 23 27 11 45 29 32 17 21 14 39 31 37 20 21