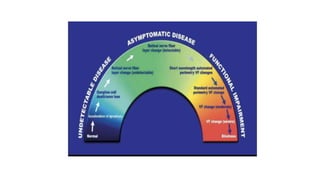
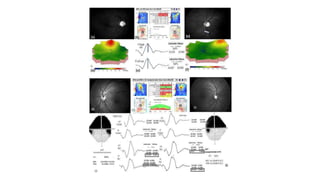
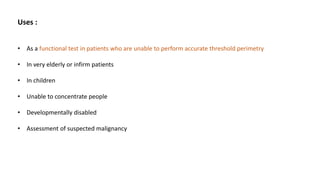
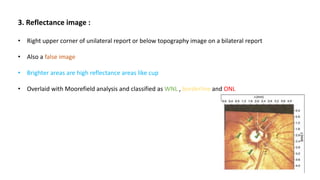
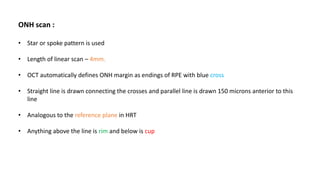
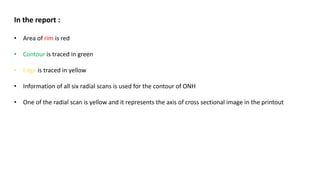
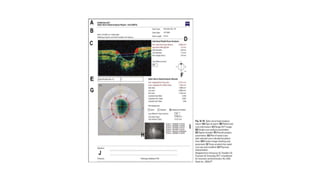
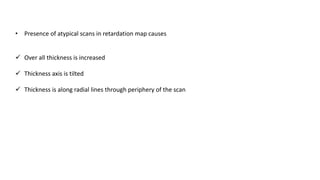
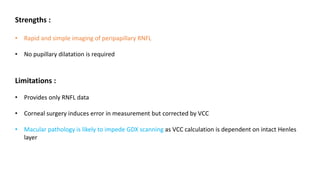
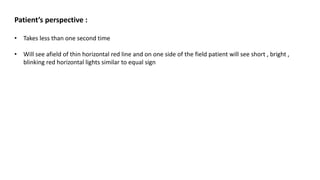
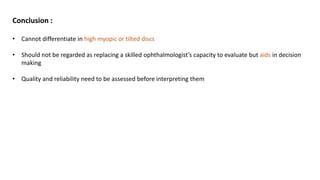
1. Preperimetric glaucoma is characterized by optic nerve abnormalities detected through imaging and testing, even though standard visual field tests are still normal.
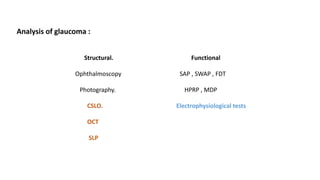
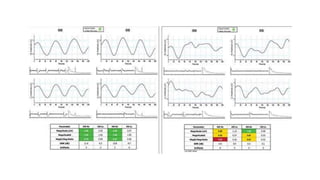
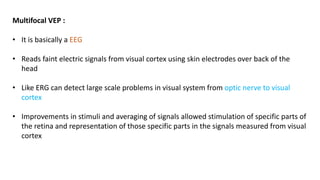
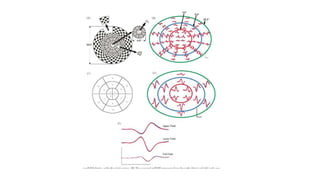
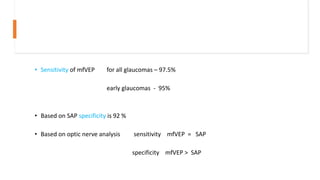
2. Electrophysiological tests like pattern electroretinography (PERG) and multifocal visual-evoked potentials (mfVEP) can detect early ganglion cell damage before visual field loss occurs.
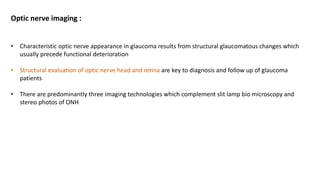
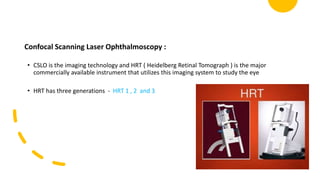
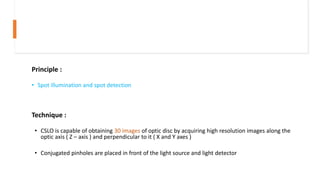
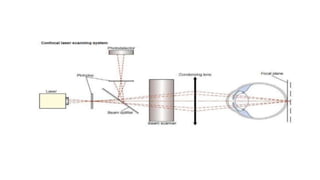
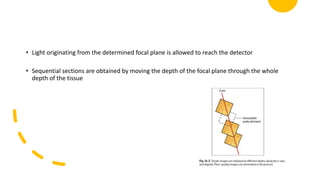
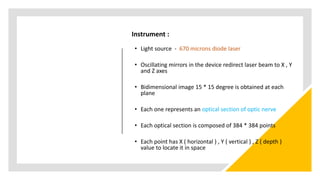
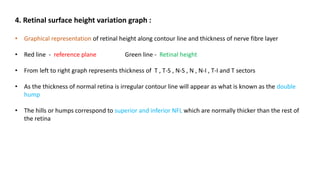
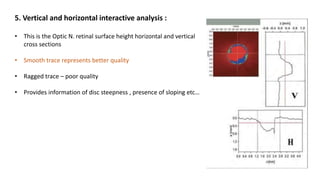
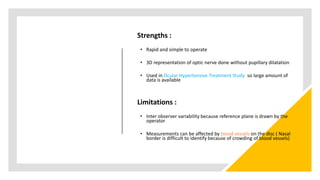
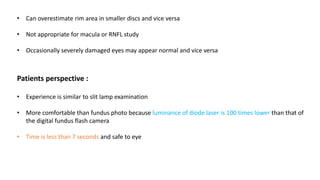
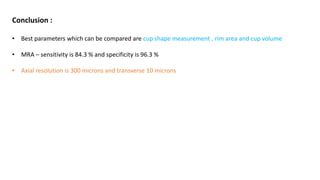
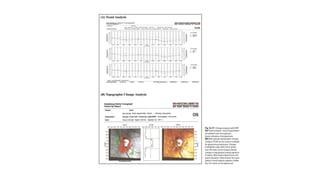
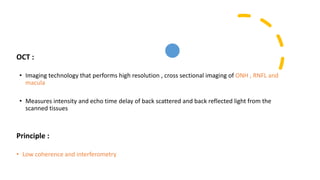
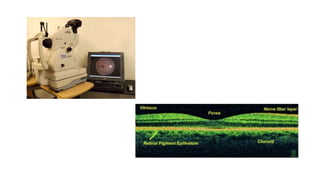
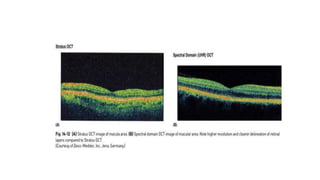
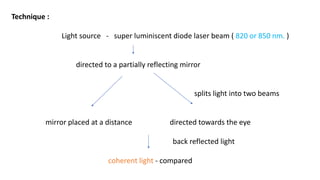
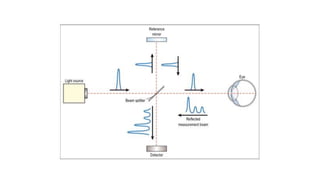
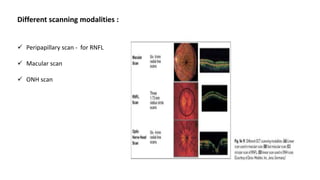
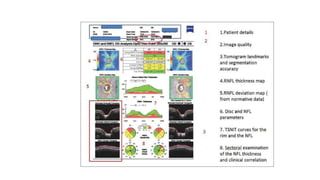
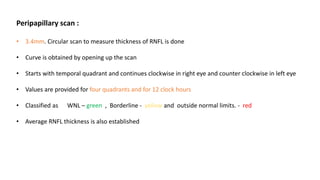
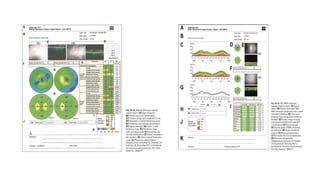
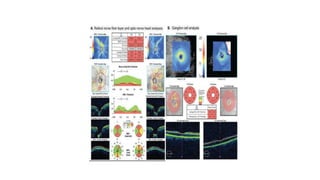
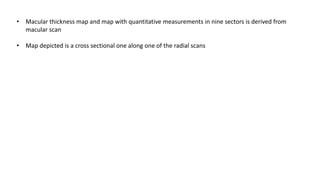
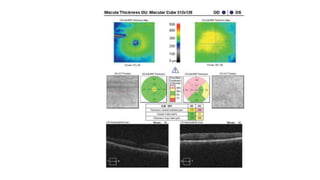
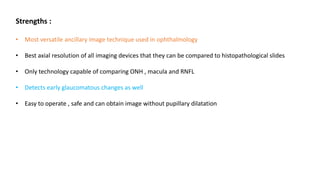
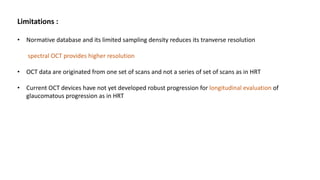
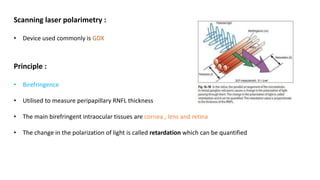
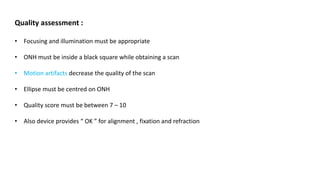
3. Imaging technologies like confocal scanning laser ophthalmoscopy (CSLO), optical coherence tomography (OCT), and scanning laser polarimetry provide structural evaluation of the optic nerve head and retina to diagnose and monitor glaucoma progression.