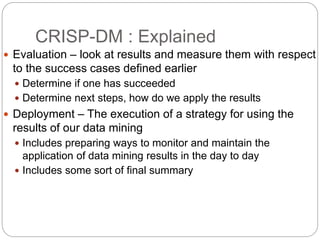
The document provides an overview of business analytics (BA) including its history, types, examples, challenges, and relationship to data mining. BA involves exploring past business performance data to gain insights and guide planning. It can focus on specific business segments. Types of BA include reporting, affinity grouping, clustering, and predictive analytics. Challenges to BA include acquiring high quality data and rapidly processing large volumes of data. Data mining is an important part of BA, helping to sort and analyze large datasets.
Basic Concepts of Business Data Analytics, Evolution of Business Analytics, Data Analytics, Business Data Analytics Applications, Scope of Business Analytics.
This project is about "Big Data Analytics," and it provides a comprehensive overview of topics related to Data and Analytics and a short note on Cognitive Analytics, Sentiment Analytics, Data Visualization, Artificial intelligence & Data-Driven Decision Making along with examples and diagrams.
This presentation briefly discusses the following topics:
Classification of Data
What is Structured Data?
What is Unstructured Data?
What is Semistructured Data?
Structured vs Unstructured Data: 5 Key Differences
This brief work is aimed in the direction of basics of data sciences and model building with focus on implementation on fairly sizable dataset. It focuses on cleaning the data, visualization, EDA, feature scaling, feature normalization, k-nearest neighbor, logistic regression, random forests, cross validation without delving too deep into any of them but giving a start to a new learner.
It is an introduction to Data Analytics, its applications in different domains, the stages of Analytics project and the different phases of Data Analytics life cycle.
I deeply acknowledge the sources from which I could consolidate the material.
Green Printing at UK Government Department [Infographic]Chief Optimist
A UK central government department needed to cut costs and waste. Xerox and its Managed Print Services solution delivered to the tune of 30 percent print savings and 12 percent less CO2 emissions.
what is ..how to process types and methods involved in data analysisData analysis ireland
Data analysis is the process of cleaning, transforming, and processing raw data in order to extract useful and actionable information that can assist businesses in making better decisions.
leewayhertz.com-Data analysis workflow using Scikit-learn.pdfKristiLBurns
Data analysis is the process of analyzing, cleaning, transforming, and modeling data to uncover useful information and draw conclusions from it to support decision-making. It involves applying various statistical and analytical techniques to uncover patterns, relationships, and insights from raw data.
Data Mining – Definition, Challenges, tasks, Data pre-processing, Data Cleaning, missing data, dimensionality reduction, data transformation, measures of similarity and dissimilarity, Introduction to Association rules, APRIORI algorithm, partition algorithm, FP growth algorithm, Introduction to Classification techniques, Decision tree, Naïve-Bayes classifier, k-nearest neighbour, classification algorithm.
In our increasingly Data-driven world, it's more important than ever to have accessible ways to view and understand data.
After all, employees' demand for data skills steadily increases each year.
Employees and Business owners at every level need to understand data and its impact.
That's where Data Visualization comes in handy.
To make Data more accessible and understandable, Data Visualization in Dashboards is the go-to tool for many businesses to Analyze and share Information.
Top 30 Data Analyst Interview Questions.pdfShaikSikindar1
Data Analytics has emerged has one of the central aspects of business operations. Consequently, the quest to grab professional positions within the Data Analytics domain has assumed unimaginable proportions. So if you too happen to be someone who is desirous of making through a Data Analyst .
Similar to Business analytics and data mining (20)
DevOps and Testing slides at DASA ConnectKari Kakkonen
My and Rik Marselis slides at 30.5.2024 DASA Connect conference. We discuss about what is testing, then what is agile testing and finally what is Testing in DevOps. Finally we had lovely workshop with the participants trying to find out different ways to think about quality and testing in different parts of the DevOps infinity loop.
Epistemic Interaction - tuning interfaces to provide information for AI supportAlan Dix
Paper presented at SYNERGY workshop at AVI 2024, Genoa, Italy. 3rd June 2024
https://alandix.com/academic/papers/synergy2024-epistemic/
As machine learning integrates deeper into human-computer interactions, the concept of epistemic interaction emerges, aiming to refine these interactions to enhance system adaptability. This approach encourages minor, intentional adjustments in user behaviour to enrich the data available for system learning. This paper introduces epistemic interaction within the context of human-system communication, illustrating how deliberate interaction design can improve system understanding and adaptation. Through concrete examples, we demonstrate the potential of epistemic interaction to significantly advance human-computer interaction by leveraging intuitive human communication strategies to inform system design and functionality, offering a novel pathway for enriching user-system engagements.
Generating a custom Ruby SDK for your web service or Rails API using Smithyg2nightmarescribd
Have you ever wanted a Ruby client API to communicate with your web service? Smithy is a protocol-agnostic language for defining services and SDKs. Smithy Ruby is an implementation of Smithy that generates a Ruby SDK using a Smithy model. In this talk, we will explore Smithy and Smithy Ruby to learn how to generate custom feature-rich SDKs that can communicate with any web service, such as a Rails JSON API.
UiPath Test Automation using UiPath Test Suite series, part 3DianaGray10
Welcome to UiPath Test Automation using UiPath Test Suite series part 3. In this session, we will cover desktop automation along with UI automation.
Topics covered:
UI automation Introduction,
UI automation Sample
Desktop automation flow
Pradeep Chinnala, Senior Consultant Automation Developer @WonderBotz and UiPath MVP
Deepak Rai, Automation Practice Lead, Boundaryless Group and UiPath MVP
GDG Cloud Southlake #33: Boule & Rebala: Effective AppSec in SDLC using Deplo...James Anderson
Effective Application Security in Software Delivery lifecycle using Deployment Firewall and DBOM
The modern software delivery process (or the CI/CD process) includes many tools, distributed teams, open-source code, and cloud platforms. Constant focus on speed to release software to market, along with the traditional slow and manual security checks has caused gaps in continuous security as an important piece in the software supply chain. Today organizations feel more susceptible to external and internal cyber threats due to the vast attack surface in their applications supply chain and the lack of end-to-end governance and risk management.
The software team must secure its software delivery process to avoid vulnerability and security breaches. This needs to be achieved with existing tool chains and without extensive rework of the delivery processes. This talk will present strategies and techniques for providing visibility into the true risk of the existing vulnerabilities, preventing the introduction of security issues in the software, resolving vulnerabilities in production environments quickly, and capturing the deployment bill of materials (DBOM).
Speakers:
Bob Boule
Robert Boule is a technology enthusiast with PASSION for technology and making things work along with a knack for helping others understand how things work. He comes with around 20 years of solution engineering experience in application security, software continuous delivery, and SaaS platforms. He is known for his dynamic presentations in CI/CD and application security integrated in software delivery lifecycle.
Gopinath Rebala
Gopinath Rebala is the CTO of OpsMx, where he has overall responsibility for the machine learning and data processing architectures for Secure Software Delivery. Gopi also has a strong connection with our customers, leading design and architecture for strategic implementations. Gopi is a frequent speaker and well-known leader in continuous delivery and integrating security into software delivery.
Transcript: Selling digital books in 2024: Insights from industry leaders - T...BookNet Canada
The publishing industry has been selling digital audiobooks and ebooks for over a decade and has found its groove. What’s changed? What has stayed the same? Where do we go from here? Join a group of leading sales peers from across the industry for a conversation about the lessons learned since the popularization of digital books, best practices, digital book supply chain management, and more.
Link to video recording: https://bnctechforum.ca/sessions/selling-digital-books-in-2024-insights-from-industry-leaders/
Presented by BookNet Canada on May 28, 2024, with support from the Department of Canadian Heritage.
LF Energy Webinar: Electrical Grid Modelling and Simulation Through PowSyBl -...DanBrown980551
Do you want to learn how to model and simulate an electrical network from scratch in under an hour?
Then welcome to this PowSyBl workshop, hosted by Rte, the French Transmission System Operator (TSO)!
During the webinar, you will discover the PowSyBl ecosystem as well as handle and study an electrical network through an interactive Python notebook.
PowSyBl is an open source project hosted by LF Energy, which offers a comprehensive set of features for electrical grid modelling and simulation. Among other advanced features, PowSyBl provides:
- A fully editable and extendable library for grid component modelling;
- Visualization tools to display your network;
- Grid simulation tools, such as power flows, security analyses (with or without remedial actions) and sensitivity analyses;
The framework is mostly written in Java, with a Python binding so that Python developers can access PowSyBl functionalities as well.
What you will learn during the webinar:
- For beginners: discover PowSyBl's functionalities through a quick general presentation and the notebook, without needing any expert coding skills;
- For advanced developers: master the skills to efficiently apply PowSyBl functionalities to your real-world scenarios.
Slack (or Teams) Automation for Bonterra Impact Management (fka Social Soluti...Jeffrey Haguewood
Sidekick Solutions uses Bonterra Impact Management (fka Social Solutions Apricot) and automation solutions to integrate data for business workflows.
We believe integration and automation are essential to user experience and the promise of efficient work through technology. Automation is the critical ingredient to realizing that full vision. We develop integration products and services for Bonterra Case Management software to support the deployment of automations for a variety of use cases.
This video focuses on the notifications, alerts, and approval requests using Slack for Bonterra Impact Management. The solutions covered in this webinar can also be deployed for Microsoft Teams.
Interested in deploying notification automations for Bonterra Impact Management? Contact us at sales@sidekicksolutionsllc.com to discuss next steps.
GraphRAG is All You need? LLM & Knowledge GraphGuy Korland
Guy Korland, CEO and Co-founder of FalkorDB, will review two articles on the integration of language models with knowledge graphs.
1. Unifying Large Language Models and Knowledge Graphs: A Roadmap.
https://arxiv.org/abs/2306.08302
2. Microsoft Research's GraphRAG paper and a review paper on various uses of knowledge graphs:
https://www.microsoft.com/en-us/research/blog/graphrag-unlocking-llm-discovery-on-narrative-private-data/
Kubernetes & AI - Beauty and the Beast !?! @KCD Istanbul 2024Tobias Schneck
As AI technology is pushing into IT I was wondering myself, as an “infrastructure container kubernetes guy”, how get this fancy AI technology get managed from an infrastructure operational view? Is it possible to apply our lovely cloud native principals as well? What benefit’s both technologies could bring to each other?
Let me take this questions and provide you a short journey through existing deployment models and use cases for AI software. On practical examples, we discuss what cloud/on-premise strategy we may need for applying it to our own infrastructure to get it to work from an enterprise perspective. I want to give an overview about infrastructure requirements and technologies, what could be beneficial or limiting your AI use cases in an enterprise environment. An interactive Demo will give you some insides, what approaches I got already working for real.
Encryption in Microsoft 365 - ExpertsLive Netherlands 2024Albert Hoitingh
In this session I delve into the encryption technology used in Microsoft 365 and Microsoft Purview. Including the concepts of Customer Key and Double Key Encryption.
Encryption in Microsoft 365 - ExpertsLive Netherlands 2024
Business analytics and data mining
1. Overview of BA Discussion
Business Analytics (BA)
Overview
History
Types of Business Analytics
Real world examples
Challenges
Relations to Data Mining
2. Business Analytics (BA) : an
overview
BA can be considered a subset of Business intelligence
A set of skills, technologies, applications and practices
exploration and investigation of past business performance
to gain insight and drive business planning.
Like Business Intelligence, BA can focus either on the
business as a whole or only on segments of it
Focuses on developing new insights and understanding
of performance based on data and statistical methods
3. BA : Short History
Analytics in business dates far before computing
Frederick Taylor, father of scientific management, 19th
century
time management exercises used in industrial settings
Henry Ford : assembly line pacing used to improve output
and business profitability
BA becomes widespread when computers were used in
DSS systems in the 60’s
Evolved into ERP, data warehouses, etc.
4. Types of Business Analytics
Reporting or Descriptive Analytics
Affinity grouping
Clustering
Modeling or Predictive analytics
5. BA: Reporting
Based on the need to locate and distribute business
insights and experiences
Often involves ETL procedures used alongside a data
warehousing scheme
The data is then collected, quantified, and organized
using reporting tools
Reporting, allows for information describing different
views of an enterprise to come together one place
A user could query a production and marketing database to
determine if production of a product could be moved closer
to where a product is sold
6. BA: Affinity grouping
A tool used by businesses and
organizations to take ideas
and data and organize them.
Often takes the form of an affinity diagram
Enables data and ideas stemming from
brainstorming to be sorted into groups
Sorting is based on their natural relationships
7. BA: Clustering
Placing a set of objects into groups (called clusters) so
that the objects in the same cluster are more similar (in
some sense or another) to each other than to those in
other clusters – wikipedia
Is a main task of explorative data mining and statistical
data analysis
Clustering is a general task that does not have one set
solution
Clustering can be hard or fuzzy
Can be done by people or machines
The latter is preferred
8. BA: how do we model clusters?
Connectivity models – how data can be connected to
other points
Density models – defining a cluster by determining where
sets of data points are densest
Distribution model – clusters are modeled using statistical
distributions
Expectation maximization
9. BA: Predictive Analysis
Stems from the desire to predict future events through
analyzing data an enterprise has collected
Pattern exploitation results in the identification of
opportunities and also risks
Allow relationships in disparate data to be identified
Helps guide in decision making in a business
Is often implemented in the form of data mining
10. BA : Examples
Credit company– uses business analytics to track credit risk of
customers as well as matching customers to offerings
Sales and offers – companies can track customer interaction,
and use that information to determine appropriate product
offerings.
Sales groups can use BA to optimize inventory and analyze
past sales
Could measure peak purchasing times for products
Could decide whether or not to stock poorly selling items
Give examples of business cases where data mining might be
useful, and describe how data mining would be used
Preventing credit card fraud through detecting spending patterns
Inventory management by tracking sales
11. BA : Challenges
Acquiring sufficient volumes of high quality data
Most data acquired in the field is unsorted and appears in
many different formats
When dealing with high volume data, deciding what is
important and what is noise
Rapidly reacting storage structures
BA can influence customer interactions, and as such that
information must be available fast
Ex: a customized sales pitch
12. Business Analytics & Data Mining
Data Mining is an important sub task of Business
Analytics
Both Predictive analysis and clustering tasks
utilize information retrieved from data mining
Data mining helps handle some of the specific
problems faced when conducting Business
Analytics
Dealing with and sorting through large data sets
13. Data Mining : An Overview
What is Data Mining ?
History
Applications of Data Mining
Detecting data discrepancies or outliers
Relationship identification
Data-Function mapping for modeling/prediction
Categorizing and Summarizing Data
Standards
Challenges
14. Data Mining : What is it?
Applying statistical analysis techniques to data
the goal often being to determine unnoticed patterns or to
collect categorized information
turns collected data into understandable structures
Data Mining is often used as a buzz word to describe
processing large amounts of data
In essence, its correct use relates to discovery of new
things through observation
Synonymous with knowledge discovery
15. Data Mining : History
Though HNC trademarked the term in 1990, hands on
pattern extraction is centuries old
As long as statistic analysis has existed
Discoveries in computer science have increasingly
shifted the field from hands on to machine dependent,
this allows for :
The use of data indexing and DB systems to handle data
efficiently
The application of statistical algorithms on a large scale,
possibly in a distributed manner, with less error
16. Data Mining : Use : Application
Data Mining is often broken into several different
categories of tasks
Detecting data discrepancies or outliers
Relationship identification
Data-Function mapping for modeling/prediction
Categorizing and Summarizing Data
17. Data Mining : Finding outliers
The process of analyzing large, mostly
homogeneous, sets of data and determining
which sets or points
“go with the flow” and conform with patterns the rest
of the data seem to follow
do not follow expected results when viewed against
the entire set of data
An outlier can be a point or set of points, but can
also be defined through other means
A period of time could yield unexpected results
Ex. Network Intrusion
18. Data Mining : Techniques in finding outliers
Rule Based – deciding a set of rules that
determine an outlier (or what isn’t one)
Can be fuzzy or hard rules
Cluster Analysis – As mentioned earlier
Distance or Standard Deviation – Determining an
average over a data set and marking points that
aren’t within a Deviation or Distance
19. Applications of Outlier Detection
Network Intrusion Detection
Unusual bursts of network activity
Identity Theft Detection
Unusual spending or customer activity
Detecting Software bugs
Software does not deliver expected outputs
Sensor event detection
Monitoring patient health fluctuations in a medical setting
Preprocessing
Removing data skews based on extenuating
circumstances
20. Relationship Discovery: Basics
Understanding how data is related is a key factor
in trend and knowledge discovery
This is the definition of data mining
Ex: Which products are often bought before a major
forecasted storm
{hamburger buns} => {???}
With small sets of data, or with correlations that
aren’t subtle (as the one above), identifying
relationships is not as difficult
With large data sets or subtle relations a
combination of rule generation and data analysis
can be used to expedite the process
21. Relationship Discovery: How its done
Since the number of relationships between points
of data could be boundless, two important
concepts are often introduced in relationship
discovery:
The amount of data within which a relationship
might exist, called the support of a rule.
The probability that data in the support will verify a
selected rule, called the confidence of a rule.
22. Relationship Discovery: How its done
Generally we apply minimum bounds to both the support of
a rule and its confidence to determine relationships
First : determine possible relationships
Set a minimum support
Orders with hamburgers, Orders with hamburger buns
Other, user specific rules can be used here
Second : take the remaining sets, look for patterns in the
items sets such that occurrence rate is above the minimum
confidence
How many people bought hamburgers and buns together
Ex: we find that if the customer is a male, and they buy
diapers, they will also buy beer
{male, diapers} => {beer}
23. Matching data to functions
Often, it is desirable to match data sets and the
factors that determine them to functions
Allows for the possibility of predicting future results
Involves learning how dependent and
independent variables in our data interact
Dependent : the result, or where a point exists
Independent : an cause or circumstance that
determines the dependent variable
If we know how dependent and independent
variables interact, we can create a function and
run simulations to see results
24. Uses of Function-Data Mapping
Weather Forecasting
Determining what conditions lead to what kinds of
weather
Stock market analysis
When to buy and when to sell
Crime Prevention
What conditions cause or prevent crime
25. Categorizing
Categorizing – Often we want to separate data
based off of a set of predefined attributes
Very helpful in pattern recognition
Ex: a persons political preference
The process :
we synthetically generate or measure a set of
observations (data points) with known categories
we extract properties from said observations which
we believe contribute to the category
These are called explanatory variables
Finally we examine new data for these properties
26. Summarizing
Summarizing – we almost never want to look at all of
the data individually
Having too much data can actually hider the decision
making process
Known as information overload
Summarizing takes the results from data mining and
transforms it into formats that can be easily read
without omitting important information
Summarizing might :
Extract and display only important data
correlate and abstract data to display trends
Formats Include : Reports, Graphs, Dashboards, etc.
27. Standards : CRISP-DM
Cross Industry Standard Process for Data Mining
describes common practice for conducting data mining in an
enterprise setting
KD nuggets – a community resource in DM and analytics
took polls and found CRISP-DM was the top methodology
in 02’, 04’, & 07’
Six step methodology
Business Understanding
Data Understanding
Data Preparation
Modeling
Evaluation
Deployment
28. CRISP-DM : Explained
Business Understanding
Determining the business purpose
Define success conditions – how do we know we succeeded
Ex : improved prediction accuracy
Map purpose/success conditions to data mining results
Ex: fraud prevention => detect deviations
Data Understanding
Collecting and exploring data – defining its attributes
Data quality verification
29. CRISP-DM : Explained
Data Preparation
Data Cleaning
Normalization – fitting data within ranges
Outlier removal – removing cases that could skew the model
Handle missing attributes – the data was not obtained
Formatting – changing data so that it fits with our tools
Modeling – fitting the data to a model following the
methods previously described and then interpreting that
model
Assess the accuracy of the collected data
General purpose divided into prediction or description
30. CRISP-DM : Explained
Evaluation – look at results and measure them with respect
to the success cases defined earlier
Determine if one has succeeded
Determine next steps, how do we apply the results
Deployment – The execution of a strategy for using the
results of our data mining
Includes preparing ways to monitor and maintain the
application of data mining results in the day to day
Includes some sort of final summary
31. SEMMA
Sample, Explore, Modify, Model and Assess
Proposed by SAS Institute : A producer of BI and BA
software suites.
Though this model is often considered general SAS
prefers to apply it directly to their products
Focuses mainly on data mining and not on applying results
to business (unlike CRISP-DM)
Sampl
e
selecting the data set
Explor
e
Understand data through discovering relationships, both expected and
otherwise
Modify Transform and clean the data in order to prepare it for the modeling
process
Model Apply models to the data in order to discover trends and make predictions
Assess Evaluate the results of the modeling process to determine the reliability of
the mined data
32. Challenges in data mining
Not enough or too much data
Oftentimes it is difficult to access sufficient quantities of data
for small enterprises
If the enterprise is large however, sometimes there is too
much and deciding what to keep is difficult
Acquiring clean data
Multiple formats or no format at all
Privacy and ethical concerns
Data aggregation : data compiled from multiple sources can
lead to revelations that violate privacy concerns
Ex: anonymous data is collected and aggregated, leading to
identification
Editor's Notes
Taylor : mechanical engineer who focused on improving industrial efficiency
DSS – Decision Support Systems, ERP – Enterprise Resource Planning
4:40
Fuzzy clustering – each object has a likeliness of belonging to a cluster
Expected max - multivariate normal distributions - One can simply pick arbitrary values for one of the two sets of unknowns, use them to estimate the second set, then use these new values to find a better estimate of the first set, and then keep alternating between the two until the resulting values both converge to fixed points
17:20
Agrawal, R.; Imieliński, T.; Swami, A. (1993). "Mining association rules between sets of items in large databases". Proceedings of the 1993 ACM SIGMOD international conference on Management of data - SIGMOD '93. pp. 207. doi:10.1145/170035.170072.ISBN 0897915925.
http://en.wikipedia.org/wiki/Association_rule_learning#Useful_Concepts
Agrawal - Agrawal, R.; Imieliński, T.; Swami, A. (1993). "Mining association rules between sets of items in large databases". Proceedings of the 1993 ACM SIGMOD international conference on Management of data - SIGMOD '93. pp. 207
30 min