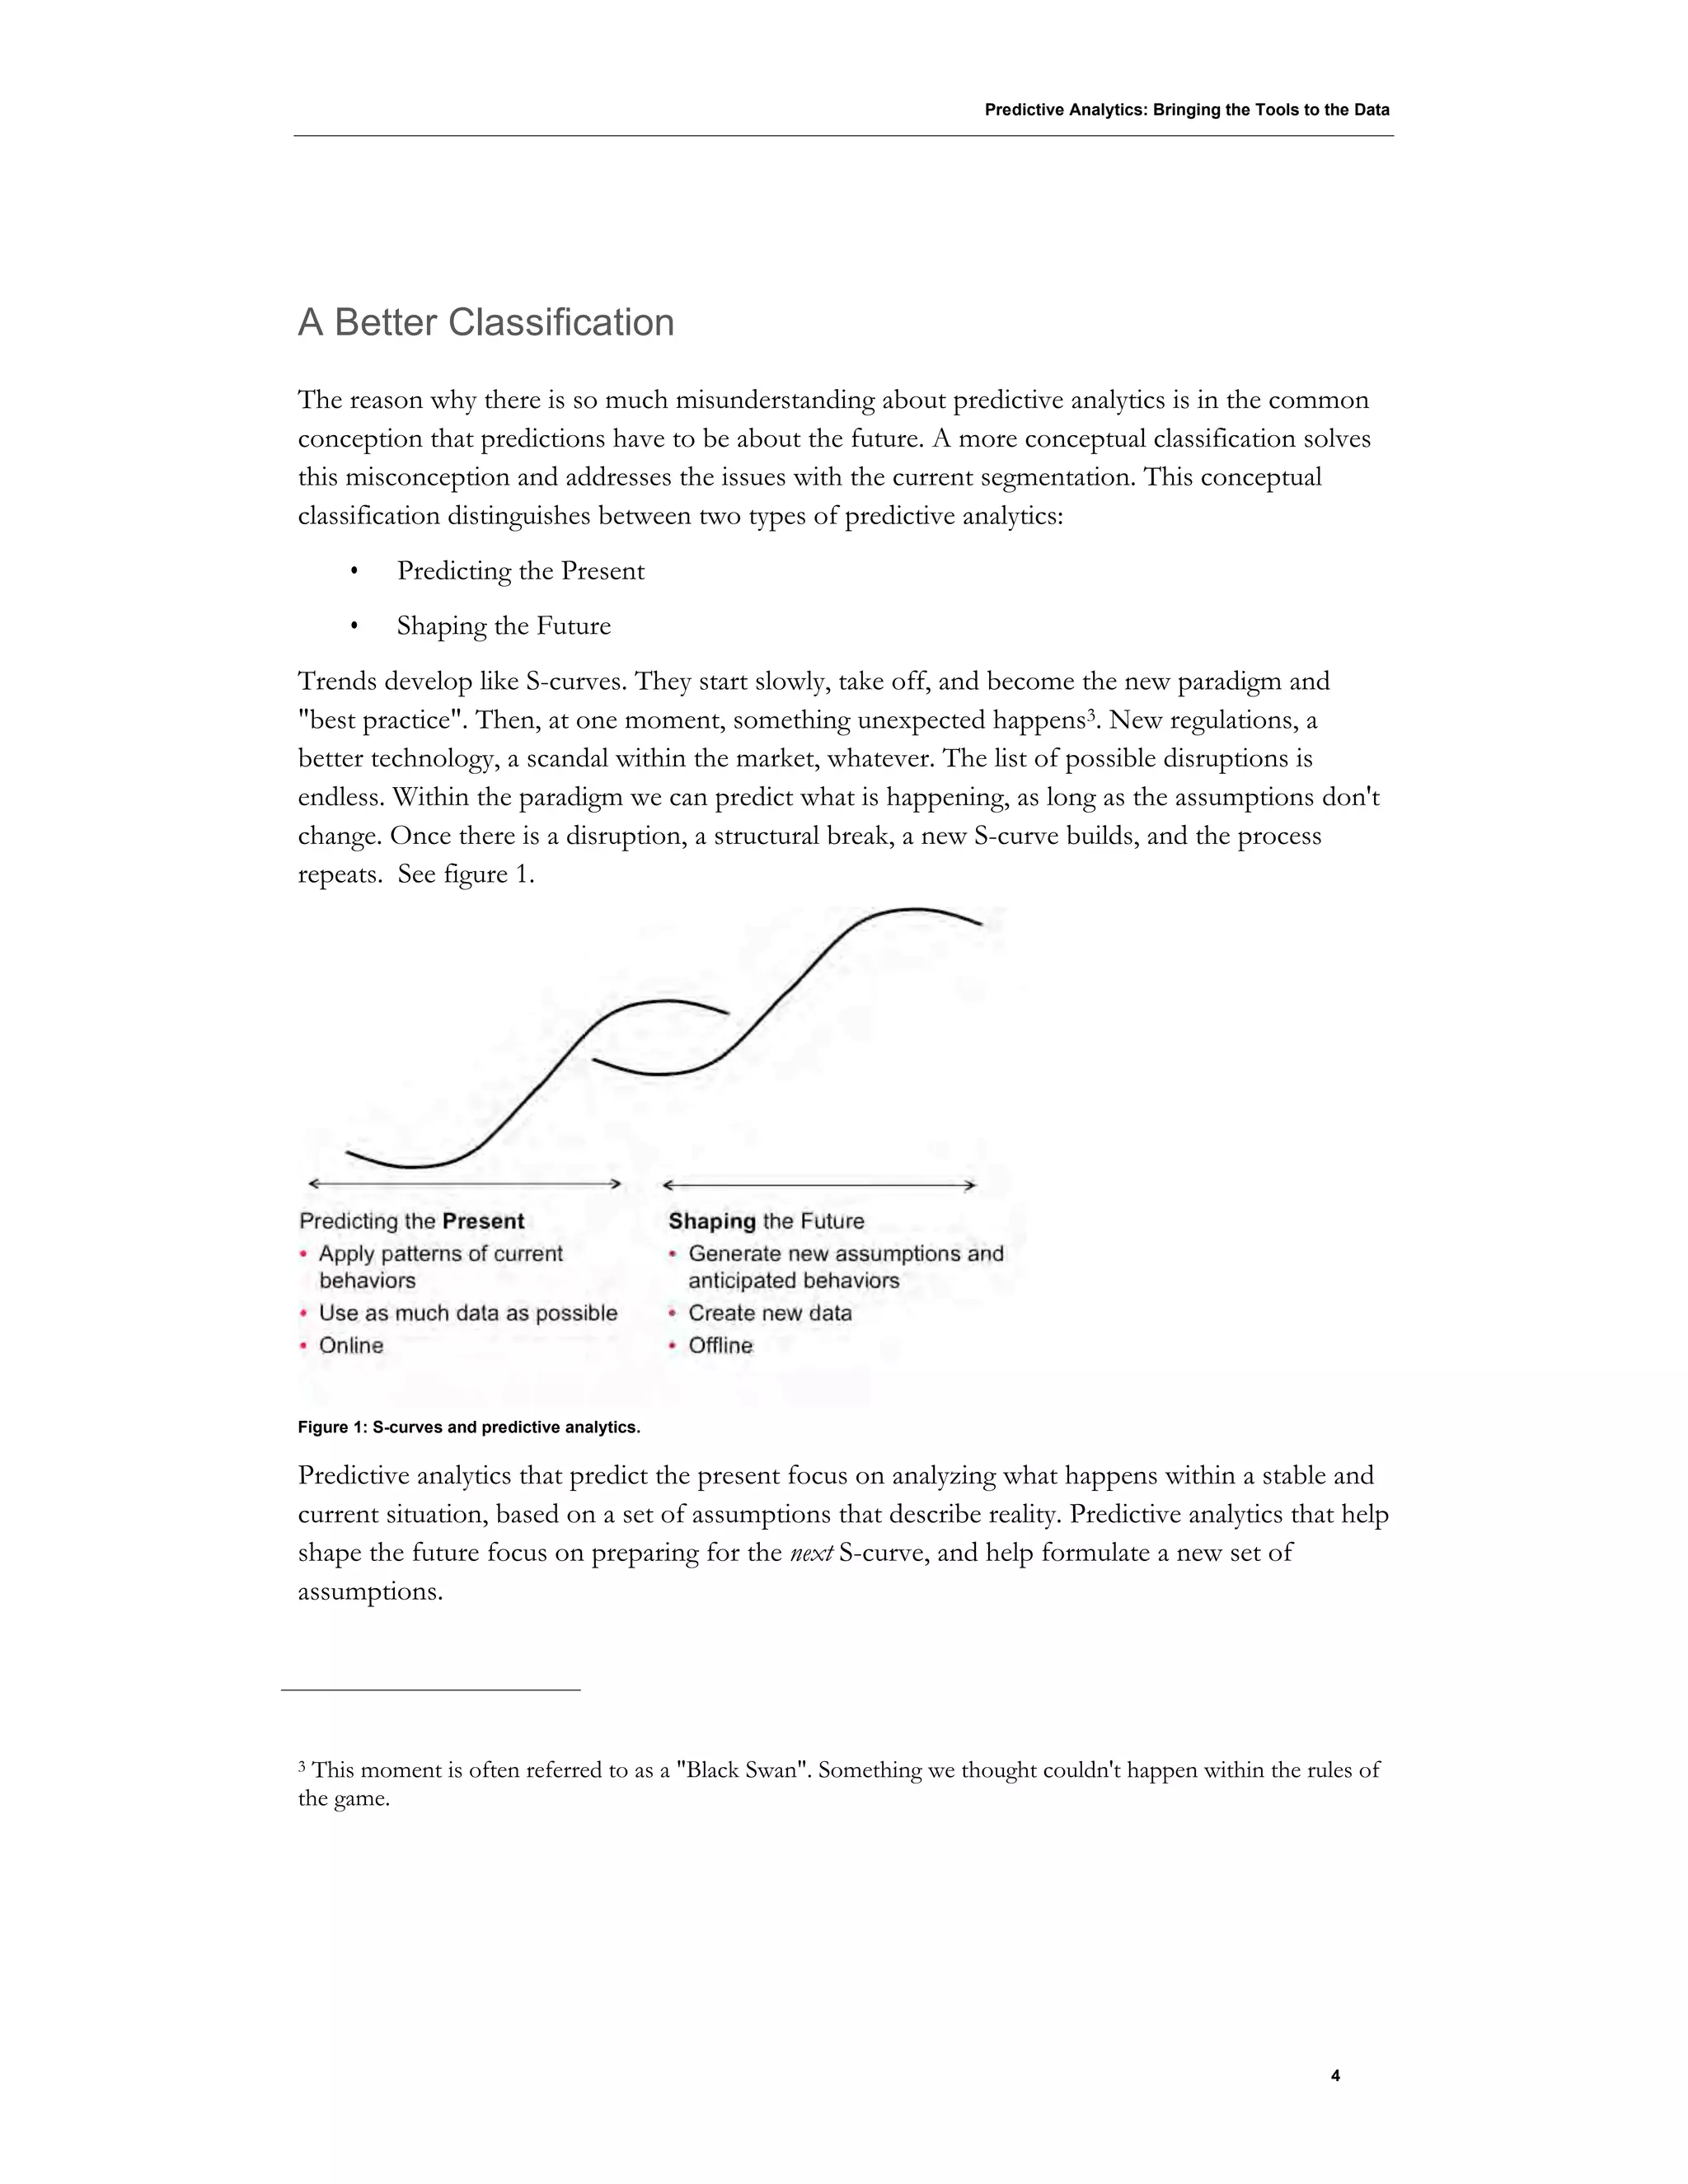
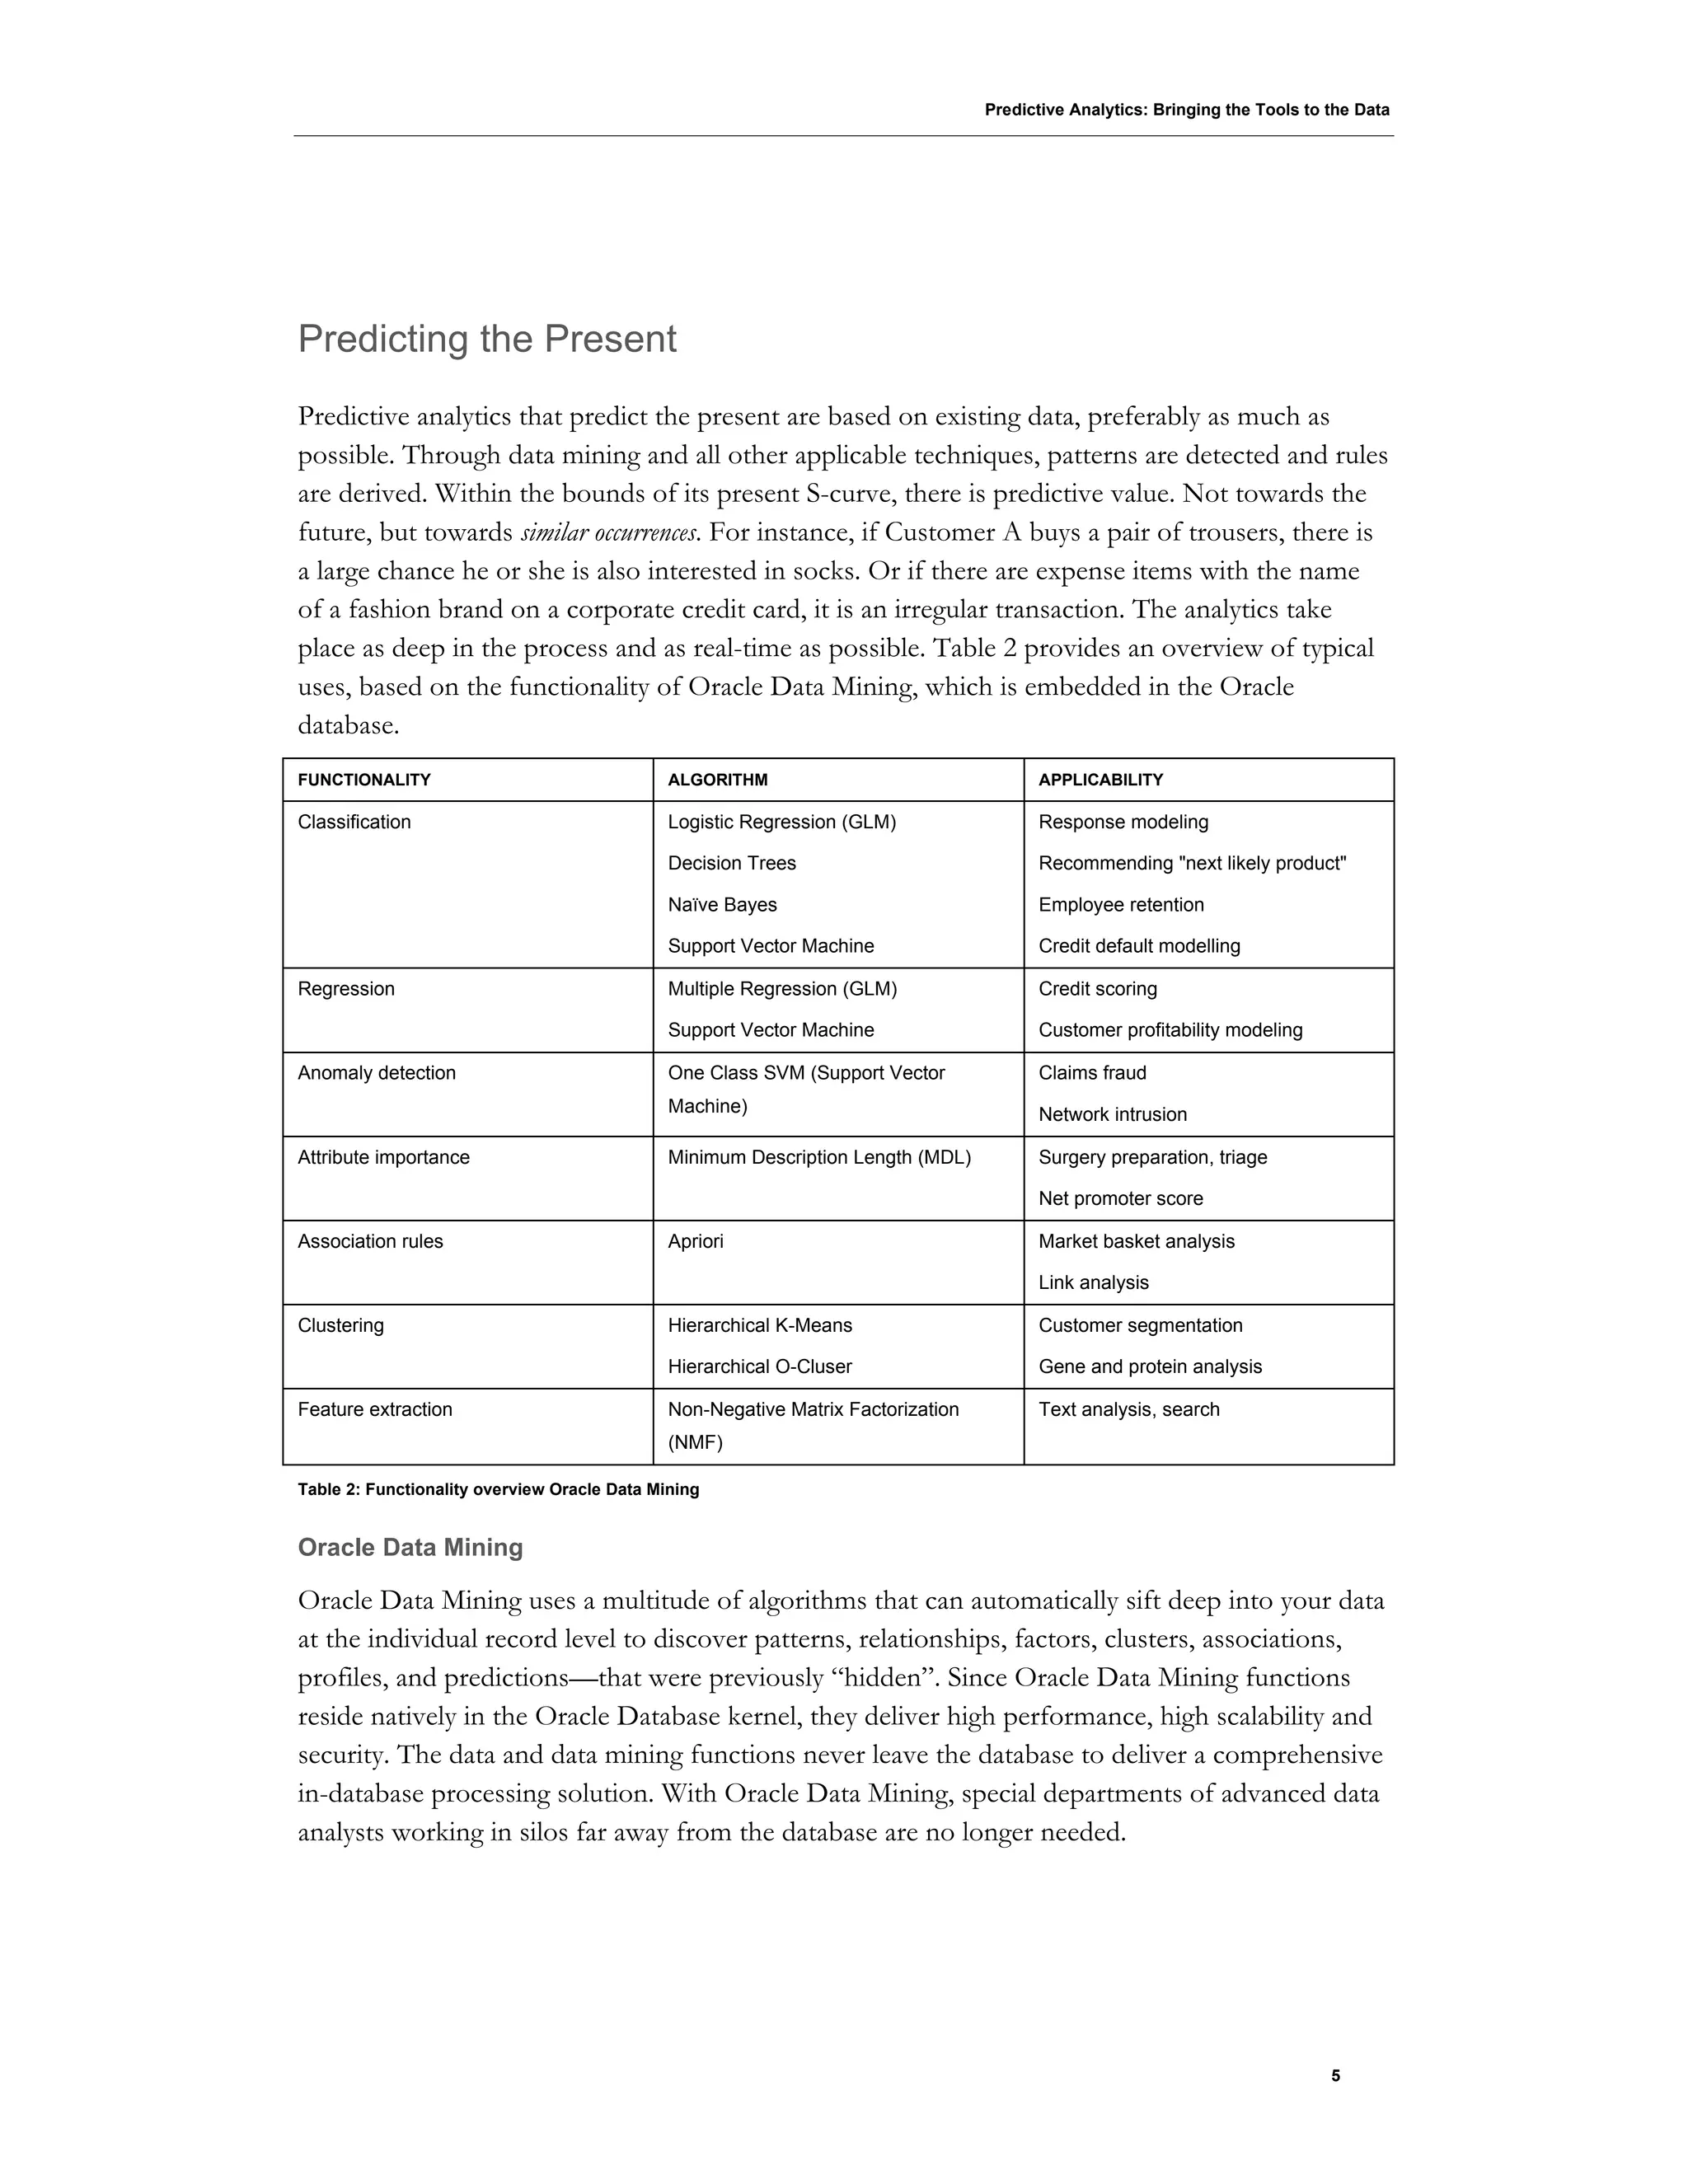
This document discusses predictive analytics and provides an overview of Oracle's predictive analytics tools.
It argues that predictive analytics is commonly misunderstood as only predicting the future, but can also be used to predict the present based on existing data patterns. It proposes a new conceptual classification of predictive analytics into "predicting the present" and "shaping the future". The document then provides examples of how Oracle Data Mining can be used to predict things in the present like customer preferences, fraud detection, and credit scoring. It also discusses how Oracle Real-Time Decisions integrates predictive analytics into real-time processes.
Serene Zawaydeh - Big Data -Investment -WaveletsSerene Zawaydeh
Big data solutions are being implemented in the investment industry among other industries, allowing processing of a large volume of variables including real time changes.
In addition to highlighting current applications of big data in the investment industry, this paper identifies applications of Wavelets in finance and Big Data. Wavelets are used for the analysis of non stationary signals. Academic studies proved the benefits of using Wavelets for forecasting financial time series, data mining among other applications.
Machine Learning for Business - Eight Best Practices for Getting StartedBhupesh Chaurasia
Though the term machine learning has become very visible in
the popular press over the past few years—making it appear to be the newest shiny object—the technology has actually been
in use for decades. In fact, machine learning algorithms such as decision trees are already in use by many organizations for predictive analytics.
Banks Betting on Big Data Analytics and Real-Time Execution to Better Engage ...SAP Analytics
Winning new business and satisfying customers are top agenda items in bank boardrooms worldwide. Executives are bullish on new technologies to meet these objectives.
Report from the National Consumer Law Center which concluded that, when it comes to scoring consumer credit risk, “big data does not live up to its big promises”.
AI powered Decision Making in Banks - How Banks today are using Advanced analytics in credit Decisioning, enhancing customer life time value, lower operating costs and stronger customer acquisition
Fraud detection is a popular application of Machine Learning. But is not that obvious and not that common as it seems. I'll tell how QuantUp implemented it for WARTA insurance company (a subsidiary of Talanx International AG).
The models developed gave between 10% and 30% of reduction of losses. The project was not a simple one because of the complex process of handling claims and using really rich dataset. The tools applied were R (modeling) and DataWalk (data peparation). You will learn what is important in development of such solutions in general, what was difficult in this particular project, and how to overcome possible difficulties in similar projects.
Keys to extract value from the data analytics life cycleGrant Thornton LLP
Regulatory mandates driving transparency and financial objectives requiring accurate understanding of customer needs have heightened the importance of data analytics to unprecedented levels making it a critical element of doing business.
Imperfect look at possible applications of Web Based Sentiment Engine MECB 2012.
Sentiment analysis involves classifying opinions from text as "positive", "negative" or “neutral. Its purpose and benefit is to assist in extracting valuable information and insight from copious amounts of unstructured data. This proposed system will have the capability to determine online sentiment on current affairs for the purpose of analysis and prediction. For the sentiment analysis a cluster-method approach is recommended, which is a recent advancement in this area. Various APIs will assist in extracting other data such as location and time. Evaluation of system through the use of the Pang et al movie review data sets is recommended to validate basic functionality and real life data in the form of the 2008 US presidential race data to evaluate all functionality of the system. Multiple industries are identified as potential users of this system from marketing companies to hotels adding to our benefit in the commercialisation potential of the system.
BUILDING A GENERAL CONCEPT OF ANALYTICAL SERVICES FOR ANALYSIS OF STRUCTURED ...Kiogyf
BUILDING A GENERAL CONCEPT OF ANALYTICAL SERVICES FOR ANALYSIS OF STRUCTURED DATA
Abstract:
In this paper, “Building a common concept of analytical services for analyzing structured data” was proposed to build an analytical service to provide forecasts, descriptive and comparative data summaries using modern Microsoft technologies. This service will allow users to pehttps://www.slideshare.net/uploadrform flexible viewing of information, receive arbitrary data slices and perform analytical operations of drill-down, convolution, pass-through distribution, the comparison in time. With the help of data mining, it is possible to detect previously unknown, non-trivial, practically useful and accessible interpretations of knowledge that are necessary for the organization's decision-making. Also, each client can interact with the service and thus monitor the displayed analytical information. In the process of work the following tasks were solved: investigated the subject area; studied materials relating to systems and technologies for their implementation; designed service architecture and applications to configure the service; selected technologies and tools for the implementation of the system; implemented the main frame of the system; modules for interaction with analysis services, data mining (a priori algorithm) and partially a module of neural networks; a report was written and a presentation of the results was prepared; The developed service will be useful to all organizations that are interested in obtaining analytical reports and other previously unknown information on their accumulated data. For example, organizations can analyze the impact of advertising, customer segmentation, search for signs of profitable customers, analyze product preferences, forecast sales volumes, and more.
Data Mining – Definition, Challenges, tasks, Data pre-processing, Data Cleaning, missing data, dimensionality reduction, data transformation, measures of similarity and dissimilarity, Introduction to Association rules, APRIORI algorithm, partition algorithm, FP growth algorithm, Introduction to Classification techniques, Decision tree, Naïve-Bayes classifier, k-nearest neighbour, classification algorithm.
Introduction to feature subset selection methodIJSRD
Data Mining is a computational progression to ascertain patterns in hefty data sets. It has various important techniques and one of them is Classification which is receiving great attention recently in the database community. Classification technique can solve several problems in different fields like medicine, industry, business, science. PSO is based on social behaviour for optimization problem. Feature Selection (FS) is a solution that involves finding a subset of prominent features to improve predictive accuracy and to remove the redundant features. Rough Set Theory (RST) is a mathematical tool which deals with the uncertainty and vagueness of the decision systems.
Prognosis - An Approach to Predictive Analytics- Impetus White PaperImpetus Technologies
For Impetus’ White Papers archive, visit- http://www.impetus.com/whitepaper
The paper talks about implementation of Behavioral Targeting for the ad world. This is a statistical machine learning algorithm that helps select most relevant ads to be displayed to a web user based on their historical data.
what is ..how to process types and methods involved in data analysisData analysis ireland
Data analysis is the process of cleaning, transforming, and processing raw data in order to extract useful and actionable information that can assist businesses in making better decisions.
Introduction to Machine Learning and Data Science using the Autonomous databa...Sandesh Rao
This session will focus on basics of what Machine Learning is, different types of Machine Learning and Neural Networks, supervised and unsupervised machine learning, AutoML for training models and this ends with an example of how to predict workloads using Average Active sessions and different algorithms as an example and also how to predict maintenance windows for your databases. We will also use many examples from the ADW Oracle Autonomous Database offering, Oracle Machine Learning library to make this a session with lots of code examples in addition to the theory of Machine Learning and you will walk out having a definitive path to being a data scientist
Elevating Tactical DDD Patterns Through Object CalisthenicsDorra BARTAGUIZ
After immersing yourself in the blue book and its red counterpart, attending DDD-focused conferences, and applying tactical patterns, you're left with a crucial question: How do I ensure my design is effective? Tactical patterns within Domain-Driven Design (DDD) serve as guiding principles for creating clear and manageable domain models. However, achieving success with these patterns requires additional guidance. Interestingly, we've observed that a set of constraints initially designed for training purposes remarkably aligns with effective pattern implementation, offering a more ‘mechanical’ approach. Let's explore together how Object Calisthenics can elevate the design of your tactical DDD patterns, offering concrete help for those venturing into DDD for the first time!
Connector Corner: Automate dynamic content and events by pushing a buttonDianaGray10
Here is something new! In our next Connector Corner webinar, we will demonstrate how you can use a single workflow to:
Create a campaign using Mailchimp with merge tags/fields
Send an interactive Slack channel message (using buttons)
Have the message received by managers and peers along with a test email for review
But there’s more:
In a second workflow supporting the same use case, you’ll see:
Your campaign sent to target colleagues for approval
If the “Approve” button is clicked, a Jira/Zendesk ticket is created for the marketing design team
But—if the “Reject” button is pushed, colleagues will be alerted via Slack message
Join us to learn more about this new, human-in-the-loop capability, brought to you by Integration Service connectors.
And...
Speakers:
Akshay Agnihotri, Product Manager
Charlie Greenberg, Host
UiPath Test Automation using UiPath Test Suite series, part 4DianaGray10
Welcome to UiPath Test Automation using UiPath Test Suite series part 4. In this session, we will cover Test Manager overview along with SAP heatmap.
The UiPath Test Manager overview with SAP heatmap webinar offers a concise yet comprehensive exploration of the role of a Test Manager within SAP environments, coupled with the utilization of heatmaps for effective testing strategies.
Participants will gain insights into the responsibilities, challenges, and best practices associated with test management in SAP projects. Additionally, the webinar delves into the significance of heatmaps as a visual aid for identifying testing priorities, areas of risk, and resource allocation within SAP landscapes. Through this session, attendees can expect to enhance their understanding of test management principles while learning practical approaches to optimize testing processes in SAP environments using heatmap visualization techniques
What will you get from this session?
1. Insights into SAP testing best practices
2. Heatmap utilization for testing
3. Optimization of testing processes
4. Demo
Topics covered:
Execution from the test manager
Orchestrator execution result
Defect reporting
SAP heatmap example with demo
Speaker:
Deepak Rai, Automation Practice Lead, Boundaryless Group and UiPath MVP
Kubernetes & AI - Beauty and the Beast !?! @KCD Istanbul 2024Tobias Schneck
As AI technology is pushing into IT I was wondering myself, as an “infrastructure container kubernetes guy”, how get this fancy AI technology get managed from an infrastructure operational view? Is it possible to apply our lovely cloud native principals as well? What benefit’s both technologies could bring to each other?
Let me take this questions and provide you a short journey through existing deployment models and use cases for AI software. On practical examples, we discuss what cloud/on-premise strategy we may need for applying it to our own infrastructure to get it to work from an enterprise perspective. I want to give an overview about infrastructure requirements and technologies, what could be beneficial or limiting your AI use cases in an enterprise environment. An interactive Demo will give you some insides, what approaches I got already working for real.
Generating a custom Ruby SDK for your web service or Rails API using Smithyg2nightmarescribd
Have you ever wanted a Ruby client API to communicate with your web service? Smithy is a protocol-agnostic language for defining services and SDKs. Smithy Ruby is an implementation of Smithy that generates a Ruby SDK using a Smithy model. In this talk, we will explore Smithy and Smithy Ruby to learn how to generate custom feature-rich SDKs that can communicate with any web service, such as a Rails JSON API.
DevOps and Testing slides at DASA ConnectKari Kakkonen
My and Rik Marselis slides at 30.5.2024 DASA Connect conference. We discuss about what is testing, then what is agile testing and finally what is Testing in DevOps. Finally we had lovely workshop with the participants trying to find out different ways to think about quality and testing in different parts of the DevOps infinity loop.
Encryption in Microsoft 365 - ExpertsLive Netherlands 2024Albert Hoitingh
In this session I delve into the encryption technology used in Microsoft 365 and Microsoft Purview. Including the concepts of Customer Key and Double Key Encryption.
Essentials of Automations: Optimizing FME Workflows with ParametersSafe Software
Are you looking to streamline your workflows and boost your projects’ efficiency? Do you find yourself searching for ways to add flexibility and control over your FME workflows? If so, you’re in the right place.
Join us for an insightful dive into the world of FME parameters, a critical element in optimizing workflow efficiency. This webinar marks the beginning of our three-part “Essentials of Automation” series. This first webinar is designed to equip you with the knowledge and skills to utilize parameters effectively: enhancing the flexibility, maintainability, and user control of your FME projects.
Here’s what you’ll gain:
- Essentials of FME Parameters: Understand the pivotal role of parameters, including Reader/Writer, Transformer, User, and FME Flow categories. Discover how they are the key to unlocking automation and optimization within your workflows.
- Practical Applications in FME Form: Delve into key user parameter types including choice, connections, and file URLs. Allow users to control how a workflow runs, making your workflows more reusable. Learn to import values and deliver the best user experience for your workflows while enhancing accuracy.
- Optimization Strategies in FME Flow: Explore the creation and strategic deployment of parameters in FME Flow, including the use of deployment and geometry parameters, to maximize workflow efficiency.
- Pro Tips for Success: Gain insights on parameterizing connections and leveraging new features like Conditional Visibility for clarity and simplicity.
We’ll wrap up with a glimpse into future webinars, followed by a Q&A session to address your specific questions surrounding this topic.
Don’t miss this opportunity to elevate your FME expertise and drive your projects to new heights of efficiency.
JMeter webinar - integration with InfluxDB and GrafanaRTTS
Watch this recorded webinar about real-time monitoring of application performance. See how to integrate Apache JMeter, the open-source leader in performance testing, with InfluxDB, the open-source time-series database, and Grafana, the open-source analytics and visualization application.
In this webinar, we will review the benefits of leveraging InfluxDB and Grafana when executing load tests and demonstrate how these tools are used to visualize performance metrics.
Length: 30 minutes
Session Overview
-------------------------------------------
During this webinar, we will cover the following topics while demonstrating the integrations of JMeter, InfluxDB and Grafana:
- What out-of-the-box solutions are available for real-time monitoring JMeter tests?
- What are the benefits of integrating InfluxDB and Grafana into the load testing stack?
- Which features are provided by Grafana?
- Demonstration of InfluxDB and Grafana using a practice web application
To view the webinar recording, go to:
https://www.rttsweb.com/jmeter-integration-webinar
Dev Dives: Train smarter, not harder – active learning and UiPath LLMs for do...UiPathCommunity
💥 Speed, accuracy, and scaling – discover the superpowers of GenAI in action with UiPath Document Understanding and Communications Mining™:
See how to accelerate model training and optimize model performance with active learning
Learn about the latest enhancements to out-of-the-box document processing – with little to no training required
Get an exclusive demo of the new family of UiPath LLMs – GenAI models specialized for processing different types of documents and messages
This is a hands-on session specifically designed for automation developers and AI enthusiasts seeking to enhance their knowledge in leveraging the latest intelligent document processing capabilities offered by UiPath.
Speakers:
👨🏫 Andras Palfi, Senior Product Manager, UiPath
👩🏫 Lenka Dulovicova, Product Program Manager, UiPath
Dev Dives: Train smarter, not harder – active learning and UiPath LLMs for do...
Risk mgmt-analysis-wp-326822
1. An Oracle White Paper
September 2010
Predictive Analytics:
Bringing The Tools To The Data
2. Predictive Analytics: Bringing the Tools to the Data
Introduction ......................................................................................... 2
What Are Predictive Analytics -- The Traditional View........................ 3
A Better Classification......................................................................... 4
Predicting the Present......................................................................... 5
Shaping The Future ............................................................................ 7
A Better Approach............................................................................... 9
Words of Warning ............................................................................. 11
3. Predictive Analytics: Bringing the Tools to the Data
2
Introduction
"It's hard to make predictions, especially when they are about the future" is a quote usually
attributed to American baseball-legend Yogi Berra1.
Not a good start when discussing predictive analytics.
It gets even more problematic when we realize what analytics exactly are. Analytics are the
methods of decomposing concepts or substances into smaller pieces, to understand their
workings. How can you analyze the future? There is no concept or substance to break down yet.
To go further, predictive analytics even sounds like an oxymoron. Predictive is rehearsing an
important conversation beforehand: "If they say this, I will respond with that...", while analytics is
evaluating the conversation afterwards; "Gosh, I should have said that..."
It is easy to come to conclusions like this, when you don't have a good understanding of what
predictive analytics actually mean. In this paper we discuss what predictive analytics can and
cannot do, the various categories of predictive analytics, and how to best apply them.
1 The quote has been attributed to the American author Mark Twain and the Danish physicist Niels Bohr as well.
4. Predictive Analytics: Bringing the Tools to the Data
3
What Are Predictive Analytics -- The Traditional View
"Predictive analytics encompasses a variety of techniques from statistics, data mining and game
theory that analyze current and historical facts to make predictions about future events"2, is how
Wikipedia describes it. The variety of techniques is usually divided in three categories: predictive
models, descriptive models and decision models. Predictive models look for certain relationships and
patterns that usually lead to a certain behavior, point to fraud, predict system failures, assess
credit worthiness, and so forth. By determining the explanatory variables, you can predict
outcomes in the dependent variables. Descriptive models aim at creating segmentations, most
often used to classify customers based on for instance sociodemographic characteristics, life
cycle, profitability, product preferences and so forth. Where predictive models focus on a specific
event or behavior, descriptive models identify as many different relationships as possible. Lastly,
there are decision models that use optimization techniques to predict results of decisions. This
branch of predictive analytics leans particularly heavily on operations research, including areas
such as resource optimization, route planning and so forth. Table 1 provides an overview.
PREDICTIVE MODELS DESCRIPTIVE MODELS DECISION MODELS
• Find causality, relationships and
patterns between explanatory variables
and dependent variables
• Focus on specific variables
• Examples: next customer preference,
fraud, credit worthiness, system failure
• Find clusters of data elements with
similar characteristics
• Focus on as many variables as
possible
• Examples: customer segmentation
based on sociodemographic
characteristics, life cycle, profitability,
product preferences
• Find optimal and most certain
outcome for a specific decision
• Focus on a specific decision
• Examples: critical path, network
planning, scheduling, resource
optimization, simulation, stochastic
modeling
Table 1: Practical classification
This classification is very practical; it provides an immediate understanding of the areas where
predictive analytics add value. However, there are two problems with it:
• The classification is not exhaustive. If a new area of predictive analytics were to arise
tomorrow the current classification would become invalid
• The classification doesn't tell what the categories don't do. The limitations of each
category are not clear.
2 www.wikipedia.com, "Predictive Analytics", August 2010
5. Predictive Analytics: Bringing the Tools to the Data
4
A Better Classification
The reason why there is so much misunderstanding about predictive analytics is in the common
conception that predictions have to be about the future. A more conceptual classification solves
this misconception and addresses the issues with the current segmentation. This conceptual
classification distinguishes between two types of predictive analytics:
• Predicting the Present
• Shaping the Future
Trends develop like S-curves. They start slowly, take off, and become the new paradigm and
"best practice". Then, at one moment, something unexpected happens3. New regulations, a
better technology, a scandal within the market, whatever. The list of possible disruptions is
endless. Within the paradigm we can predict what is happening, as long as the assumptions don't
change. Once there is a disruption, a structural break, a new S-curve builds, and the process
repeats. See figure 1.
Figure 1: S-curves and predictive analytics.
Predictive analytics that predict the present focus on analyzing what happens within a stable and
current situation, based on a set of assumptions that describe reality. Predictive analytics that help
shape the future focus on preparing for the next S-curve, and help formulate a new set of
assumptions.
3 This moment is often referred to as a "Black Swan". Something we thought couldn't happen within the rules of
the game.
6. Predictive Analytics: Bringing the Tools to the Data
5
Predicting the Present
Predictive analytics that predict the present are based on existing data, preferably as much as
possible. Through data mining and all other applicable techniques, patterns are detected and rules
are derived. Within the bounds of its present S-curve, there is predictive value. Not towards the
future, but towards similar occurrences. For instance, if Customer A buys a pair of trousers, there is
a large chance he or she is also interested in socks. Or if there are expense items with the name
of a fashion brand on a corporate credit card, it is an irregular transaction. The analytics take
place as deep in the process and as real-time as possible. Table 2 provides an overview of typical
uses, based on the functionality of Oracle Data Mining, which is embedded in the Oracle
database.
FUNCTIONALITY ALGORITHM APPLICABILITY
Classification Logistic Regression (GLM)
Decision Trees
Naïve Bayes
Support Vector Machine
Response modeling
Recommending "next likely product"
Employee retention
Credit default modelling
Regression Multiple Regression (GLM)
Support Vector Machine
Credit scoring
Customer profitability modeling
Anomaly detection One Class SVM (Support Vector
Machine)
Claims fraud
Network intrusion
Attribute importance Minimum Description Length (MDL) Surgery preparation, triage
Net promoter score
Association rules Apriori Market basket analysis
Link analysis
Clustering Hierarchical K-Means
Hierarchical O-Cluser
Customer segmentation
Gene and protein analysis
Feature extraction Non-Negative Matrix Factorization
(NMF)
Text analysis, search
Table 2: Functionality overview Oracle Data Mining
Oracle Data Mining
Oracle Data Mining uses a multitude of algorithms that can automatically sift deep into your data
at the individual record level to discover patterns, relationships, factors, clusters, associations,
profiles, and predictions—that were previously “hidden”. Since Oracle Data Mining functions
reside natively in the Oracle Database kernel, they deliver high performance, high scalability and
security. The data and data mining functions never leave the database to deliver a comprehensive
in-database processing solution. With Oracle Data Mining, special departments of advanced data
analysts working in silos far away from the database are no longer needed.
7. Predictive Analytics: Bringing the Tools to the Data
6
The true value of data mining is best realized when the new insights and predictions are directly
supplied to existing business applications. With Oracle Data Mining users can supply predictive
analytics to business applications, call centers, web sites, campaign management systems,
automatic teller machines (ATMs), enterprise resource management (ERM), and other
operational and business planning applications. The database becomes more than just a data
repository—it becomes an analytical database that can undergird many new advanced use cases.
Overview of benefits:
• Mines data inside Oracle Database, an industry leader in performance and reliability
• Eliminates data extraction and movement
• Provides a platform for analytics-driven database applications
• Provides increased security by leveraging database security options
• Delivers lowest total cost of ownership (TCO) compared to traditional data mining vendors
• Leverages 30+ years of experience of ever advancing Oracle Database technology
Oracle Real-Time Decisions
Where Oracle Data Mining integrates in the database, as a decision framework Oracle Real-Time
Decisions (Oracle RTD) nests itself in process engines. Oracle RTD, at its core, is a closed-loop
recommendation engine. It helps optimize customer interactions using analytical techniques such
as business rules, data mining, or statistics. Instead of deep analysis in an offline environment --
the database -- Oracle RTD immediately influences the real-time data stream by providing
recommendations on how to complete the transaction.
Oracle RTD particularly focuses on personalized customer interactions flows. By learning from
every single interaction and adjusting the business processes in real-time, Oracle RTD optimizes
the value of each opportunity in itself, as well as every subsequent opportunity. It starts with a list
of possible next actions, and then adds information about the customer, session history,
customer history, your business goals, and what has worked or not worked in the past. RTD uses
that information to come up with a recommendation for the best action to take next. Each
decision is made using a statistical model that predicts the outcome of the interaction based on
what is known about the customer and how similar customers have responded in the past.
Because RTD operates as a business process engine, its decision framework can leverage the real-
time context of the interaction in rules or predictive models. This allows to account for data such
as the time of the day, the agent you are interacting with or the context of your web session to
improve the recommendation logic. Context data is a key predictor.
Oracle RTD applications can be fully automated, requiring no manual effort for building and
maintaining its predictive models. Oracle RTD automatically learns from each customer
interaction by autonomously updating its predictive models in real time.
8. Predictive Analytics: Bringing the Tools to the Data
7
Shaping The Future
Predicting the present helps an organization improve its organizational excellence. In other
words, it increases efficiency and improves the effectiveness of operations. However,
organizations also have another set of processes: management processes. These are aimed at
creating and implementing new strategies, and monitoring progress. Shaping the future improves
an organization's management excellence4.
One of the most dominant predictive tools on the strategic levels is a strategy map, part of the
balanced scorecard. Strategy maps aim to be predictive, as they aspire to show how decisions
made in the present could impact future results. This is done through linking leading and lagging
indicators. A leading indicator predicts future performance; a lagging indicator reports past
performance. For instance, for a postal service, the percentage of mail delivered within 24 hours
is a leading indicator for customer satisfaction. Statistics are used to discover and test these
relationships. You can use statistical techniques only if you have enough data. Data, by definition,
describes results from the past. Given that all we can truly predict about the future is that most
likely it will be different from today, you can question the predictive value of correlations found
in data describing the past. Putting it in stronger words, you could even argue that validating a
strategy map based on correlating past data, by definition, invalidates it5.
A different approach than predicting the present is needed; an approach in which we create the
data for the future, in terms of new assumptions, what-if questions and scenarios. It is within
these assumptions that the risk and uncertainty that are part of any strategic planning can be
captured. To create good assumptions, organizations must complete three critical steps6:
• Make the assumptions realistic.
• Identify the assumptions that matter most.
• Leverage the drivers that can be controlled and monitor those that cannot.
Several technologies can be helpful in this process.
4 See all of Oracle's management excellence white papers on www.oracle.com/thoughtleadership, in the resource
center
5 Based on Buytendijk, F.A., "Dealing with Dilemmas", Wiley, 2010
6 Driving Strategic Planning with Predictive Modeling, July 2008, www.oracle.com
9. Predictive Analytics: Bringing the Tools to the Data
8
OLAP
Hyperion Essbase is an OLAP database, in which data is stored in a multidimensional format.
This means the data is categorized in the form of dimensions, representing business structures.
Typical business dimensions are 'product', 'customer', 'region' and 'time'. To perform what-if
analysis and model possible future scenarios, a 'scenario' dimension is added. Scenario-building
consists of using the following critical functionalities:
• Create multiple hierarchies. By modeling alternative ways of segmenting customers,
grouping products, consolidating organizational entities or any other type of business
hierarchy, results can be tested before they are implemented as the new standard way of
looking at the business
• Use forecast calculations. Based on multiple assumptions, forecasts can be created.
Based on likelihood and realism the best forecast can be determined and implemented.
• Data entry. There is no data about the future available in business systems. Based on
new assumptions business users may have to input the data themselves, preferably in a
collaborative manner. Multi-user read write capabilities and version control are needed
to manage such a process.
Hyperion Strategic Planning
Financial modeling is a special activity. It requires specific functionality. At the same time the
structure in which the modeling takes place is highly standardized: a balance sheet, a profit and
loss statement and a cash flow overview. Oracle Hyperion Strategic Finance integrates strategic
planning into an enterprise planning process. It allows users to quickly develop financial models,
perform on the fly what-if impact analysis based on dynamic decision variables and arrive at
targets that can then be implemented. The what-if analysis toolkit is a unique and powerful set of
out-of-the-box tools that allow you to easily create an unlimited number of scenarios by business
unit. Other capabilities let you evaluate any metric’s sensitivity to key performance drivers and
run periodic “goal-seek” checks to determine the performance level needed to achieve specific
financial objectives.
Hyperion Strategic Planning allows organizations to spend more time simulating long-term
alternative strategies, developing contingent scenarios, and stress testing financial models.
Crystal Ball
Shaping the future is done outside operational business systems. It requires a modeling
framework that can handle both structure and creativity. Crystal Ball uses a spreadsheet interface
– the most widely used business analyst tool – to create the data for the future, in terms of new
assumptions, what-if questions and scenarios. Either standalone in a spreadsheet, or integrated
with Essbase and Strategic Planning, Crystal Ball facilitates the creation of good assumptions.
Going through the three critical steps that are needed to shape the future, Crystal Ball can:
10. Predictive Analytics: Bringing the Tools to the Data
9
• Make the assumptions realistic. Regardless of how much data you have (or none at
all) apply any or all of the available techniques to improve the model assumptions: time-
series forecasting, regression analysis, distribution fitting and simulation methods.
• Identify the assumptions that matter most. Determine the sensitivity of the forecast
to each assumption, so you know where to focus your resources. Sensitivity charts and
Tornado charts rank and help visualize which assumptions are the most important to
the least important in the model.
• Leverage the drivers that can be controlled and monitor those that cannot.
Because of the uncertainty inherent in models that shape the future, changing a driver (a
decision variable) can have a significant effect on the forecast results. For one or two
drivers, use the Decision Table tool, which quickly runs multiple simulations to test the
effects of changing the drivers. For models that contain more than a handful of decision
variables, or where you are trying to optimize the forecast results, optimization is used
to automatically find optimal solutions to simulation models.
A Better Approach
Traditionally, predictive analytics require a laborious process. Figure X shows a typical flow of
activities.
Figure 2: Traditional predictive analytics process
Based on a hypothesis -- an assumption to test -- the data that are needed are identified and
extracted from their sources, such as an ERP or CRM system, or coming from the data
warehouse. Different predictive analytics tools have different requirements on how to best
process the data, usually the data require some transformation to fit the specifics of the tool.
Only then the analysis can take place successfully. After the analysis and removal of all the
"noise" in the data, conclusions are drawn that lead to changes in for instance customer
segmentation or product clustering, and the success of the analysis is monitored. After that, the
cycle starts all over.
11. Predictive Analytics: Bringing the Tools to the Data
10
The key assumption of this approach is that it is best to take the data to the tools, which are
handled by the experts. This assumption is outdated. It is a costly approach, takes too much time,
robs the process of its creativity and doesn't allow the number of experiments to scale.
Oracle's strategy is different. Oracle feels it is better to bring the tools to the data. Oracle Data
Mining resides in the Oracle database itself, and is used by many business applications. Real-Time
Decisions nests itself into the process engine of business applications, generating real-time alerts,
particularly in customer contact interactions. Hyperion Strategic Finance is an add-on to
Hyperion Financial Management and Hyperion Planning, for long-term financial modeling, and
Crystal Ball integrates with Essbase and Hyperion planning. Figure 3 shows how the tools are
brought to the data.
There are multiple advantages to bringing the tools to the data:
• It is less costly and increases speed. There is no need to extract and transform data and
move it to another environment, which is often the most laborious part of the process.
• Moreover, the increased speed of the process makes the process more iterative, and
therewith increases the quality of the output. It becomes possible to run many more
analyses and scenarios in the same amount of limited time, before deciding what the
best outcome is.
• Predictive analytics become part of a standard business process, instead of a specialist
activity, and has a more direct business impact.
• It adds creativity to the process. If attributes need to be added while experimenting with
multiple analyses, the addition can be done without going back to the source data. The
hypothesis can be narrowed and widened without significant consequences.
12. Predictive Analytics: Bringing the Tools to the Data
11
In addition, Oracle Real-Time Decisions, Crystal Ball, Hyperion Essbase and Strategic Finance
integrate with non-Oracle databases and non-Oracle business applications as well.
Figure 3: Bringing the tools to the data
Words of Warning
To truly understand the possibilities and limitations of such advanced technologies on which
predictive analytics are based, ironically we need to go back to the old philosophers. Plato's Cave
describes an interesting thought experiment. Imagine a few people in a cave, sitting against a
small wall, facing the other end. They are locked in chains and have been for all their lives. On
top of the wall other people walk around, but they cannot be seen by the chained people. A large
fire in the back of the cave casts the shadows of those people walking around on the wall at the
other end, and the echos of their voices makes the sound come from the other end too. For the
people in chains these shadows are the reality of the world, they do not have any knowledge
about the people walking around on top of the little wall. The shadows are all they know.
Analysts can easily fall into the same trap, unconsciously mistaking their model and analysis for
the real world. Reality is interpreted "to fit the model", signals that change is coming are called
13. Predictive Analytics: Bringing the Tools to the Data
12
"outliers". Force-fitting reality into our frame of reference is deeply human, and we are all prone
to it. What helps counter this pitfall is to experiment7. Continuously try the outcomes of
predictive analytics in your operational environment. Even run multiple experiments at the same
time. See which ones lead to better results, and implement. Using simulations and other
techniques, predictive analytics should be applied continuously and incrementally.
Another word of warning comes from "Occam's Razor", based on the work of the 14th century
Franciscan friar William of Ockham. Occam's razor is a research principle. In forming a theory,
you should use the fewest elements needed to accurately predict an outcome. The more
assumptions you use, and the more you stack analysis on top of analysis, the more likely you are
to be inaccurate or wrong. To create a robust theory, you need to shave away all unnecessary
elements from the analysis (hence "razor"). Seen this way, two of the least reliable indicators of
business success are profit and customer satisfaction. They are based on many assumptions.
Better indicators are for instance cash-flow and on-time delivery, that are much closer to direct
observation and measurement.
Although predictive analytics are based on sophisticated technologies and mathematical
techniques, their success lies in applying them with common sense.
7 "Analytical competitors", as they are called in Davenport's book "Competing on Analytics", take this approach
to analytics.