Downloaded 907 times

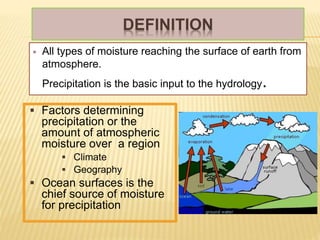
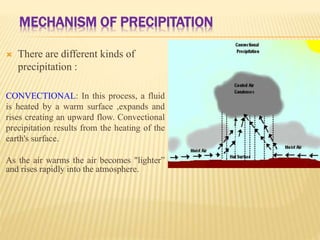
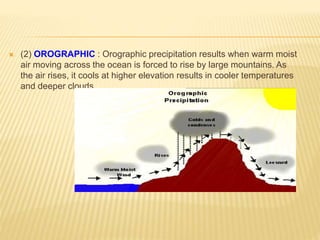
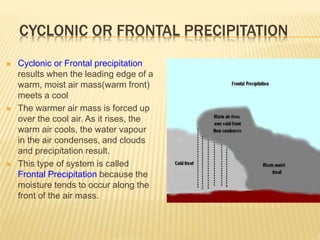
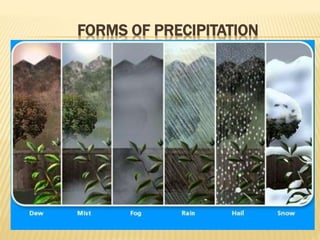
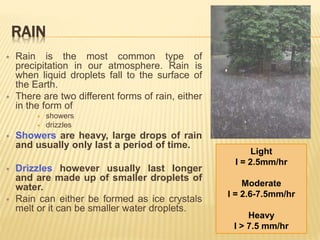
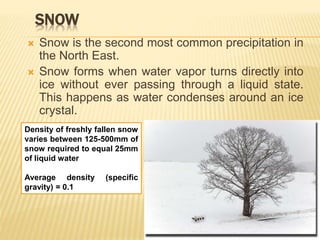
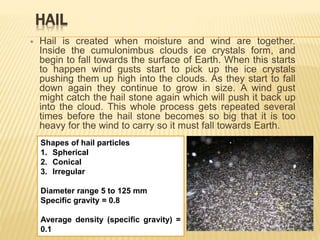
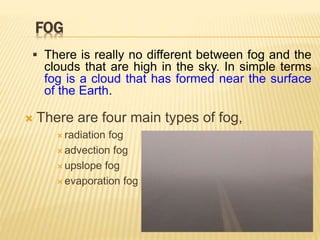
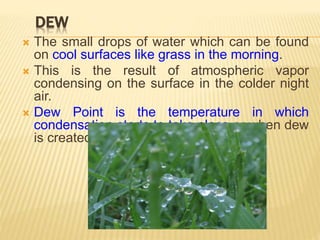
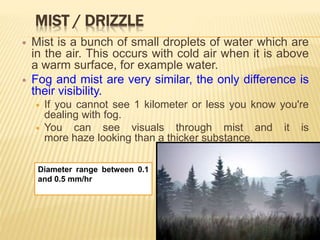
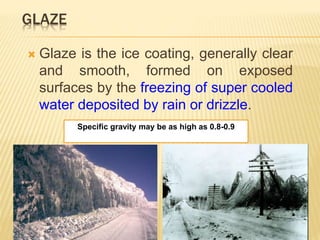
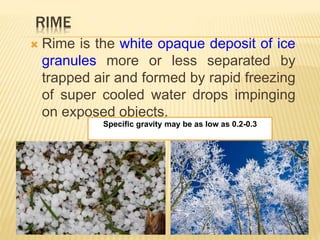
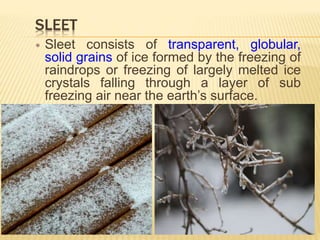
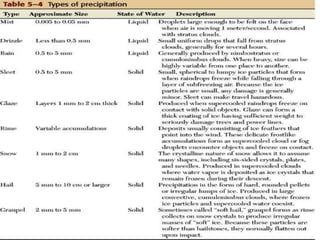
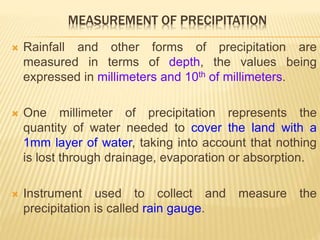
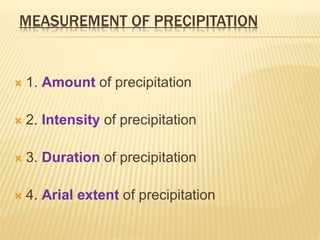
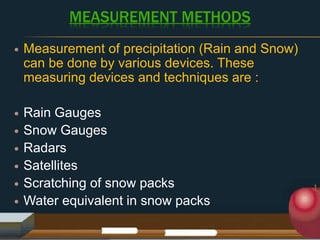
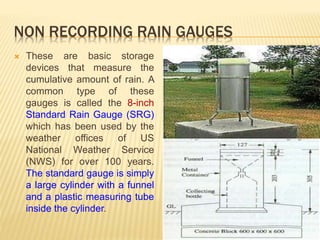
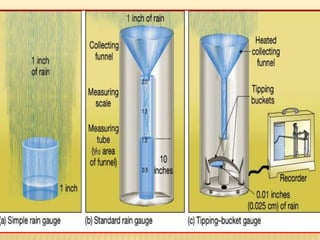


Precipitation occurs when moisture from the atmosphere reaches the Earth's surface. There are several types of precipitation including rain, snow, hail, fog, dew, mist, glaze, rime, and sleet. Precipitation forms through convectional, orographic, and cyclonic/frontal mechanisms. Rainfall and snowfall are most commonly measured using non-recording and recording rain gauges, which collect precipitation and allow measurement of amount, intensity, and duration. Proper siting and placement of rain gauges is important to obtain accurate precipitation measurements.