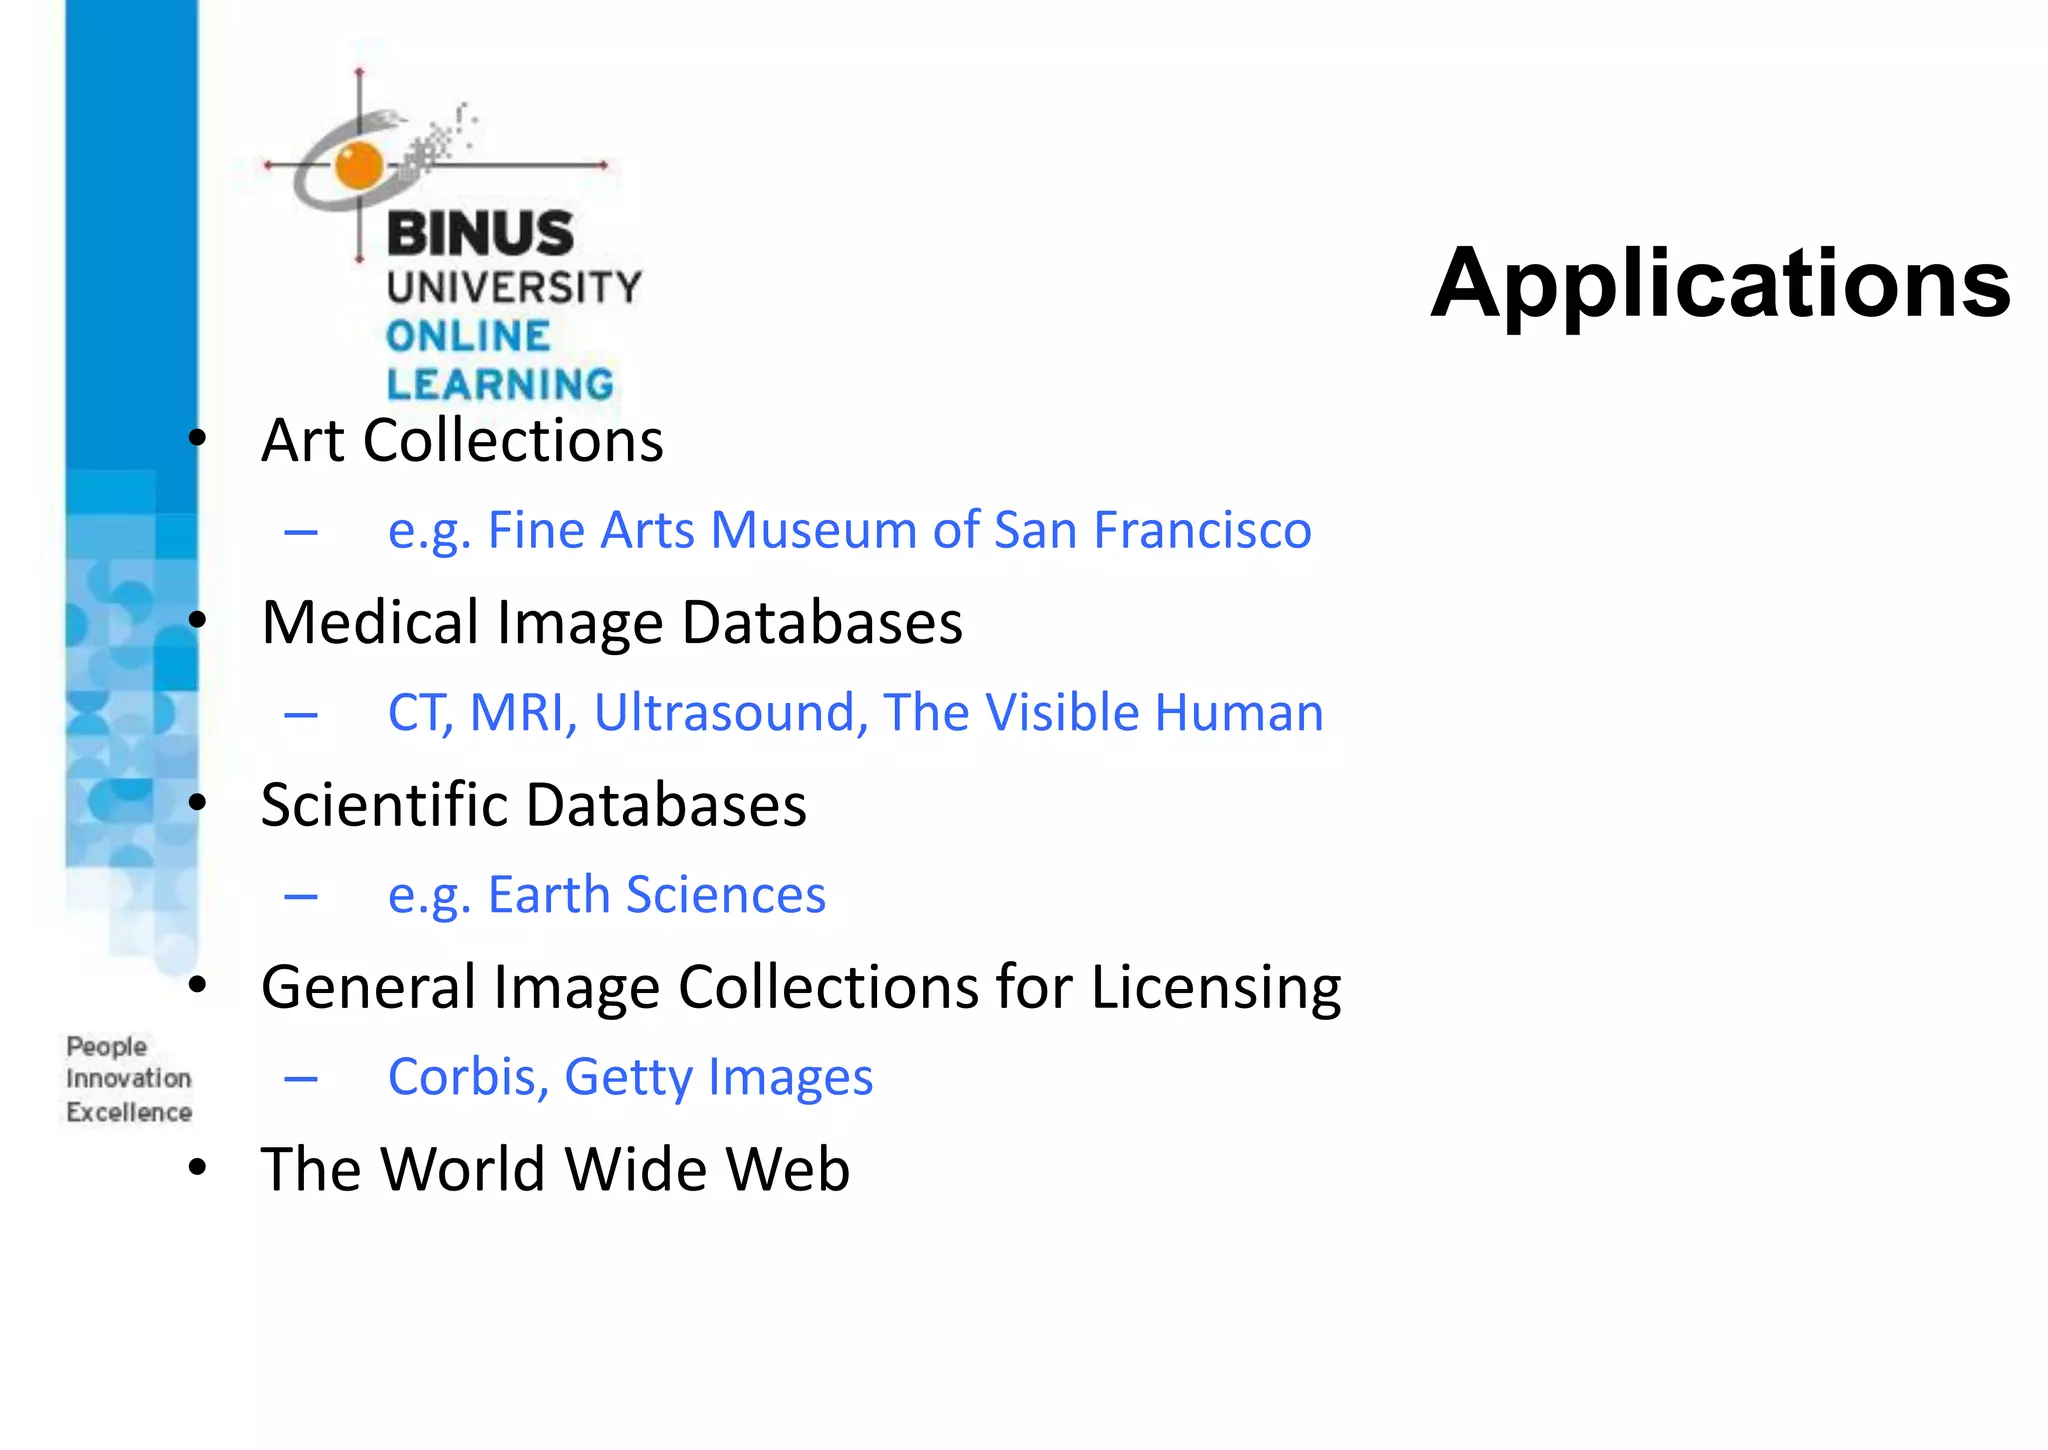
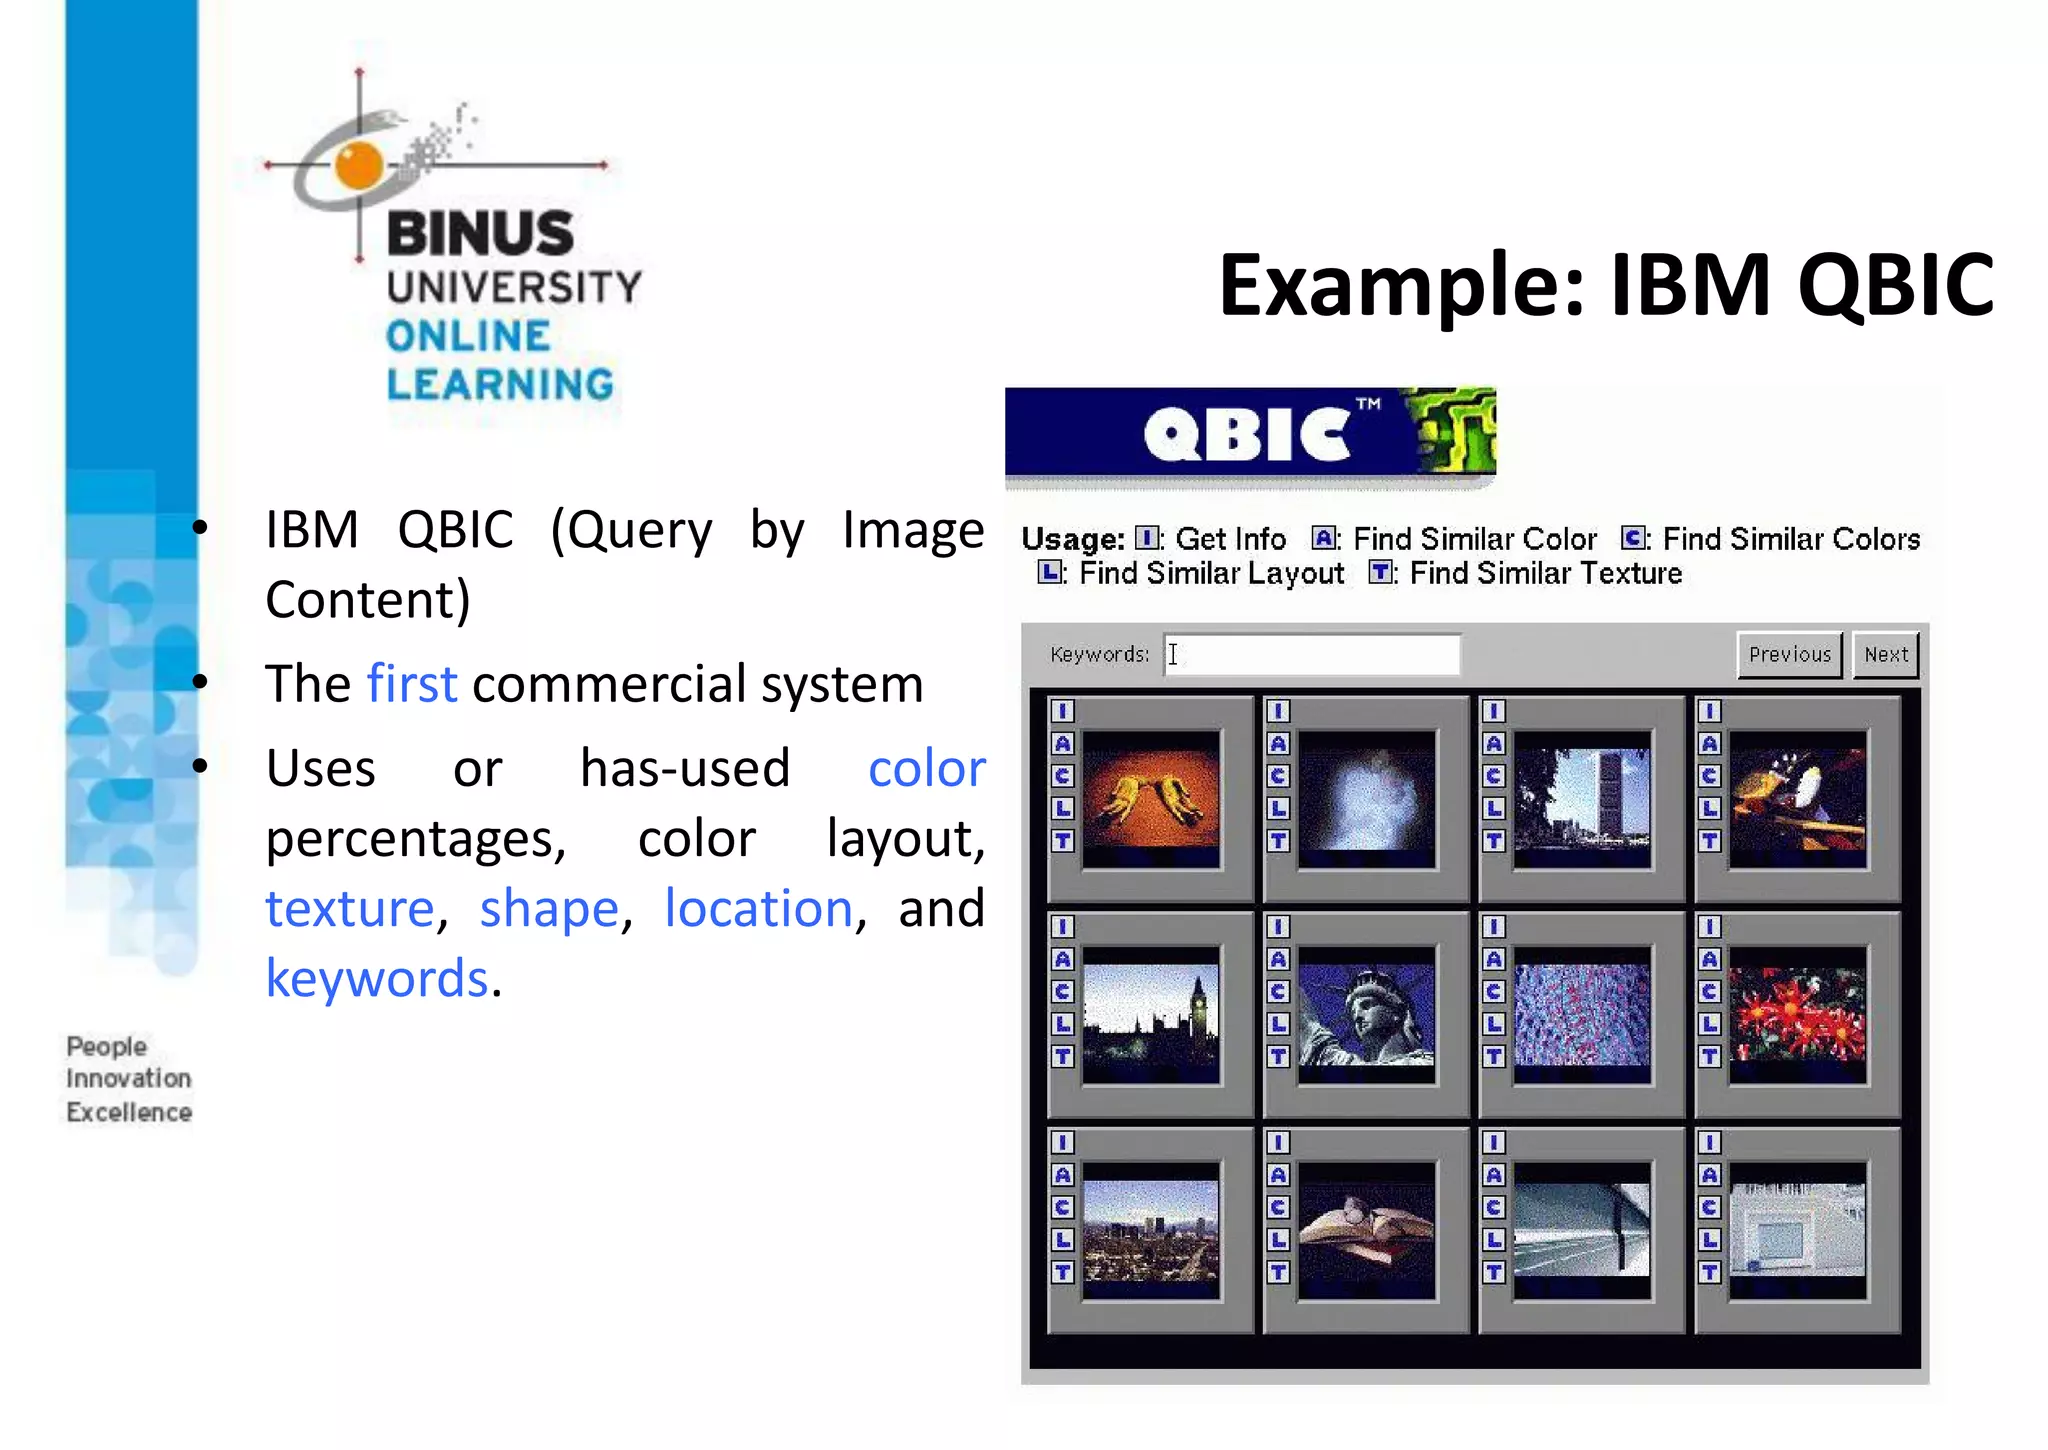
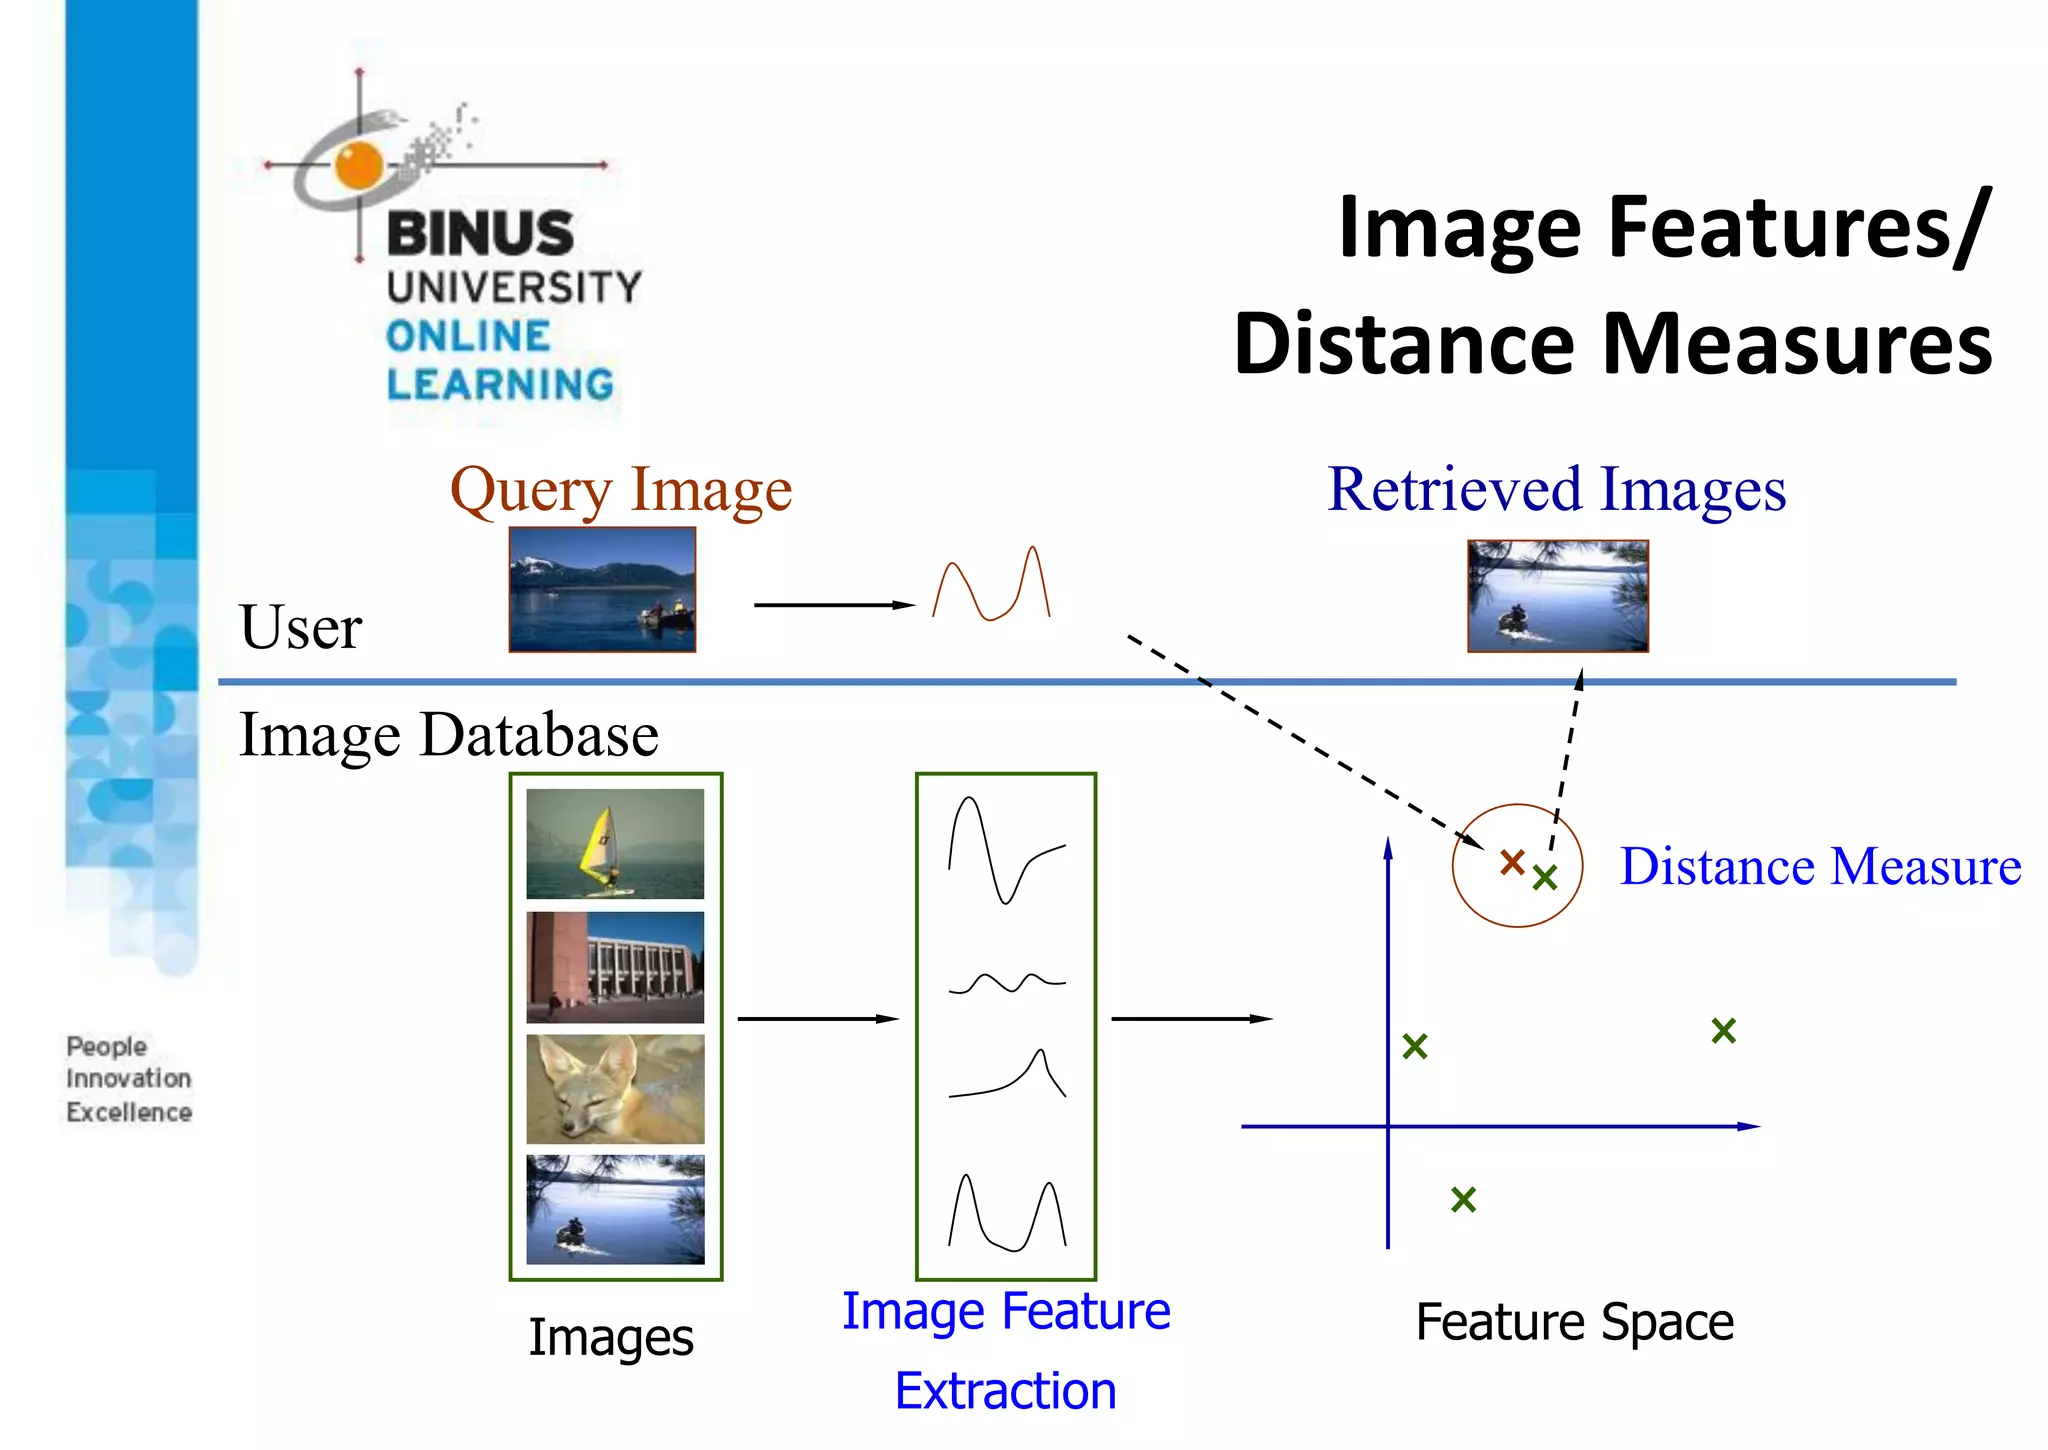
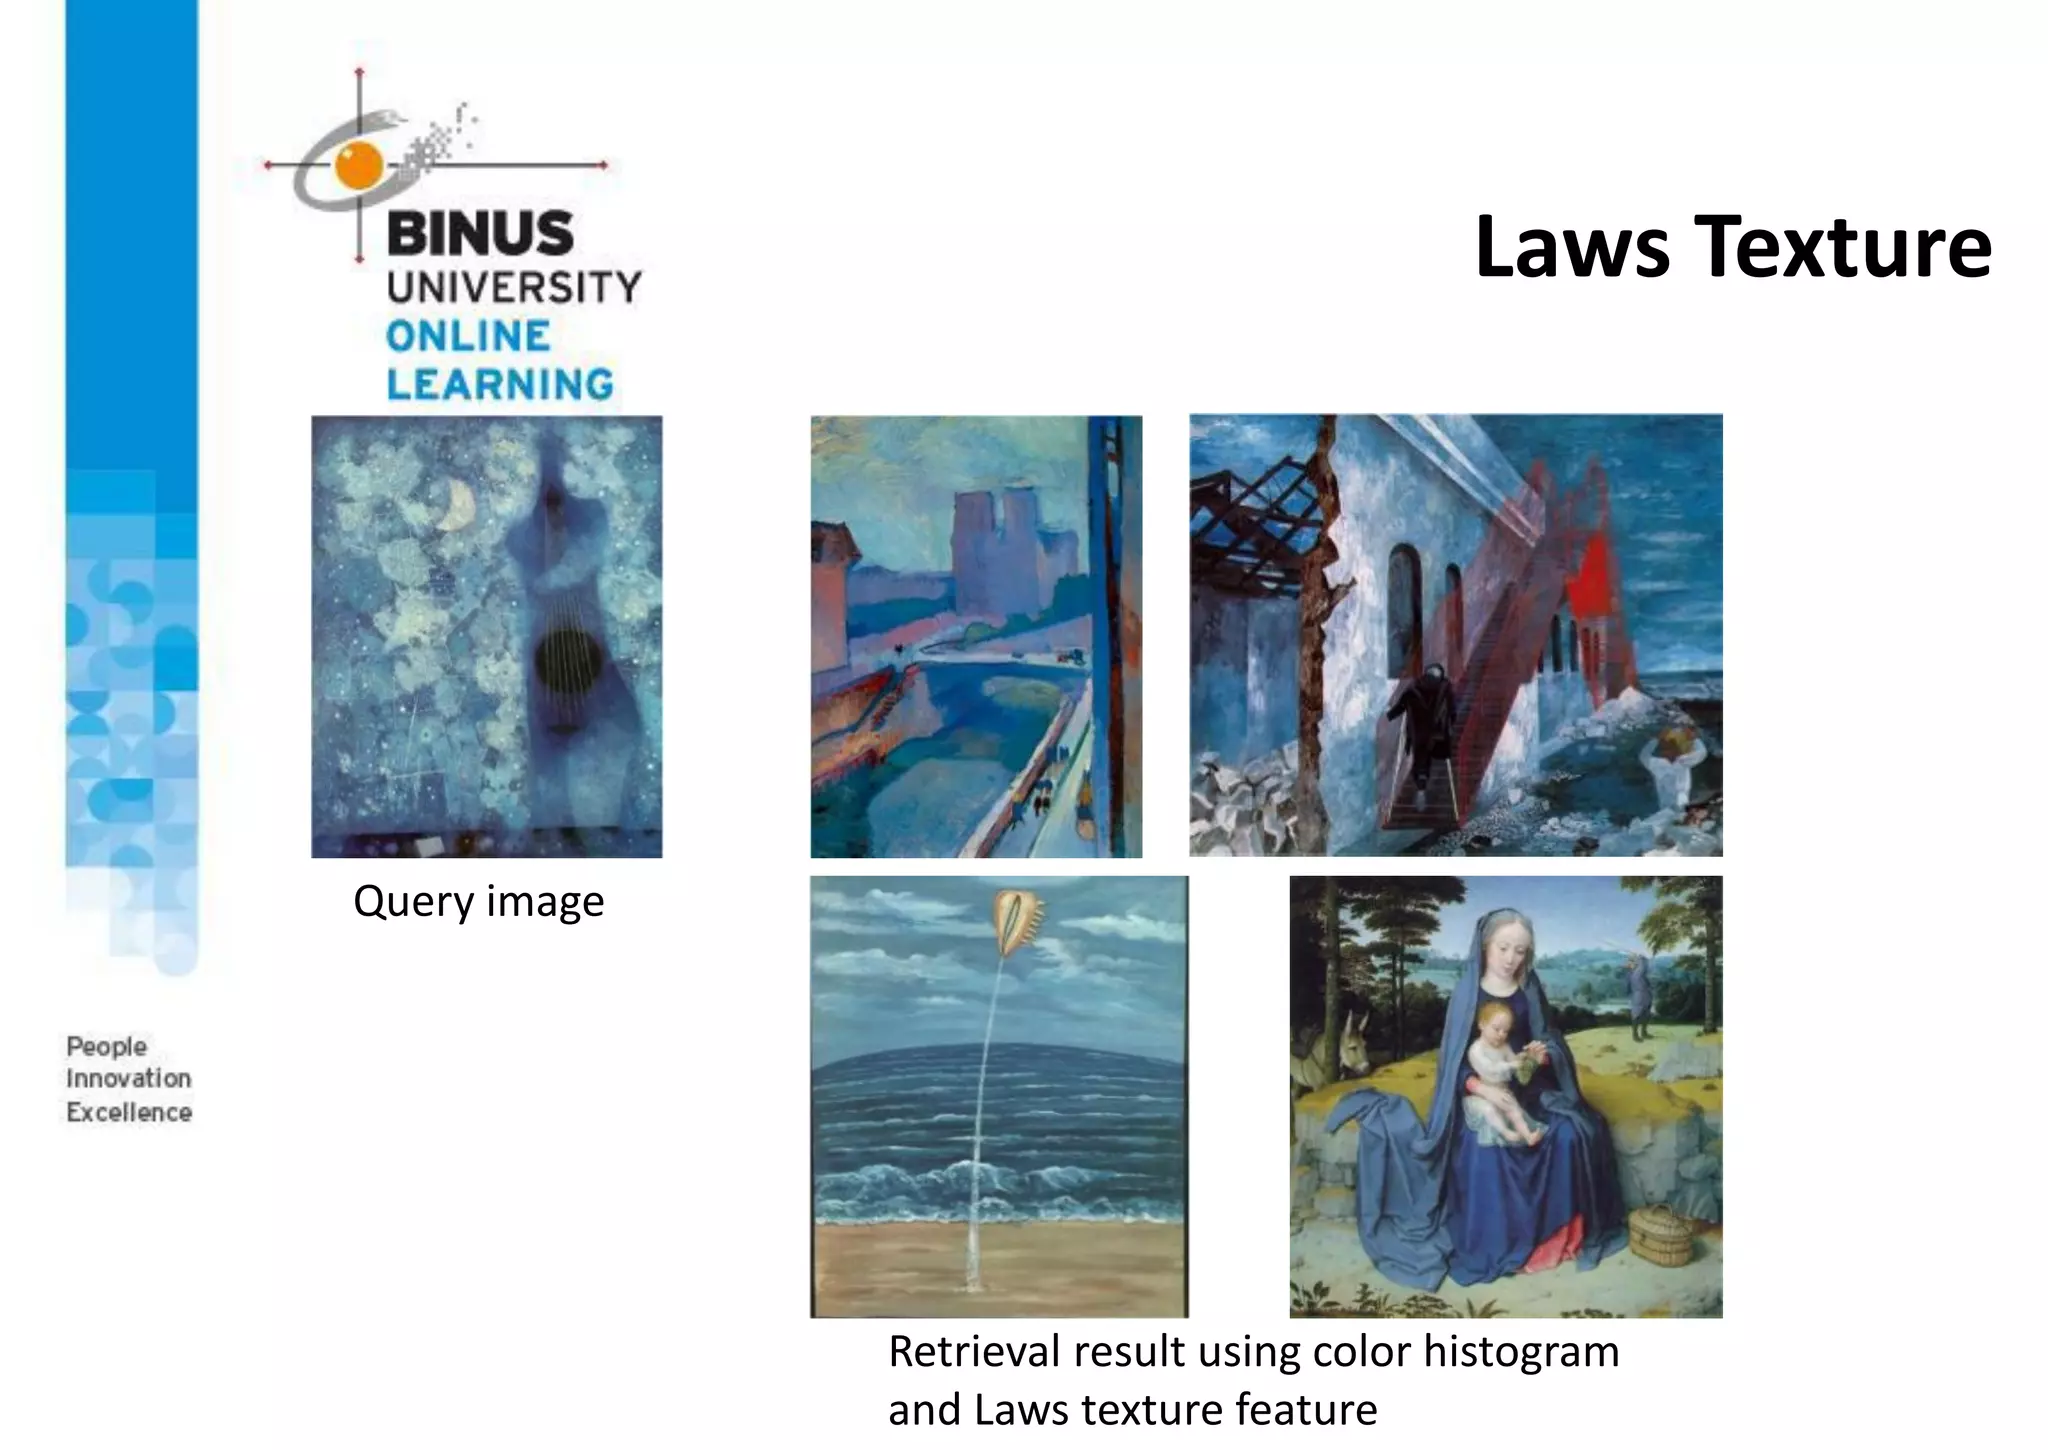
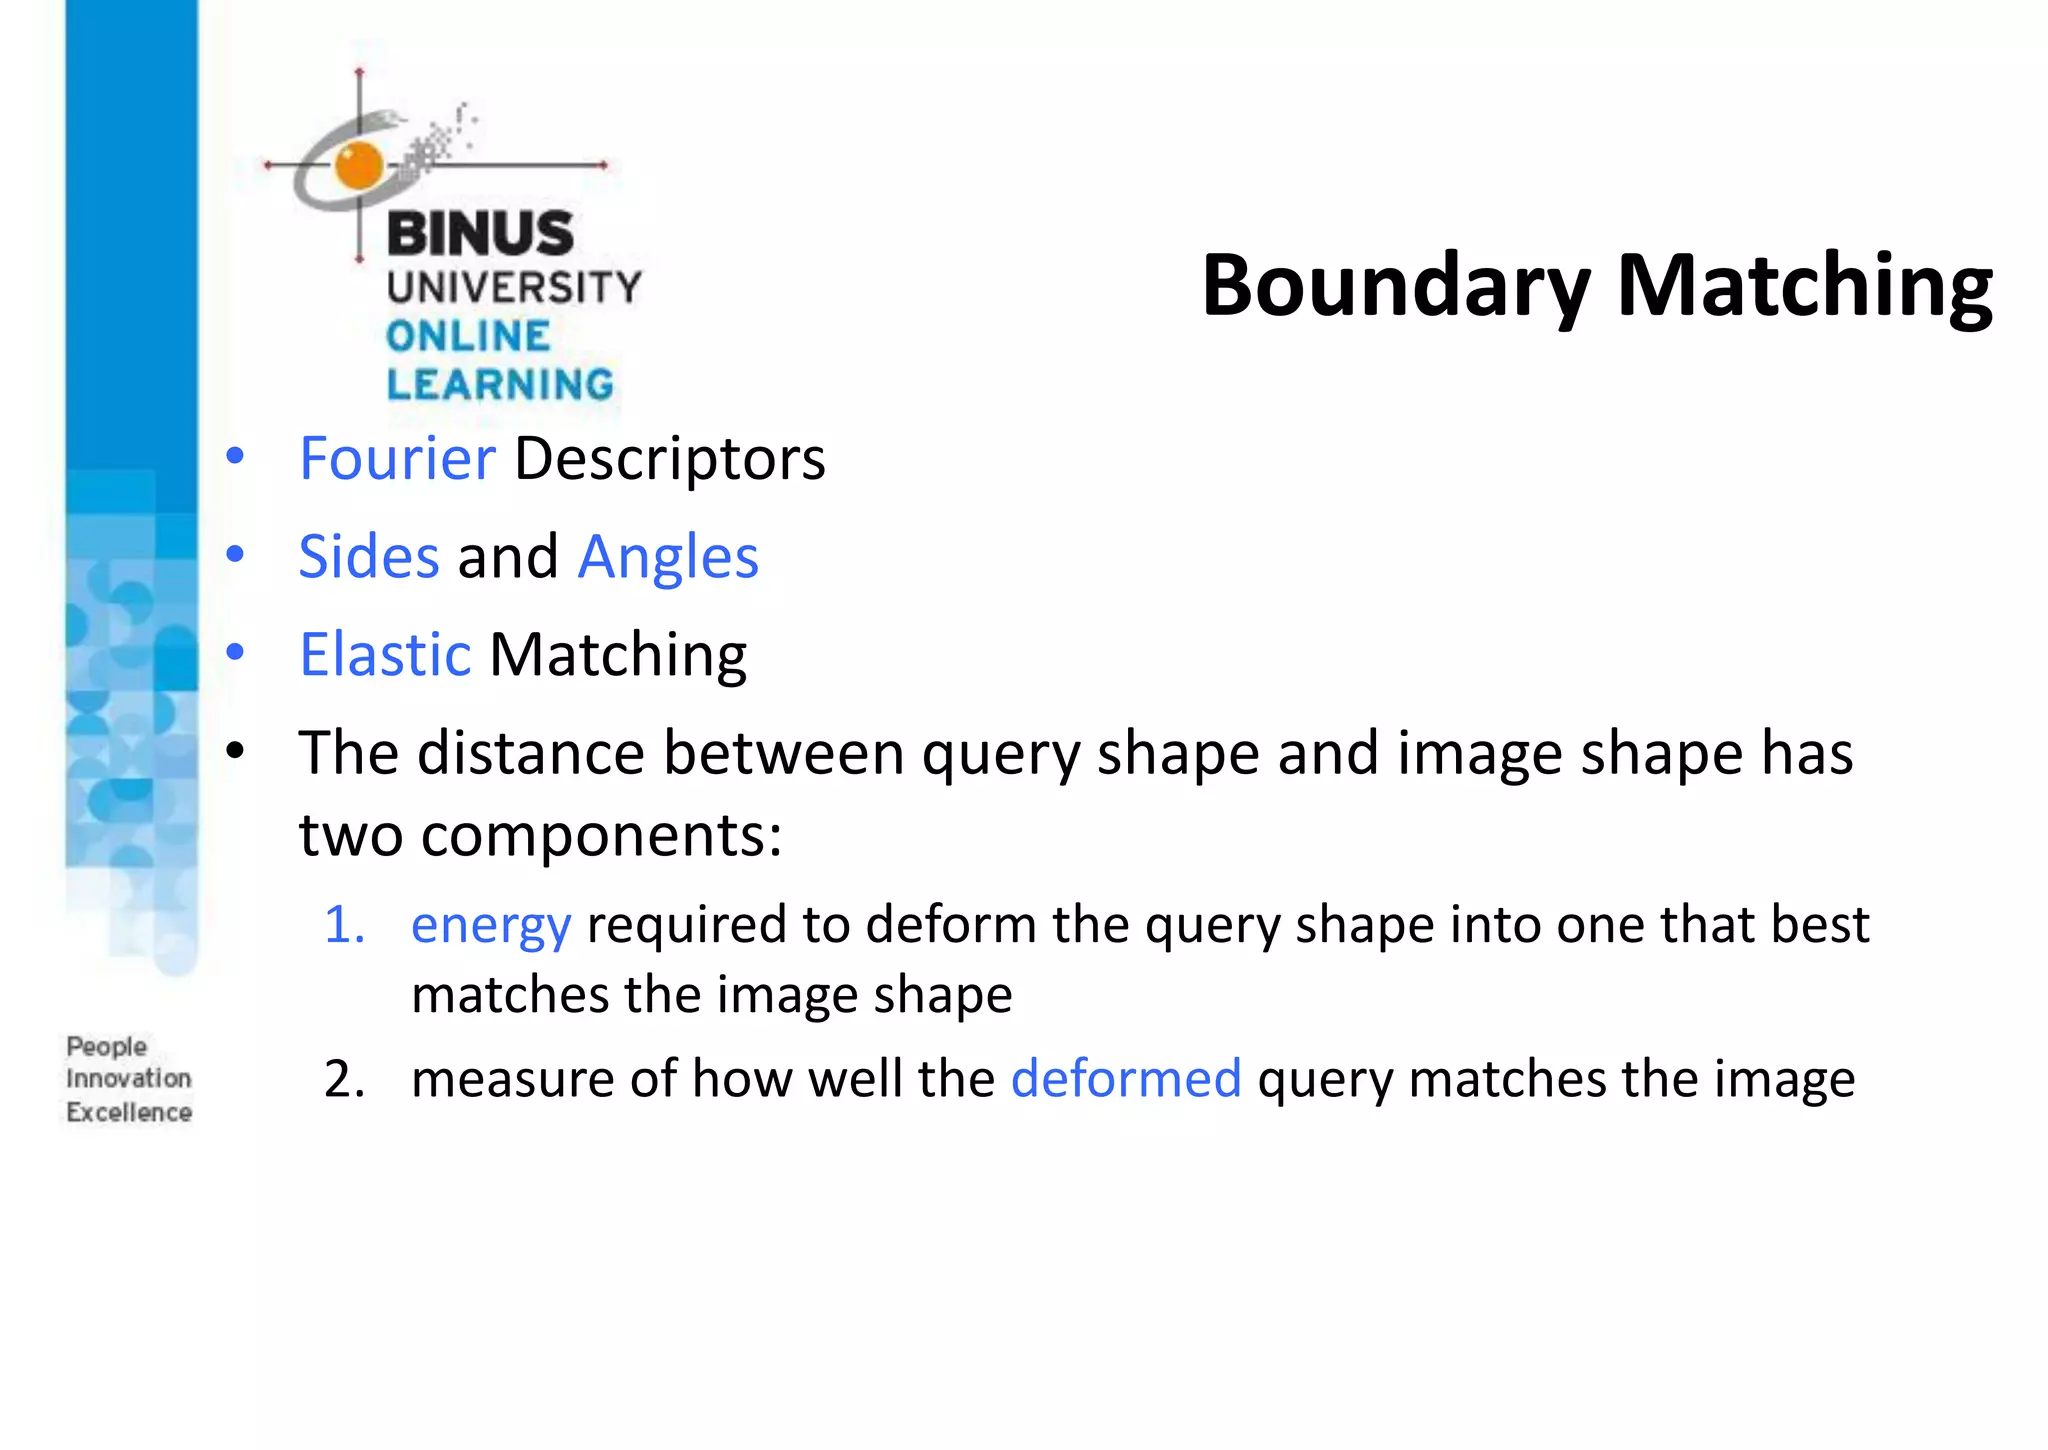
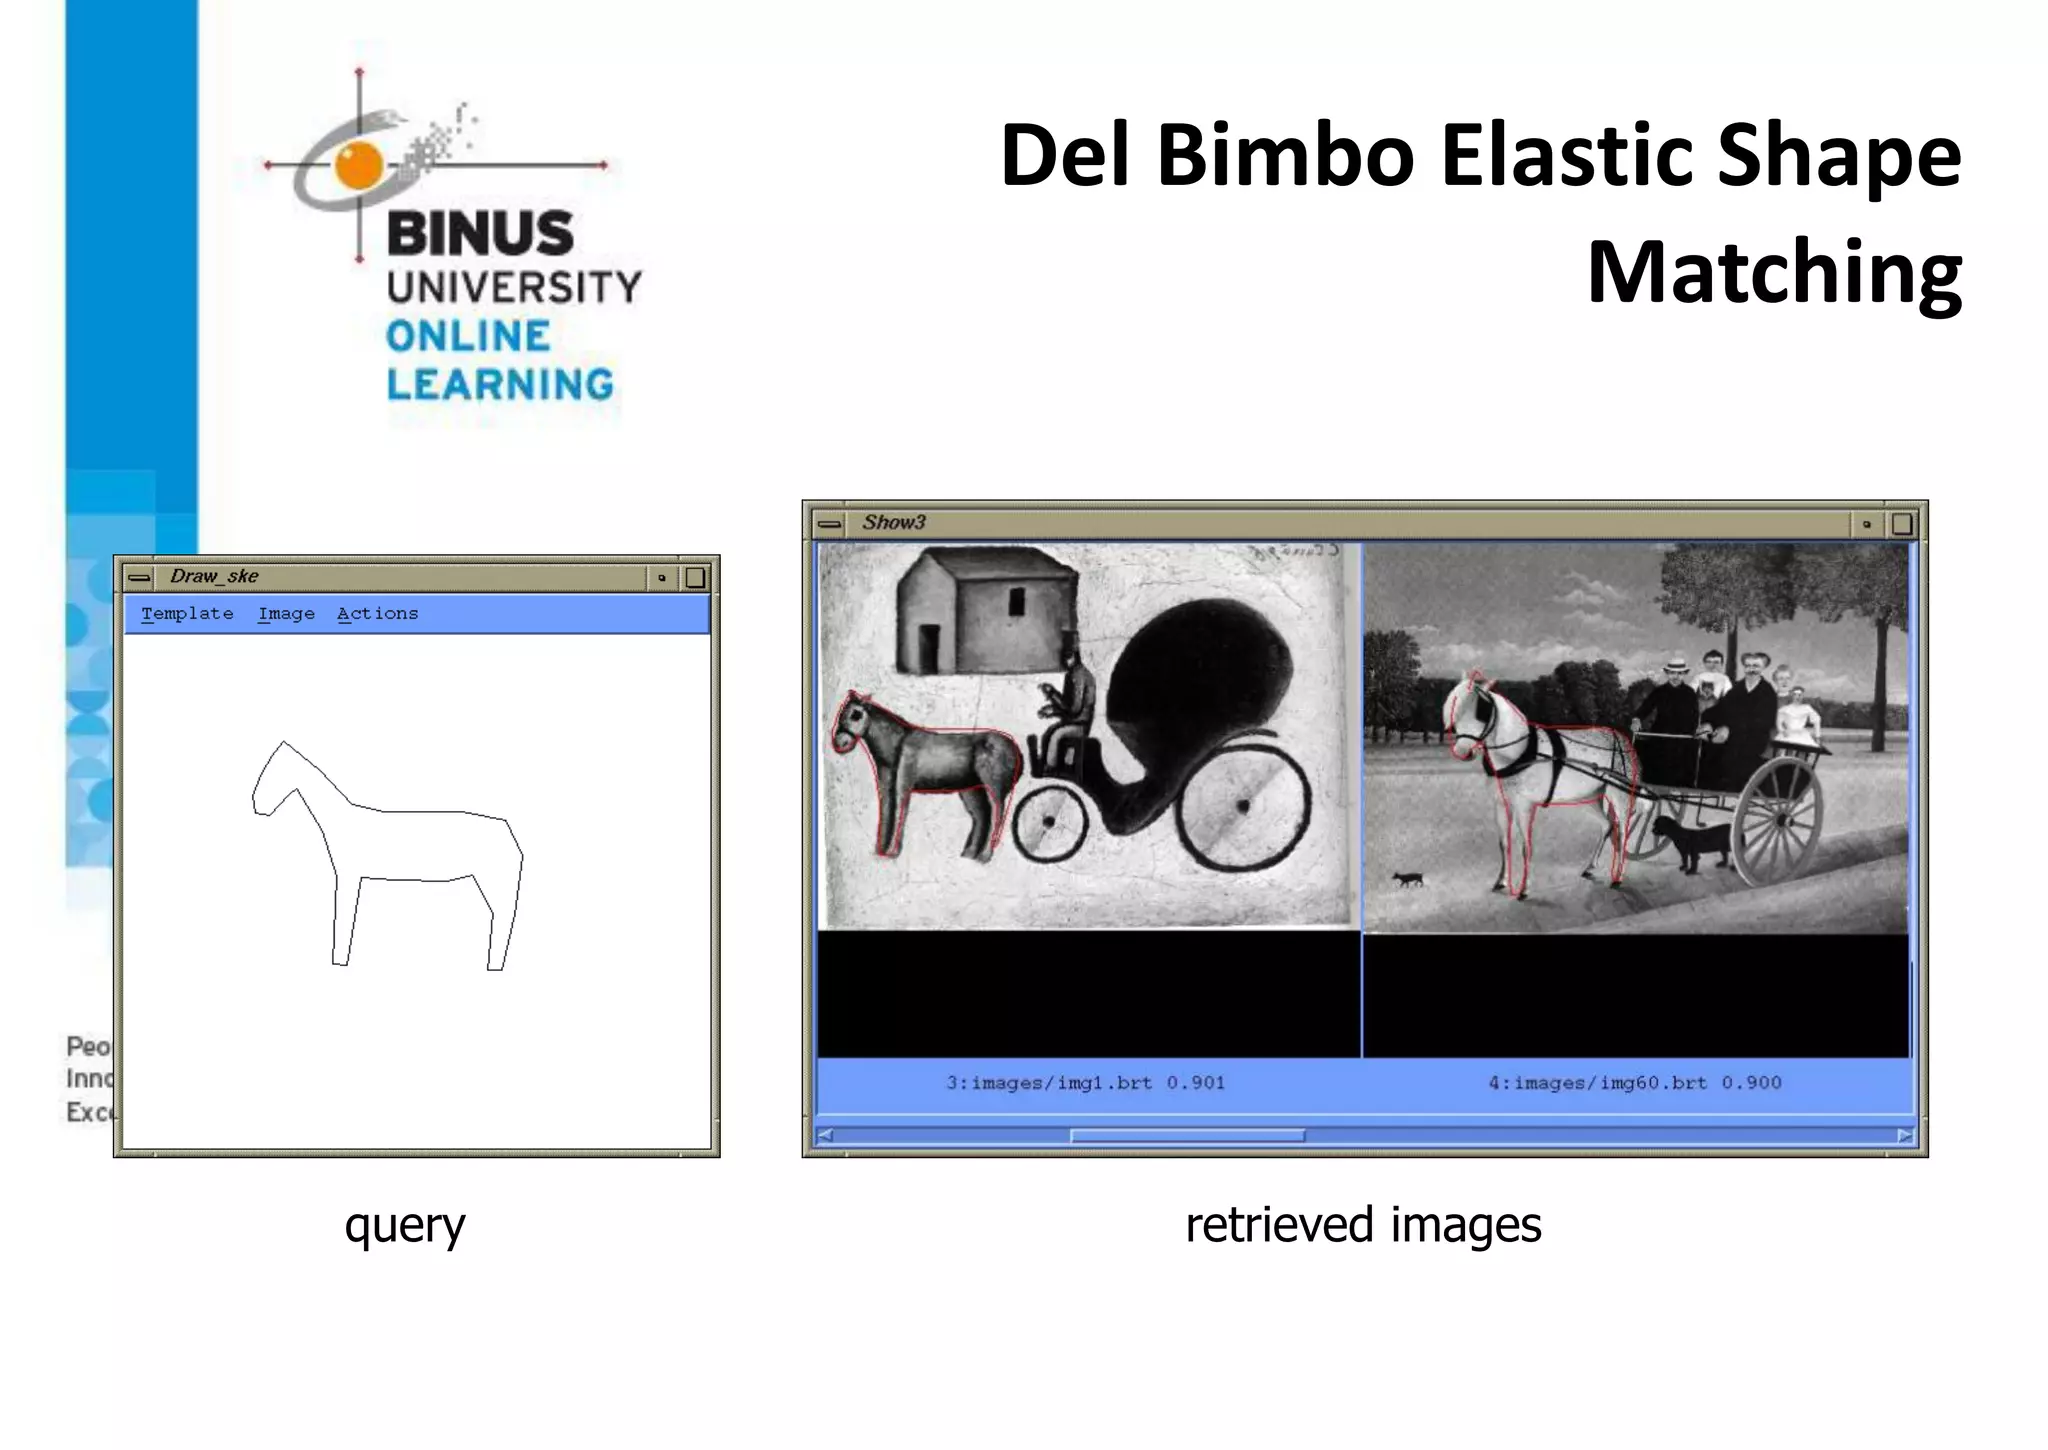
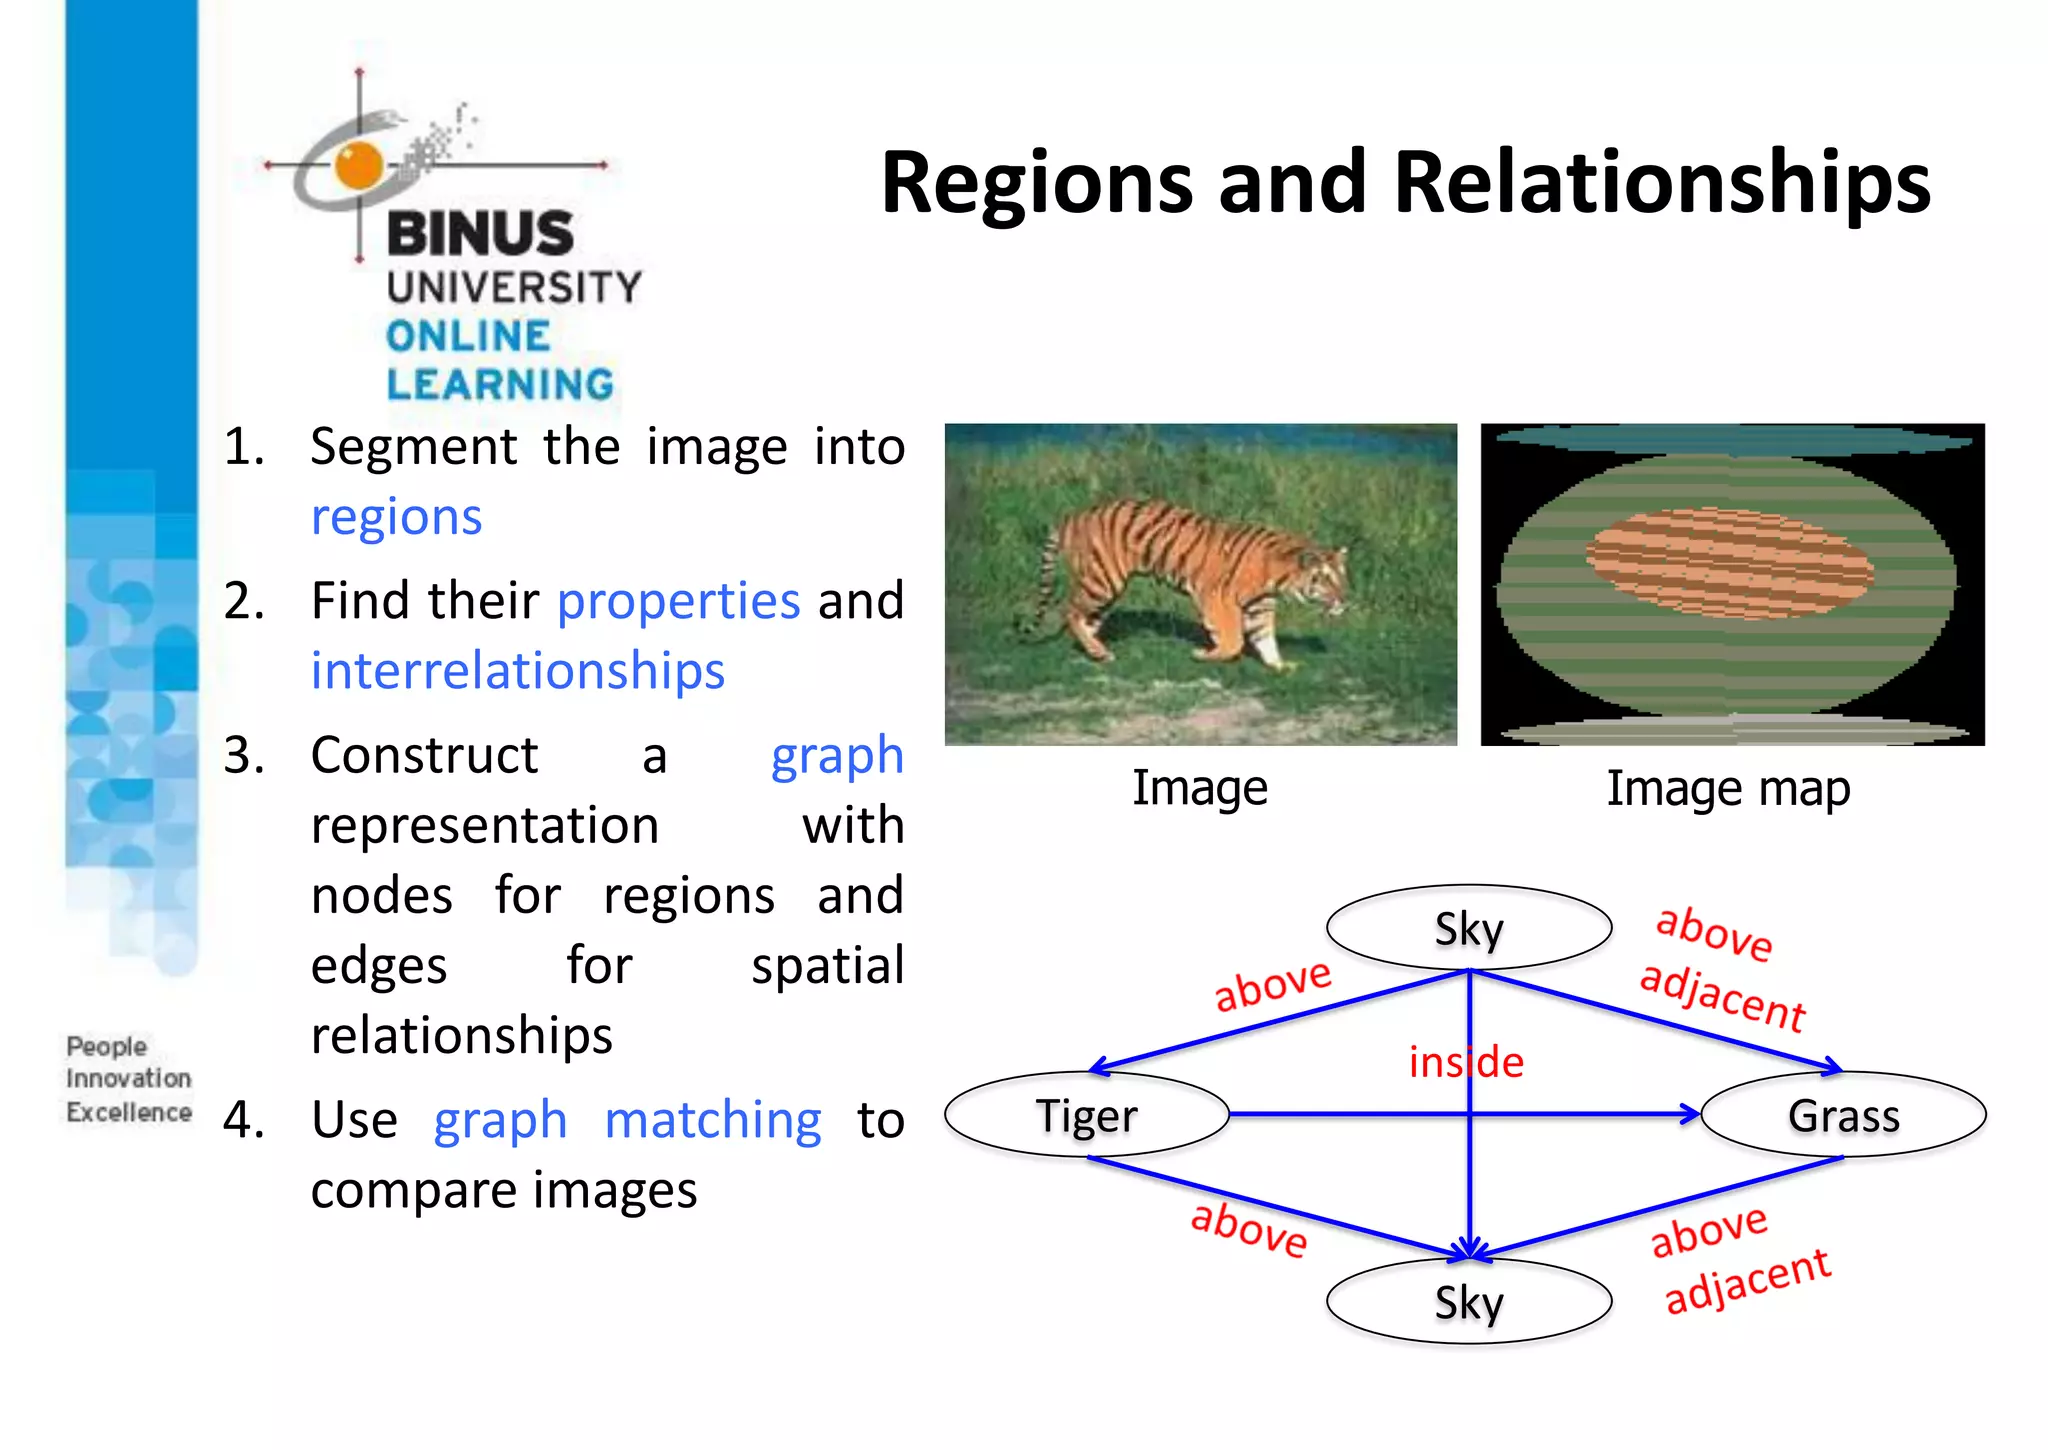
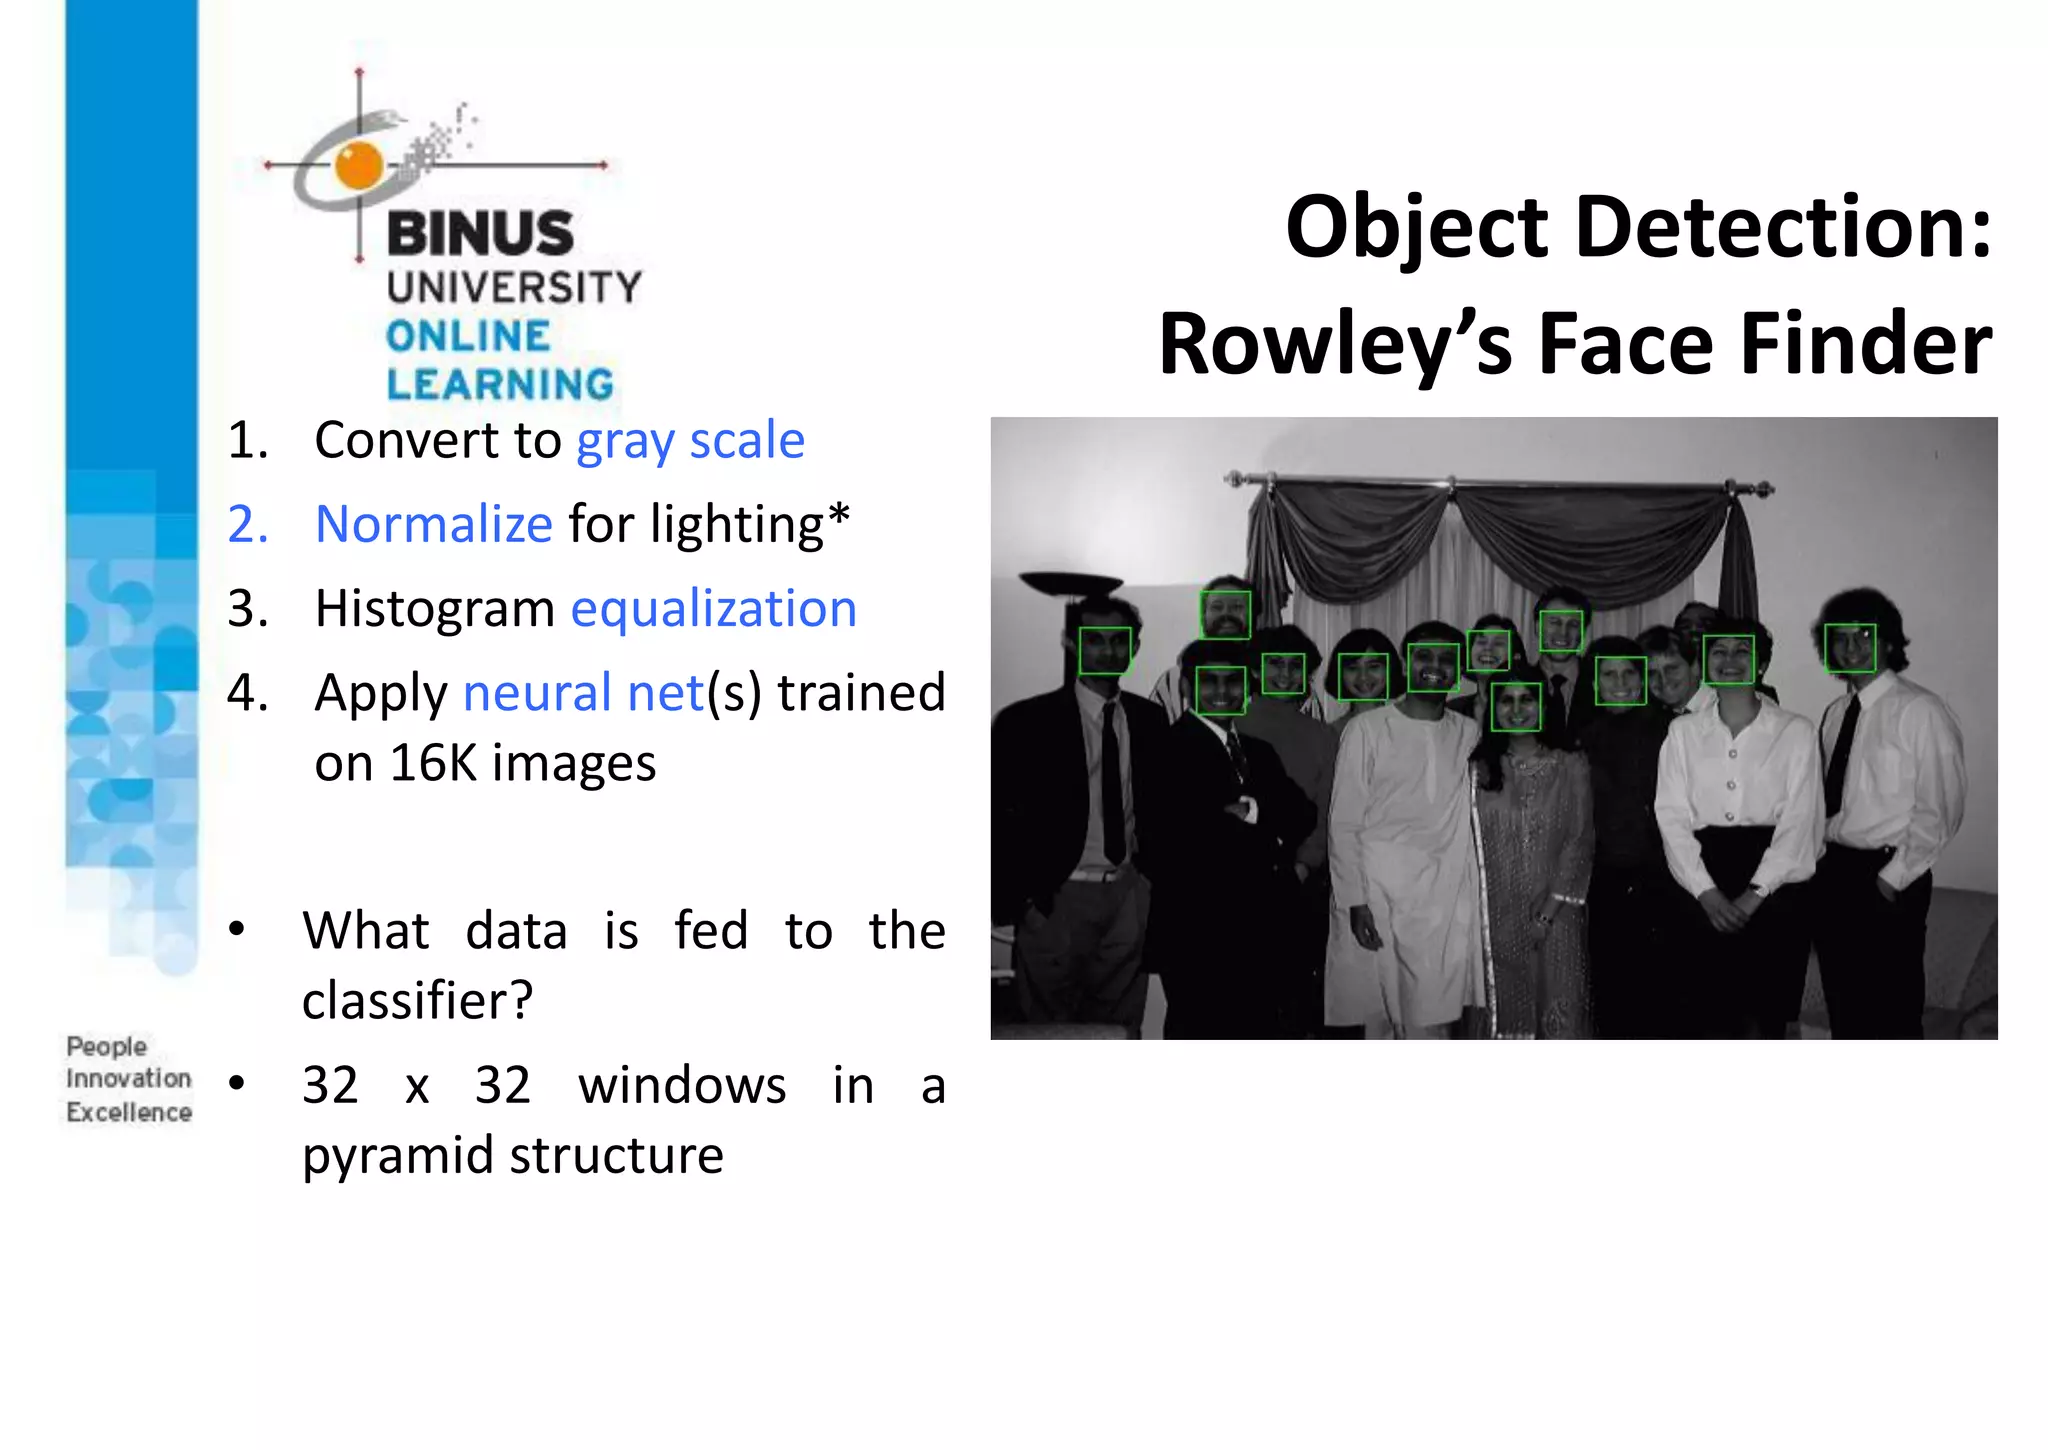
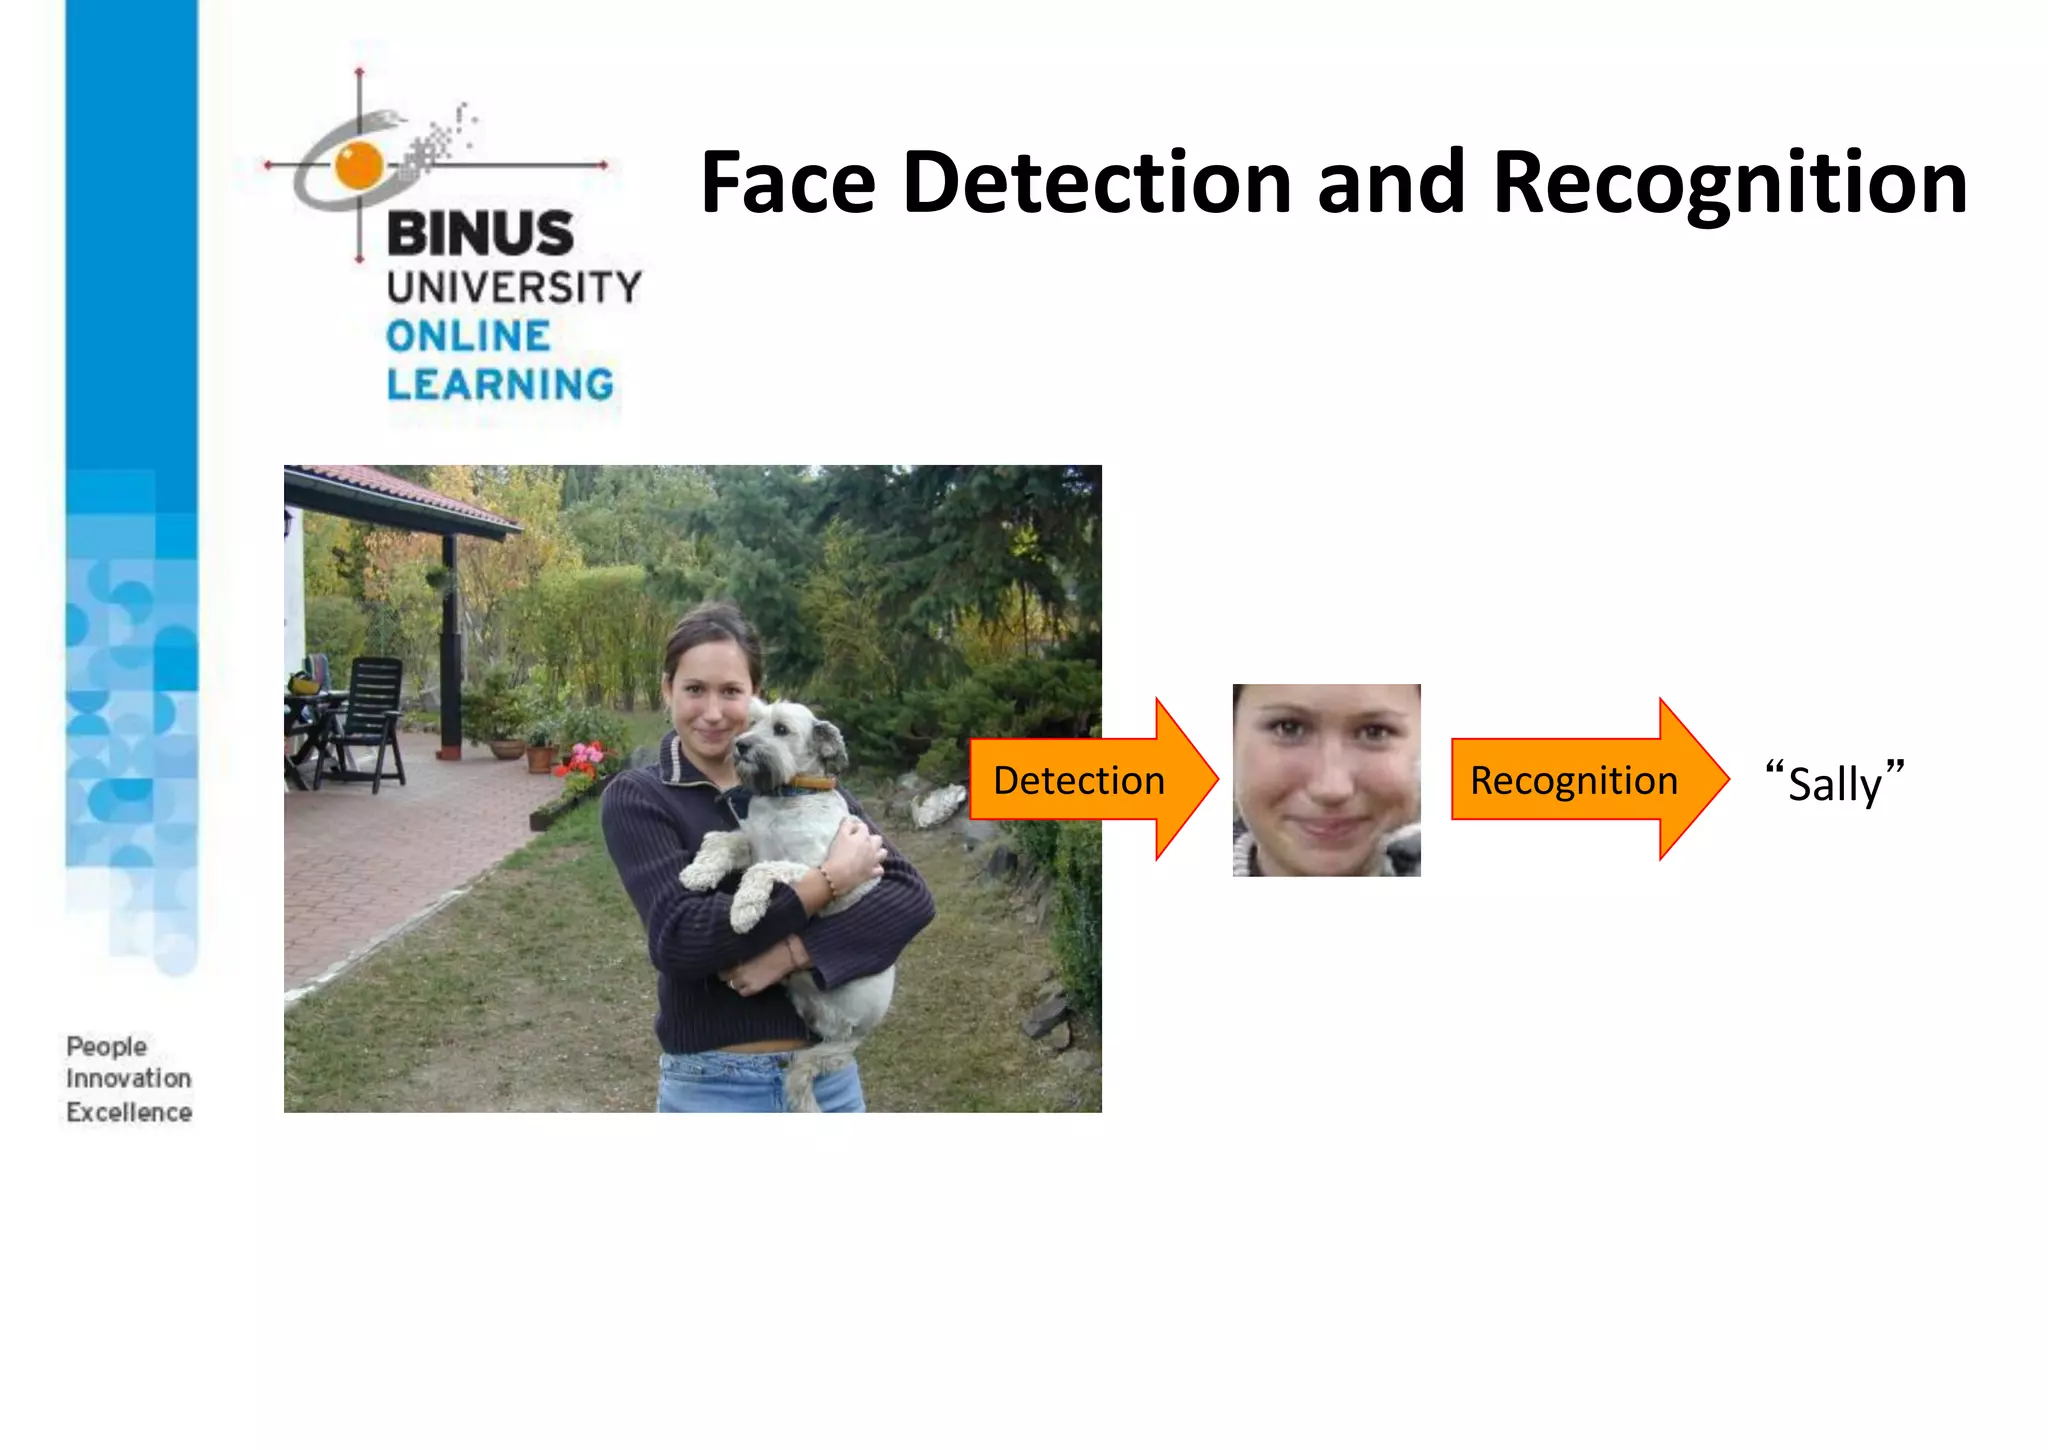
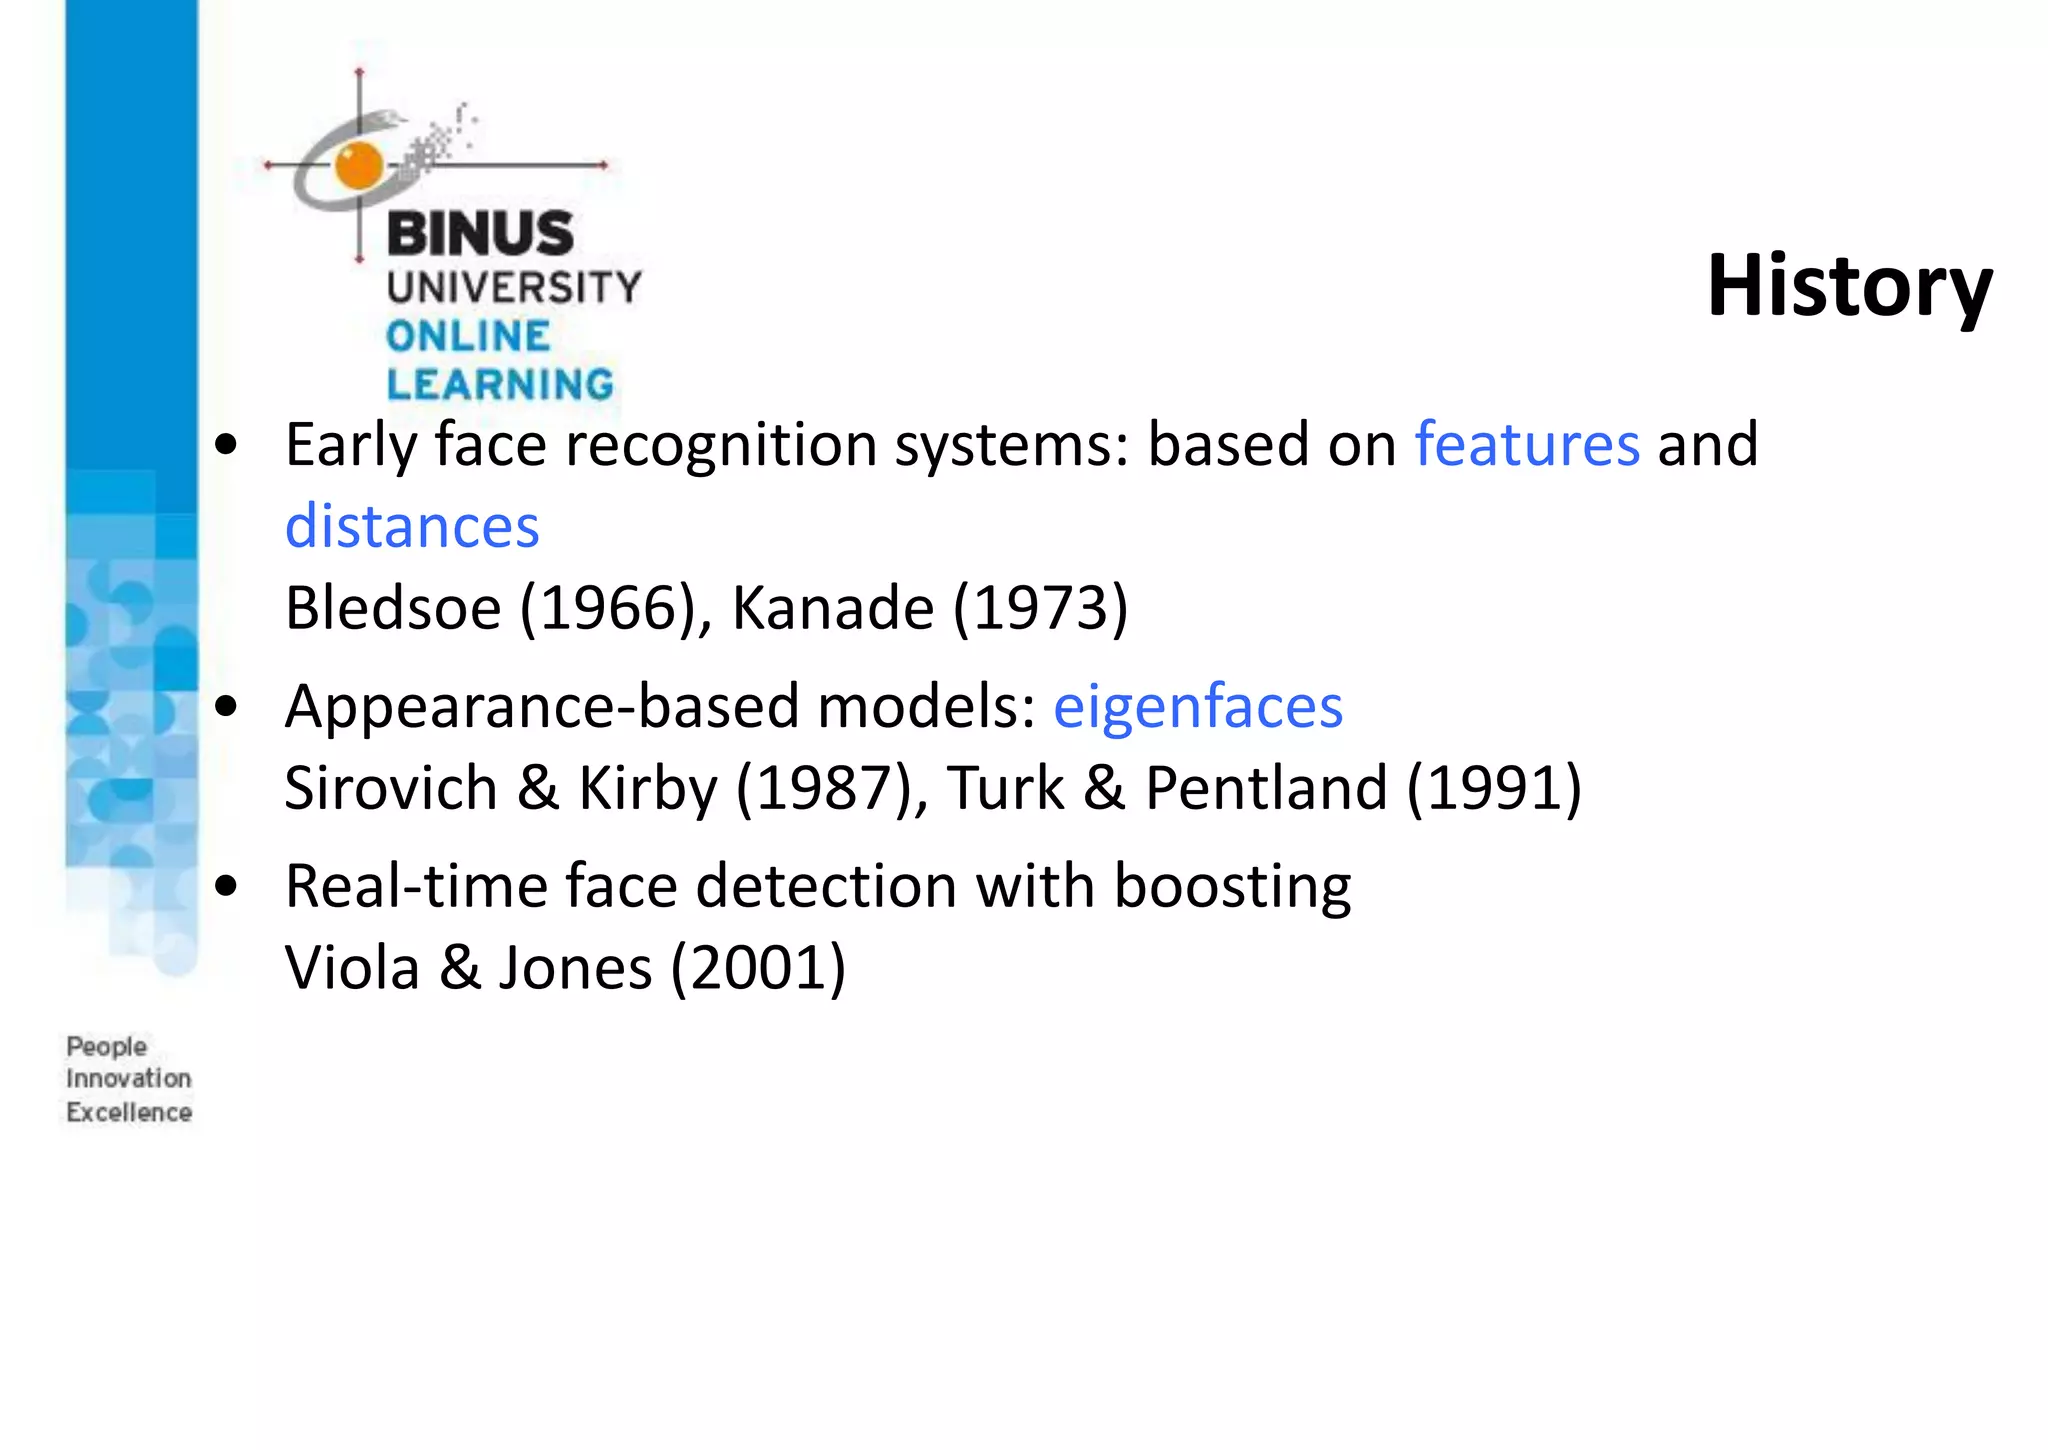
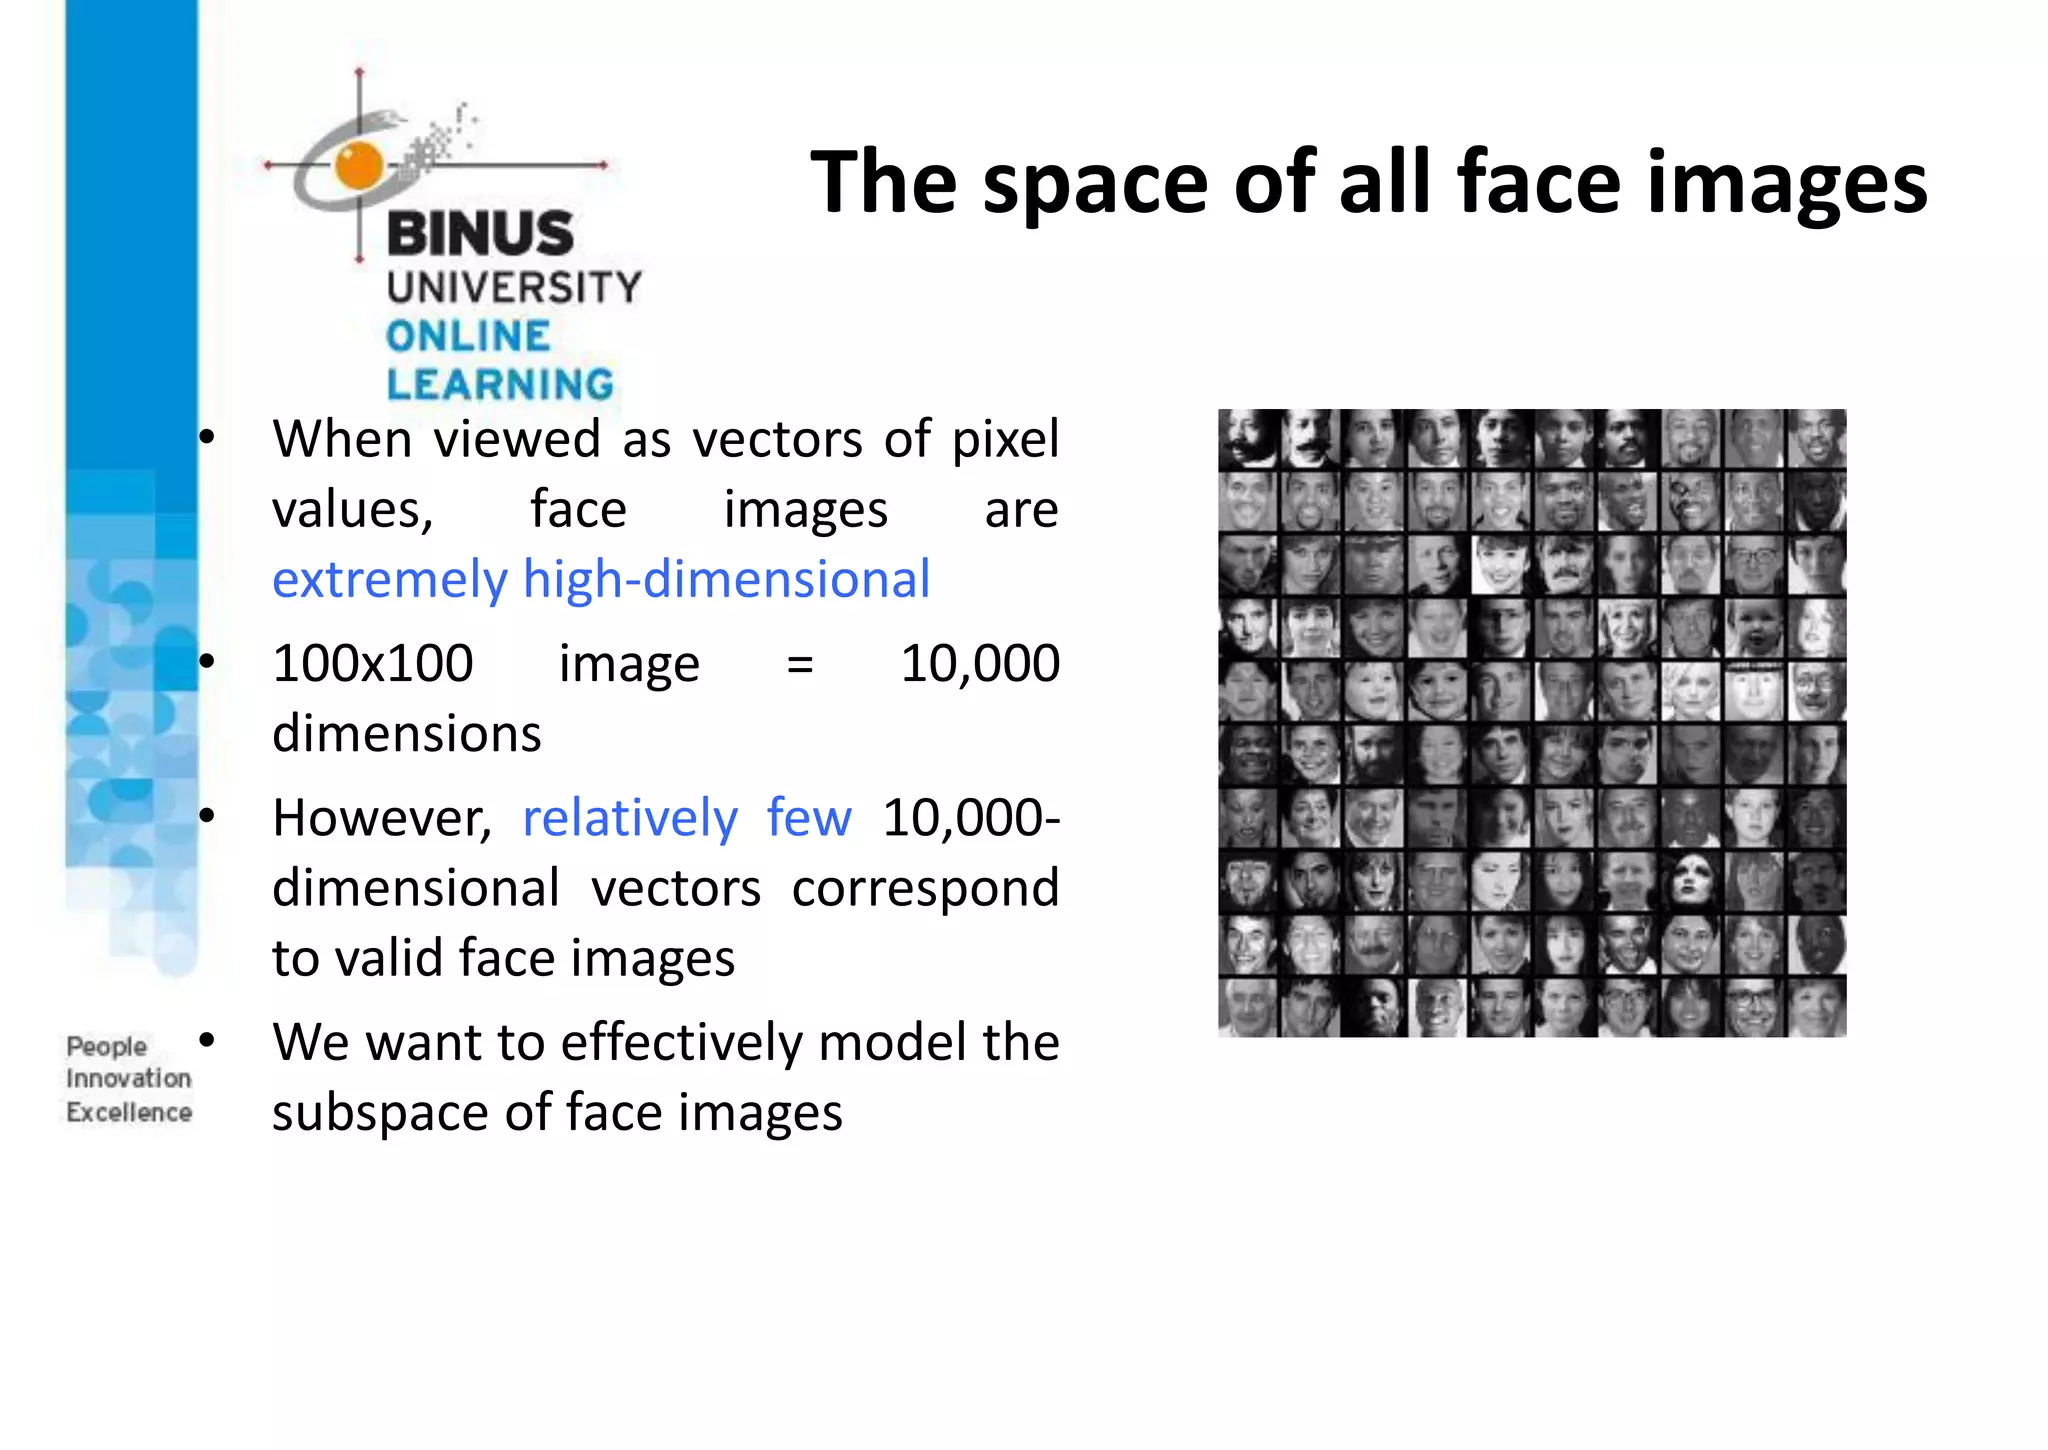
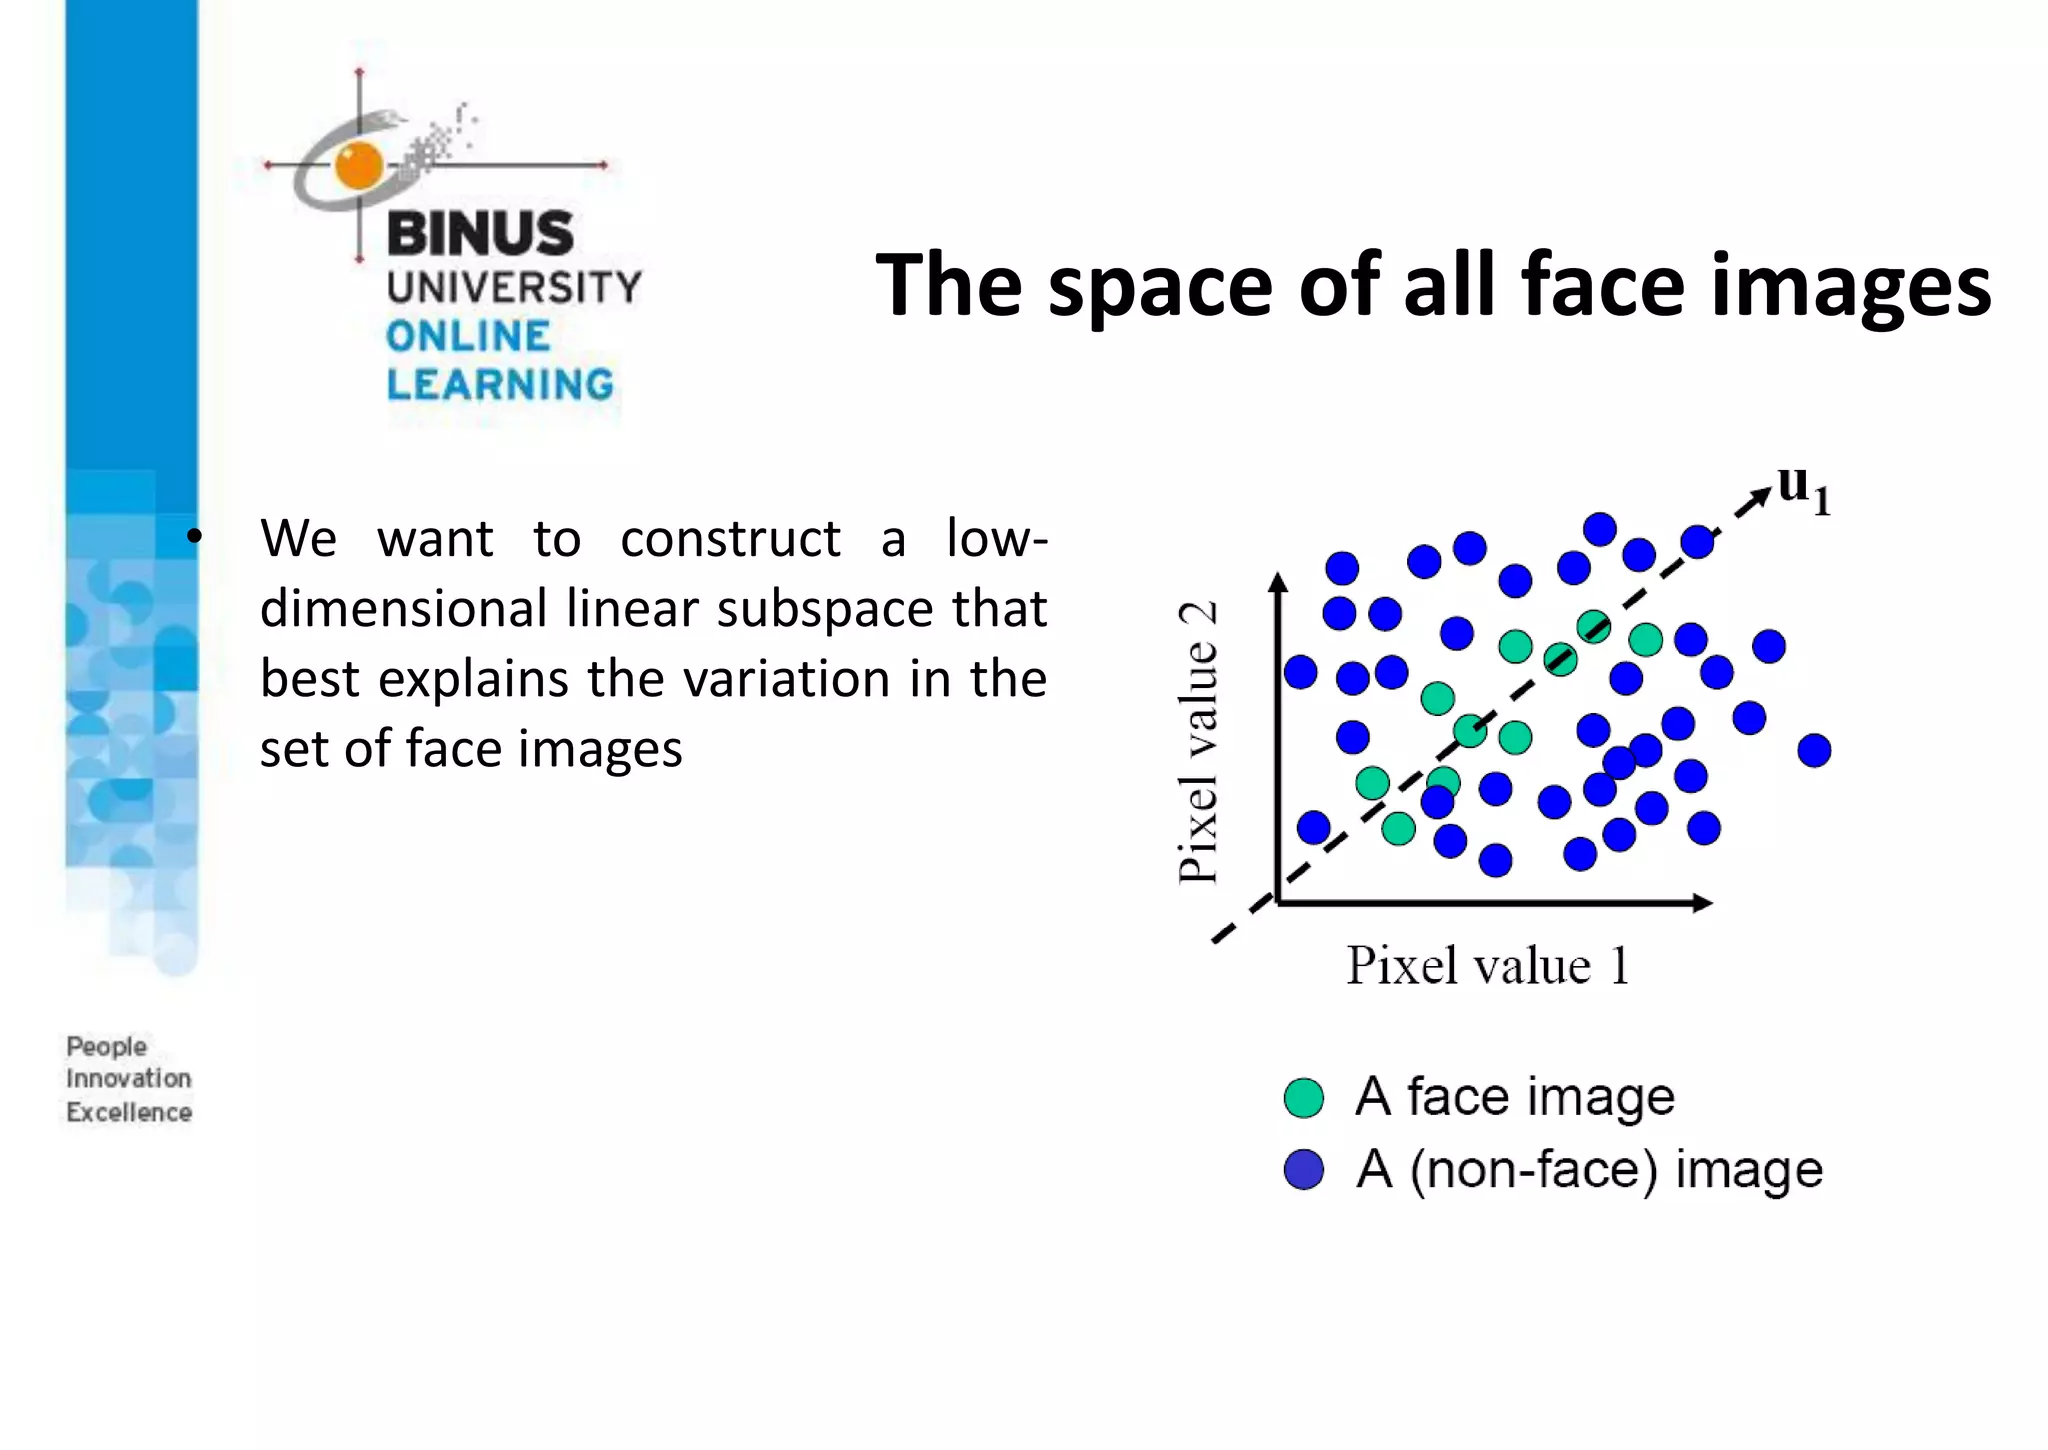
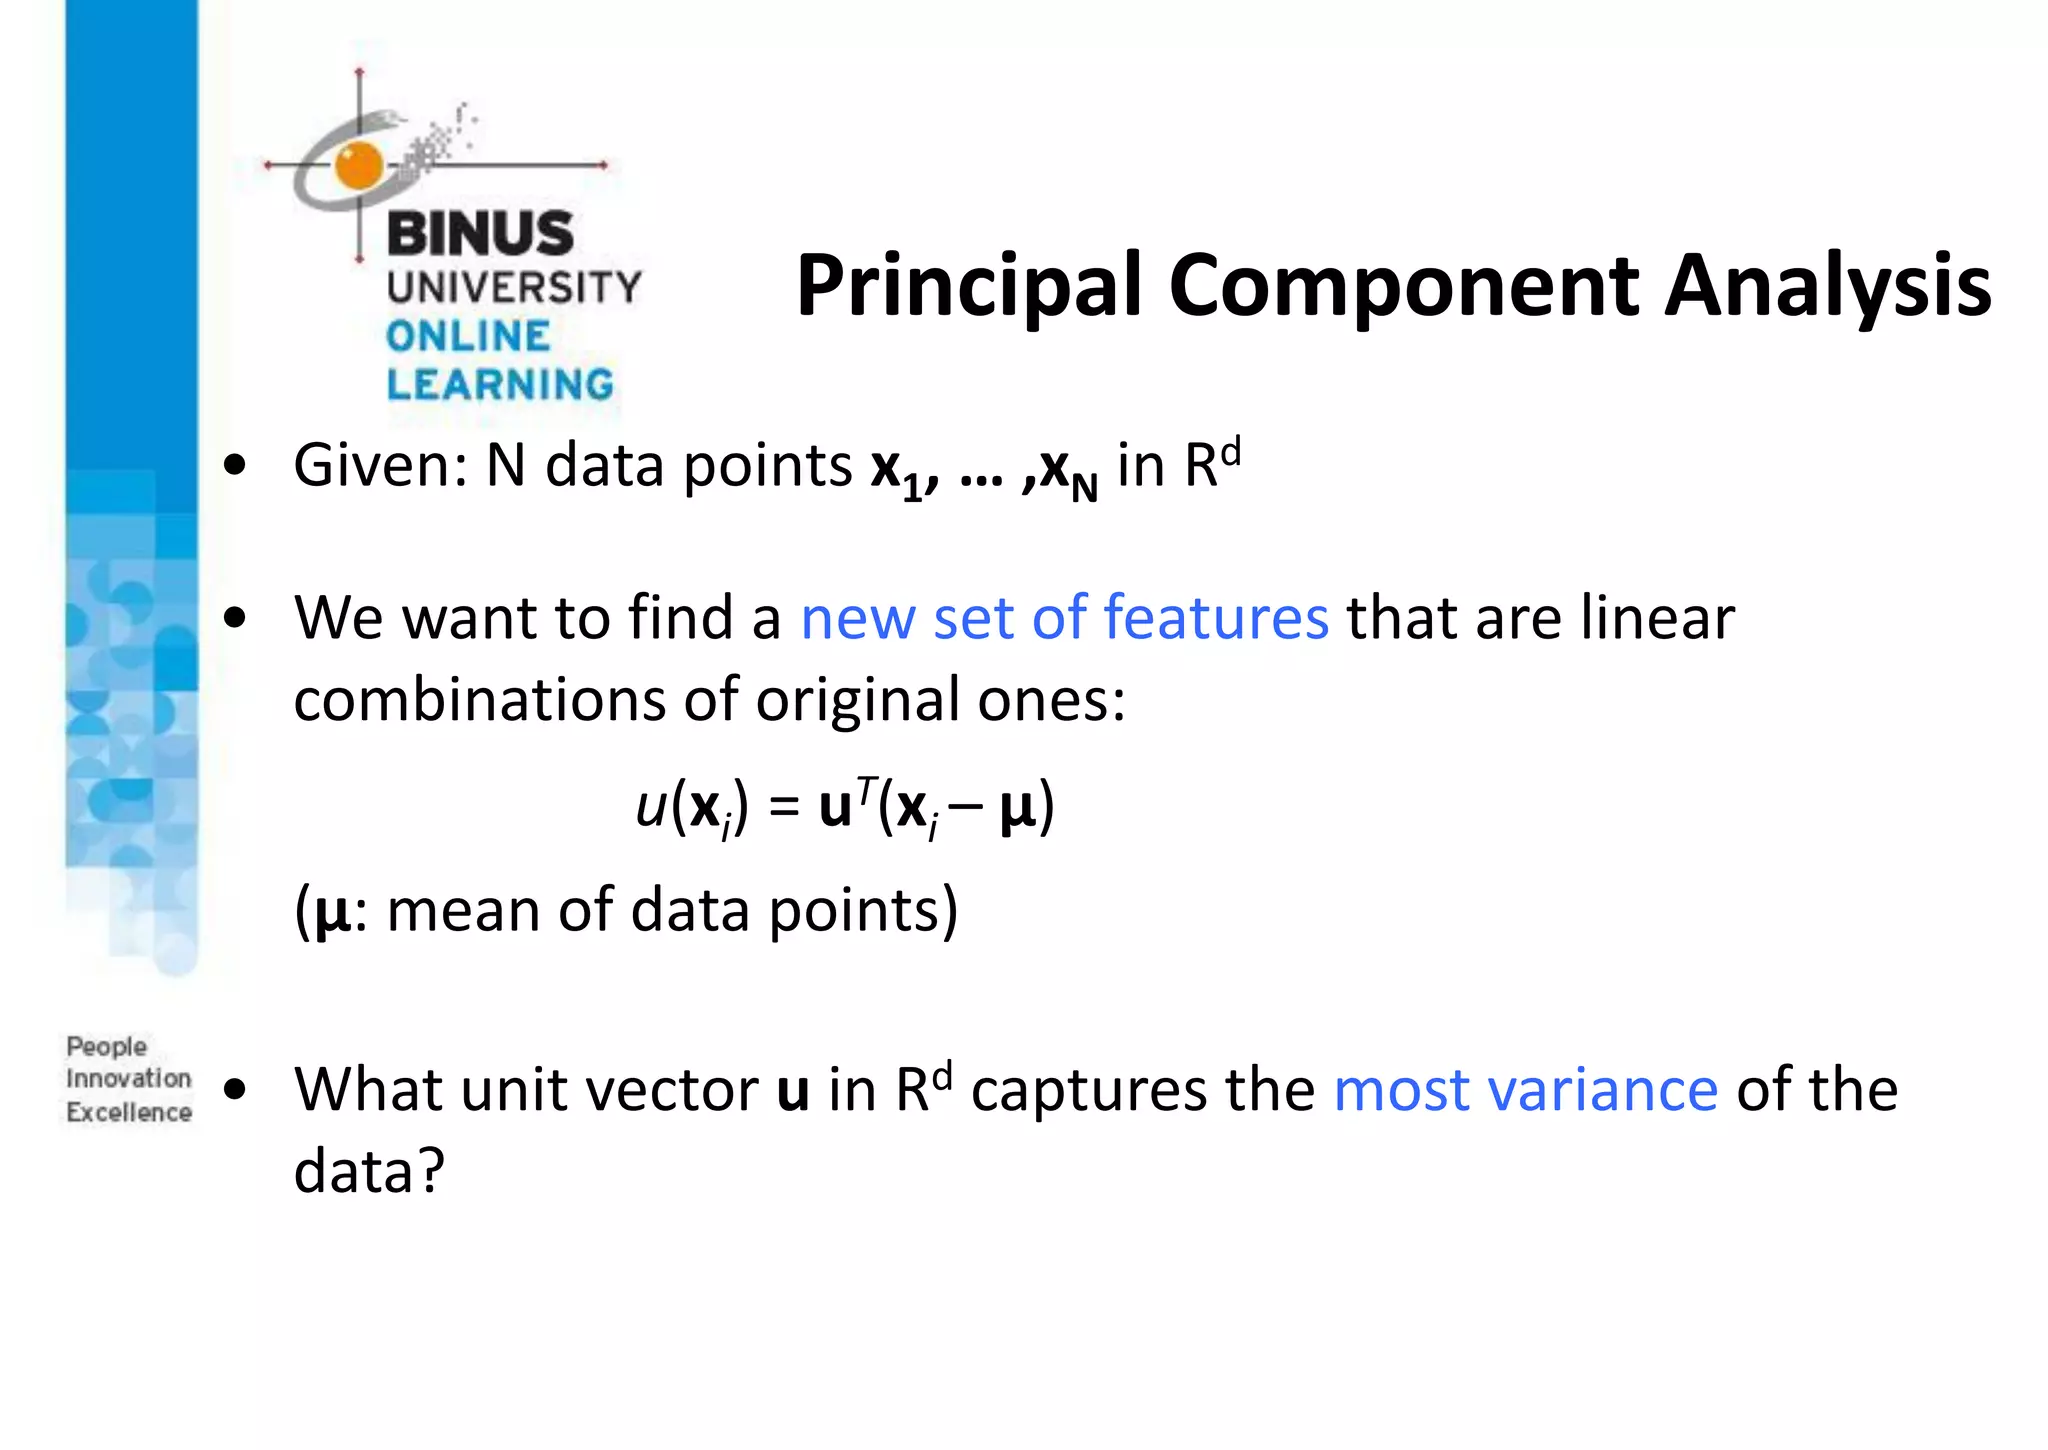
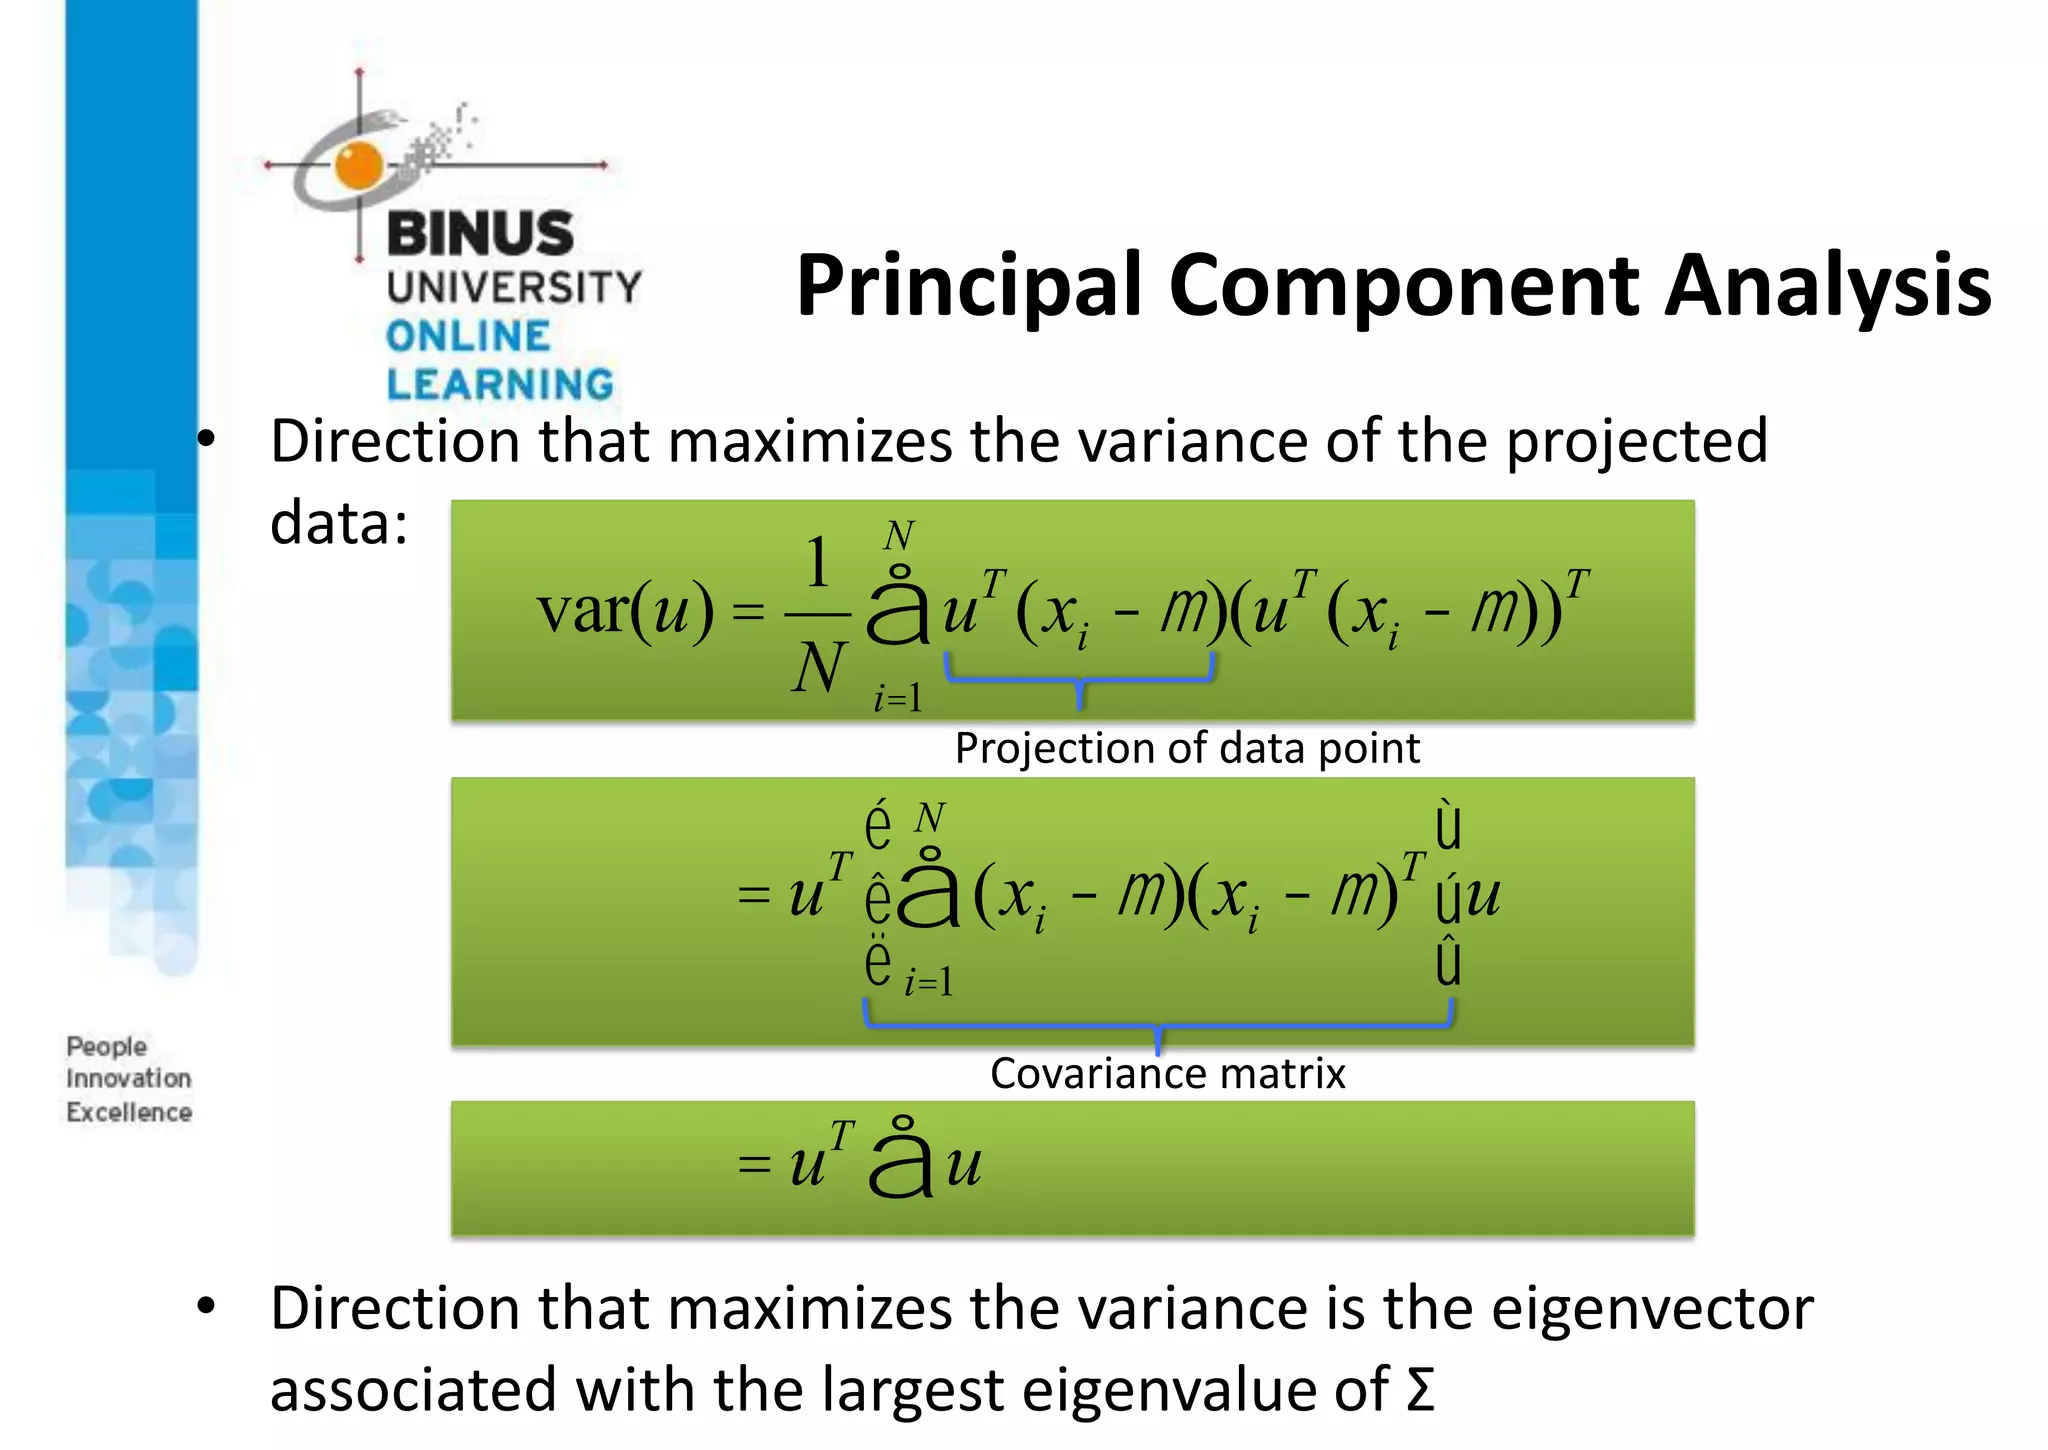
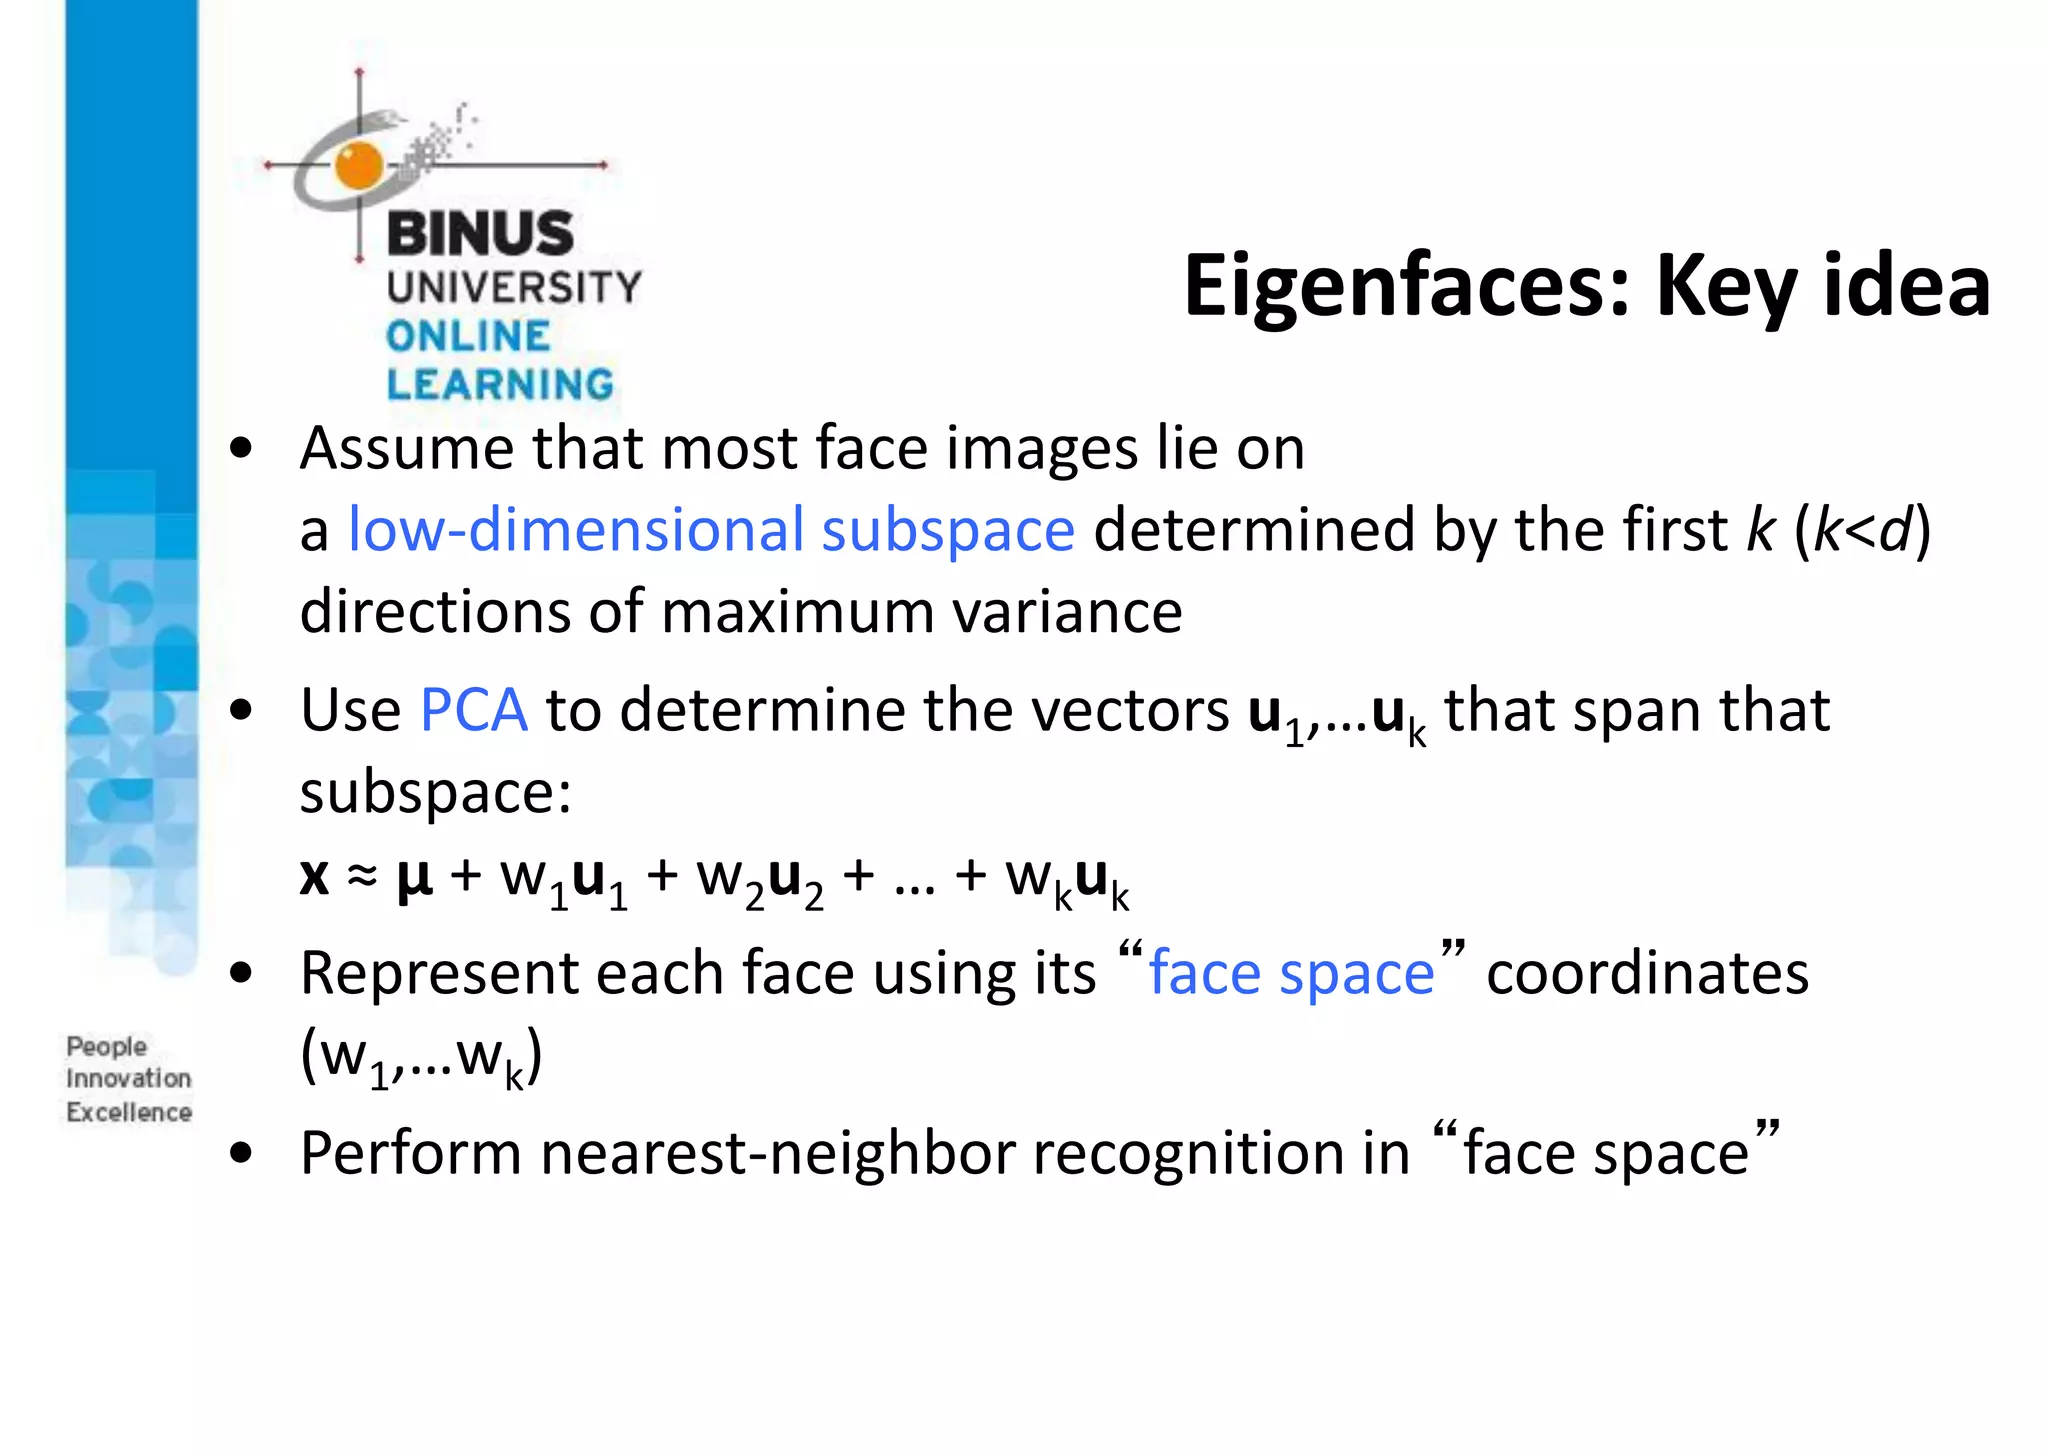
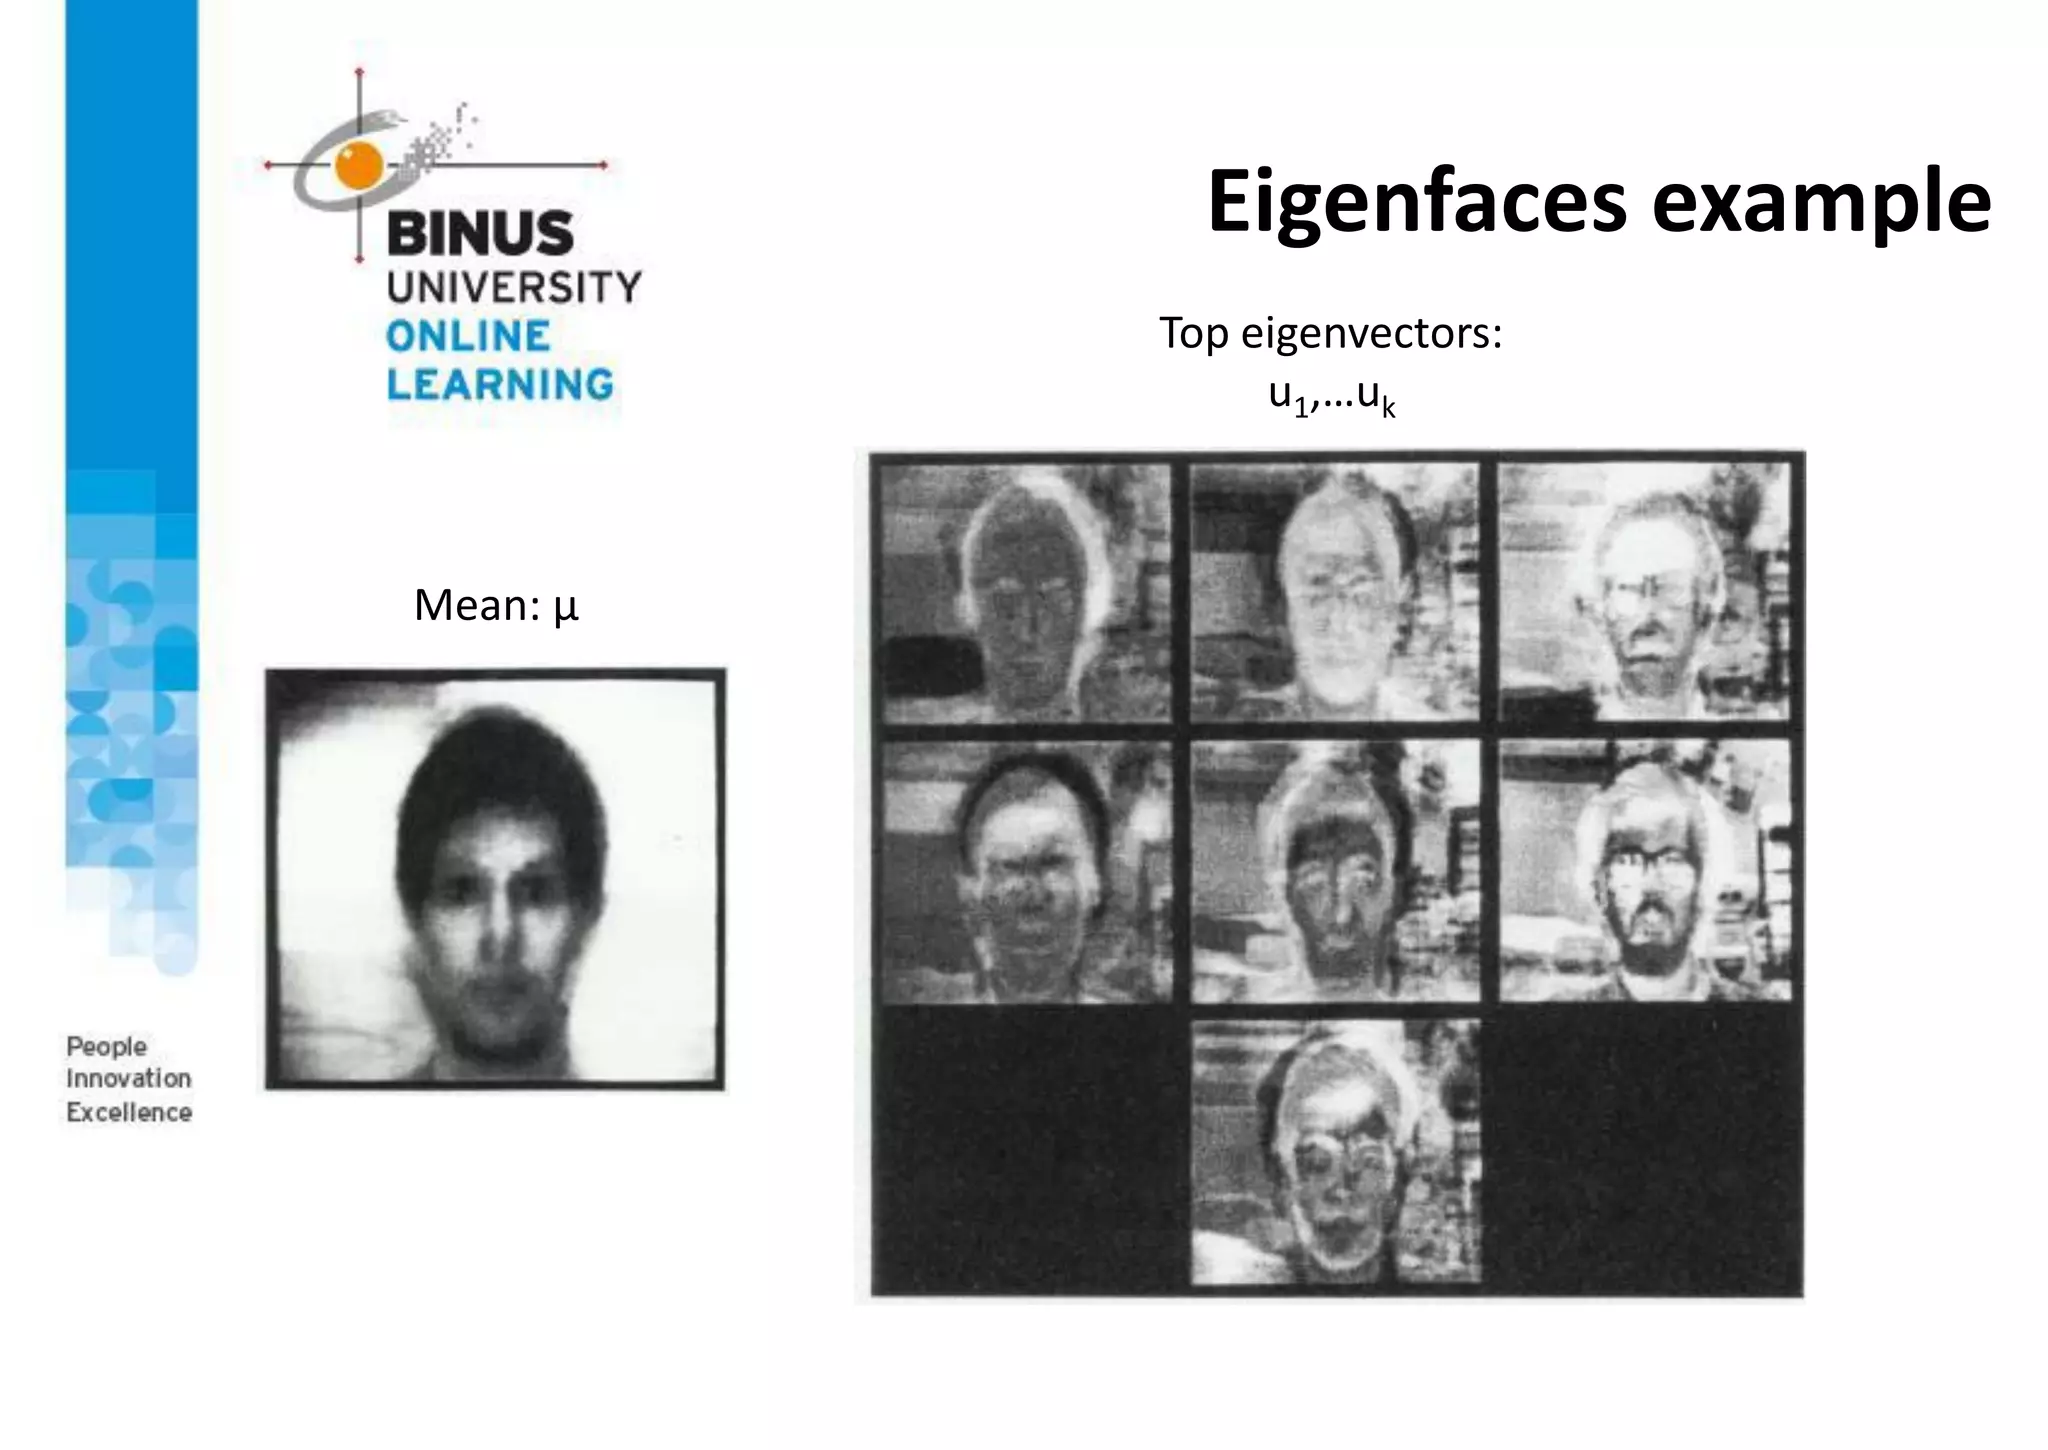
This document provides an overview of machine vision applications including content-based image retrieval and face recognition. It discusses how content-based image retrieval systems work by extracting image features, calculating distances between images, and returning similar images from a database based on a query image. Examples of content-based image retrieval systems and the features they use are described. The document also covers face detection and recognition techniques, including the use of eigenfaces which represent faces as locations in a lower-dimensional space.
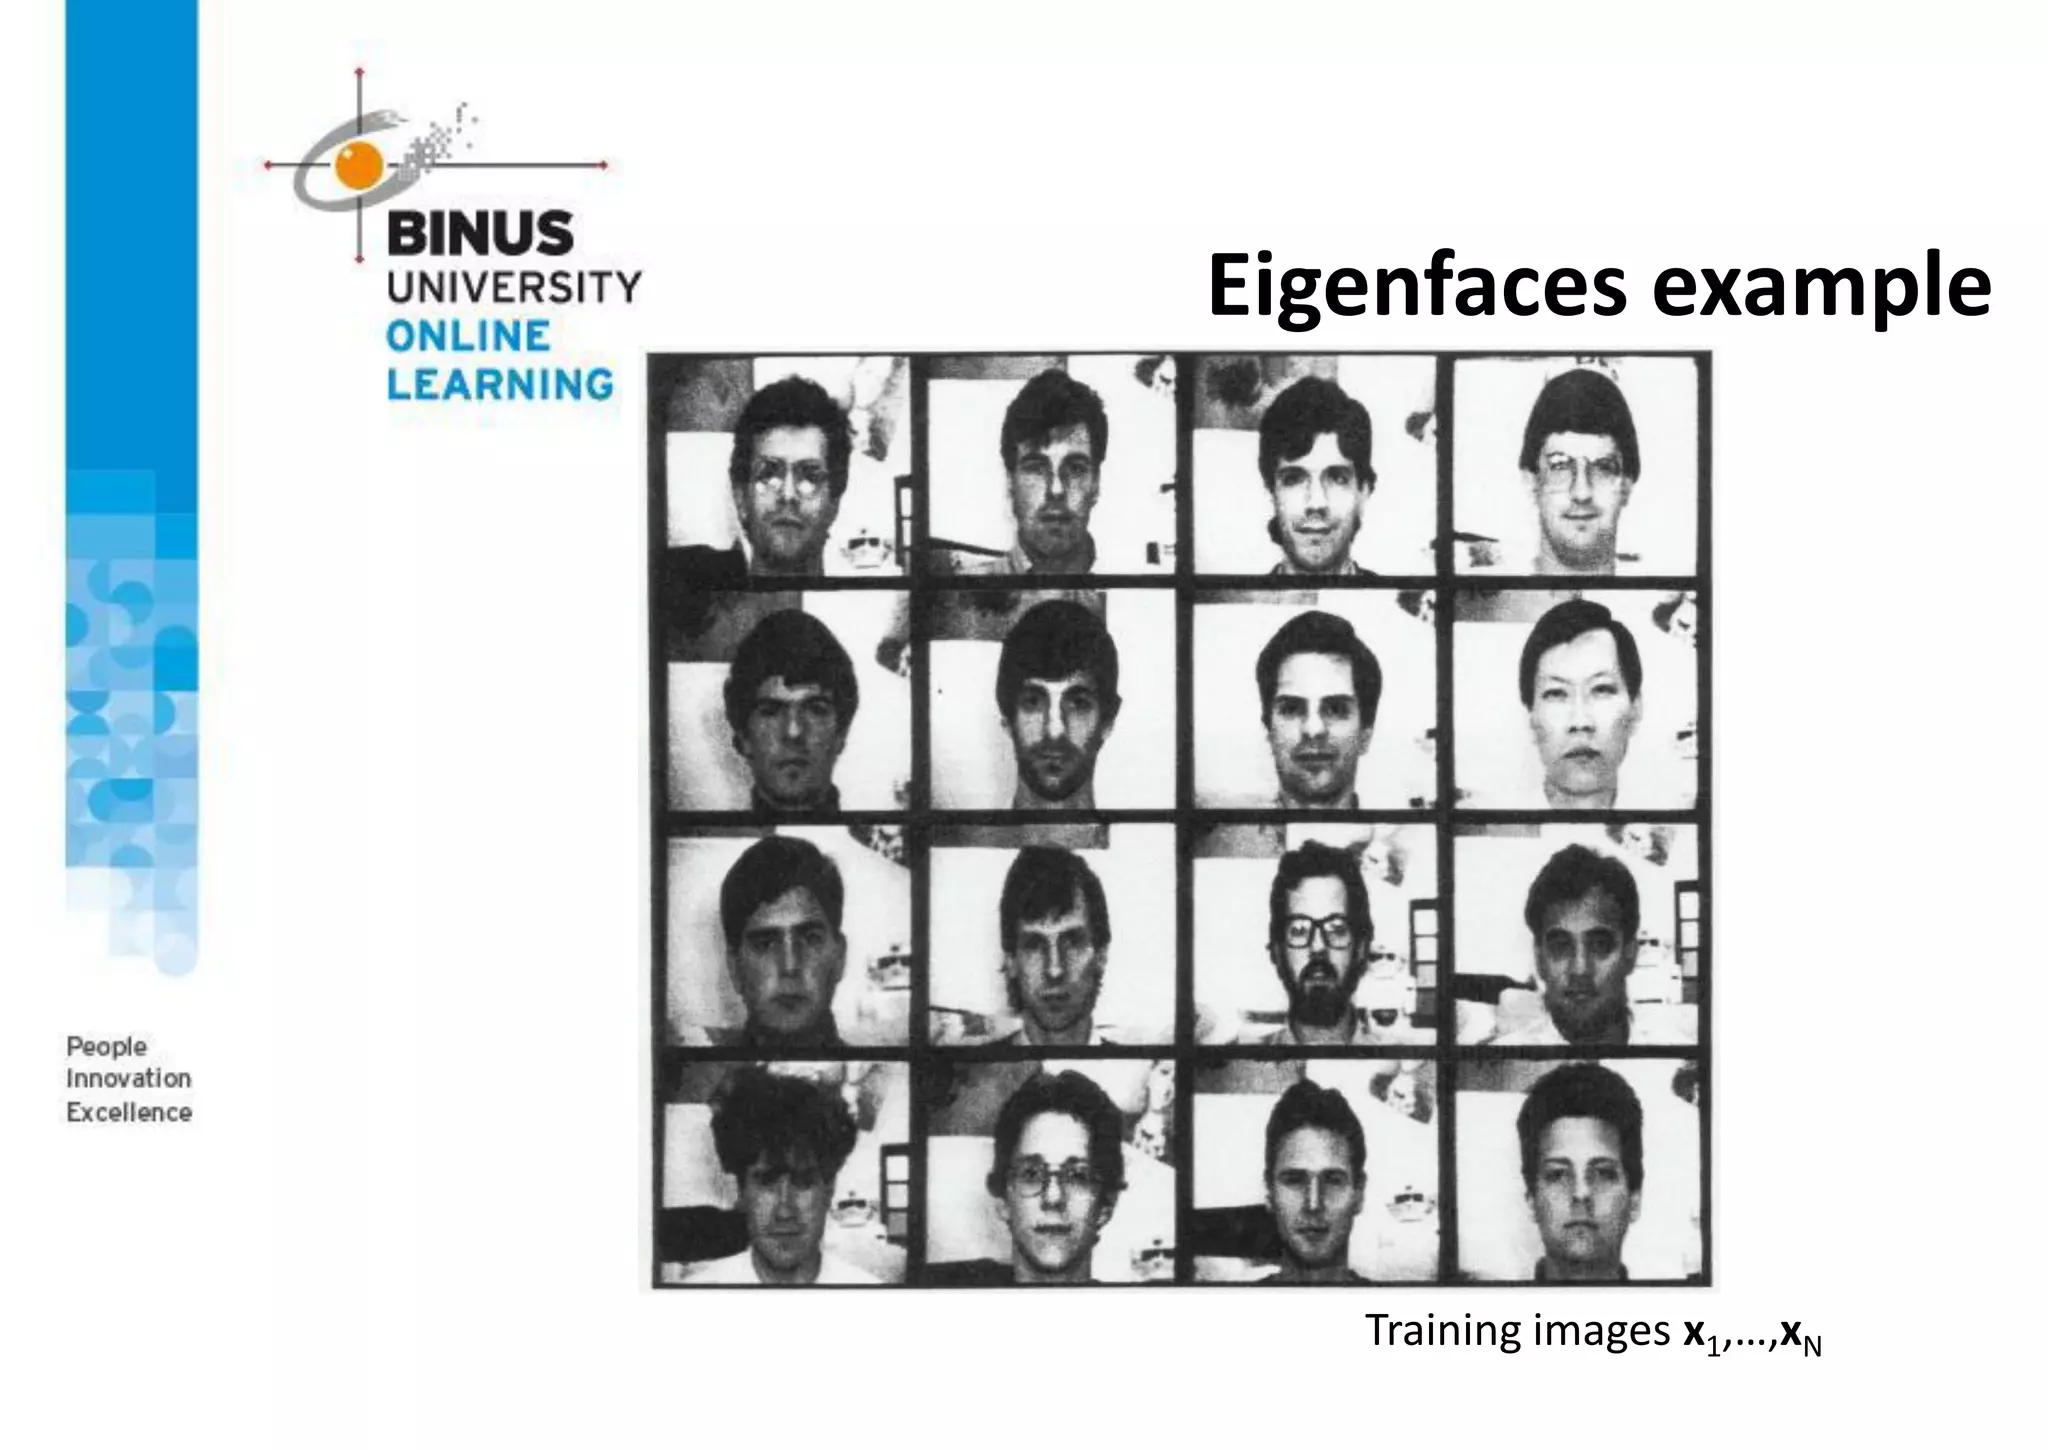
Image segmentation is an important image processing step, and it is used everywhere if we want to analyze what is inside the image. Image segmentation, basically provide the meaningful objects of the image.
Improvement of the Recognition Rate by Random ForestIJERA Editor
In this paper; we introduce a system of automatic recognition of characters based on the Random Forest Method in non-constrictive pictures that are stemmed from the terminals Mobile phone. After doing some pretreatments on the picture, the text is segmented into lines and then into characters. In the stage of characteristics extraction, we are representing the input data into the vector of primitives of the zoning types, of diagonal, horizontal and of the Zernike moment. These characteristics are linked to pixels’ densities and they are extracted on binary pictures. In the classification stage, we examine four classification methods with two different classifiers types namely the multi-layer perceptron (MLP) and the Random Forest method. After some checking tests, the system of learning and recognition which is based on the Random Forest has shown a good performance on a basis of 100 models of pictures
Improvement oh the recognition rate by random forestYoussef Rachidi
In this paper; we introduce a system of automatic recognition of characters based on the Random Forest Method in non-constrictive pictures that are stemmed from the terminals Mobile phone. After doing some pretreatments on the picture, the text is segmented into lines and then into characters. In the stage of characteristics extraction, we are representing the input data into the vector of primitives of the zoning types, of diagonal, horizontal and of the Zernike moment. These characteristics are linked to pixels’ densities and they are extracted on binary pictures. In the classification stage, we examine four classification methods with two different classifiers types namely the multi-layer perceptron (MLP) and the Random Forest method. After some checking tests, the system of learning and recognition which is based on the Random Forest has shown a good performance on a basis of 100 models of pictures.
Texture based feature extraction and object trackingPriyanka Goswami
The project involved developing and implementing different texture analysis based extraction techniques like Local Binary Pattern (LBP), Local Derivative Pattern (LDP) and Local Ternary Pattern (LTP) in MATLAB and carrying out a comparative study by analyzing the effectiveness of each technique using a standard set of images (Yale data set). The most optimum technique is then applied to identify cloud patterns and track their motion (in pixel position changes) in time series images (acquired from weather satellites like GOES) using the Chi-Square Difference method.
At the end of this lesson, you should be able to;
describe the energy and the EM spectrum.
describe image acquisition methods.
discuss image formation model.
express sampling and quantization.
define dynamic range and image representation.
At the end of this lesson, you should be able to;
describe Connected Components and Contours in image segmentation.
discuss region based segmentation method.
discuss Region Growing segmentation technique.
discuss Morphological Watersheds segmentation.
discuss Model Based Segmentation.
discuss Motion Segmentation.
implement connected components, flood fill, watershed, template matching and frame difference techniques.
formulate possible mechanisms to propose segmentation methods to solve problems.
Evolving a Medical Image Similarity SearchSujit Pal
Slides for talk at Haystack Conference 2018. Covers evolution of an Image Similarity Search Proof of Concept built to identify similar medical images. Discusses various image vectorizing techniques that were considered in order to convert images into searchable entities, an evaluation strategy to rank these techniques, as well as various indexing strategies to allow searching for similar images at scale.
Content Based Image Retrieval (CBIR) is one of the
most active in the current research field of multimedia retrieval.
It retrieves the images from the large databases based on images
feature like color, texture and shape. In this paper, Image
retrieval based on multi feature fusion is achieved by color and
texture features as well as the similarity measures are
investigated. The work of color feature extraction is obtained by
using Quadratic Distance and texture features by using Pyramid
Structure Wavelet Transforms and Gray level co-occurrence
matrix. We are comparing all these methods for best image
retrieval
Image Segmentation from RGBD Images by 3D Point Cloud Attributes and High-Lev...CSCJournals
In this paper, an approach is developed for segmenting an image into major surfaces and potential objects using RGBD images and 3D point cloud data retrieved from a Kinect sensor. In the proposed segmentation algorithm, depth and RGB data are mapped together. Color, texture, XYZ world coordinates, and normal-, surface-, and graph-based segmentation index features are then generated for each pixel point. These attributes are used to cluster similar points together and segment the image. The inclusion of new depth-related features provided improved segmentation performance over RGB-only algorithms by resolving illumination and occlusion problems that cannot be handled using graph-based segmentation algorithms, as well as accurately identifying pixels associated with the main structure components of rooms (walls, ceilings, floors). Since each segment is a potential object or structure, the output of this algorithm is intended to be used for object recognition. The algorithm has been tested on commercial building images and results show the usability of the algorithm in real time applications.
ODSC India 2018: Topological space creation & Clustering at BigData scaleKuldeep Jiwani
Every data has an inherent natural geometry associated with it. We are generally influenced by how the world visually appears to us and apply the same flat Euclidean geometry to data. The data geometry could be curved, may have holes, distances cannot be defined in all cases. But if we still impose Euclidean geometry on it, then we may be distorting the data space and also destroying the information content inside it.
In the space of BigData world we have to regularly handle TBs of data and extract meaningful information from it. We have to apply many Unsupervised Machine Learning techniques to extract such information from the data. Two important steps in this process is building a topological space that captures the natural geometry of the data and then clustering in that topological space to obtain meaningful clusters.
This talk will walk through "Data Geometry" discovery techniques, first analytically and then via applied Machine learning methods. So that the listeners can take back, hands on techniques of discovering the real geometry of the data. The attendees will be presented with various BigData techniques along with showcasing Apache Spark code on how to build data geometry over massive data lakes.
Used a neural network trained on the multi labelled image set to extract regions in the query image. A label probability of each region is then computed to create an intermediate feature vector. A weighted average of these vectors is then computed to generate multiple labels. This representation is then hashed for fast retrieval.
2017 Spring, UCF Medical Image Computing
CAVA: Computer Aided Visualization and Analysis
• CAD: Computer Aided Diagnosis
• Definitions and Terminologies
• Coordinate Systems
• Pre-Processing Images – Volume of Interest
– RegionofInterest
– IntensityofInterest – ImageEnhancement
• Filtering
• Smoothing
• Introduction to Medical Image Computing and Toolkits • Image Filtering, Enhancement, Noise Reduction, and Signal Processing • MedicalImageRegistration • MedicalImageSegmentation • MedicalImageVisualization • Machine Learning in Medical Imaging • Shape Modeling/Analysis of Medical Images Deep Learning in Radiology
Image generation. Gaussian models for human faces, limits and relations with linear neural networks. Generative adversarial networks (GANs), generators, discrinators, adversarial loss and two player games. Convolutional GAN and image arithmetic. Super-resolution. Nearest-neighbor, bilinear and bicubic interpolation. Image sharpening. Linear inverse problems, Tikhonov and Total-Variation regularization. Super-Resolution CNN, VDSR, Fast SRCNN, SRGAN, perceptual, adversarial and content losses. Style transfer: Gatys model, content loss and style loss.
Student information management system project report ii.pdfKamal Acharya
Our project explains about the student management. This project mainly explains the various actions related to student details. This project shows some ease in adding, editing and deleting the student details. It also provides a less time consuming process for viewing, adding, editing and deleting the marks of the students.
Democratizing Fuzzing at Scale by Abhishek Aryaabh.arya
Presented at NUS: Fuzzing and Software Security Summer School 2024
This keynote talks about the democratization of fuzzing at scale, highlighting the collaboration between open source communities, academia, and industry to advance the field of fuzzing. It delves into the history of fuzzing, the development of scalable fuzzing platforms, and the empowerment of community-driven research. The talk will further discuss recent advancements leveraging AI/ML and offer insights into the future evolution of the fuzzing landscape.
Water scarcity is the lack of fresh water resources to meet the standard water demand. There are two type of water scarcity. One is physical. The other is economic water scarcity.
Event Management System Vb Net Project Report.pdfKamal Acharya
In present era, the scopes of information technology growing with a very fast .We do not see any are untouched from this industry. The scope of information technology has become wider includes: Business and industry. Household Business, Communication, Education, Entertainment, Science, Medicine, Engineering, Distance Learning, Weather Forecasting. Carrier Searching and so on.
My project named “Event Management System” is software that store and maintained all events coordinated in college. It also helpful to print related reports. My project will help to record the events coordinated by faculties with their Name, Event subject, date & details in an efficient & effective ways.
In my system we have to make a system by which a user can record all events coordinated by a particular faculty. In our proposed system some more featured are added which differs it from the existing system such as security.
TECHNICAL TRAINING MANUAL GENERAL FAMILIARIZATION COURSEDuvanRamosGarzon1
AIRCRAFT GENERAL
The Single Aisle is the most advanced family aircraft in service today, with fly-by-wire flight controls.
The A318, A319, A320 and A321 are twin-engine subsonic medium range aircraft.
The family offers a choice of engines
Industrial Training at Shahjalal Fertilizer Company Limited (SFCL)MdTanvirMahtab2
This presentation is about the working procedure of Shahjalal Fertilizer Company Limited (SFCL). A Govt. owned Company of Bangladesh Chemical Industries Corporation under Ministry of Industries.
Welcome to WIPAC Monthly the magazine brought to you by the LinkedIn Group Water Industry Process Automation & Control.
In this month's edition, along with this month's industry news to celebrate the 13 years since the group was created we have articles including
A case study of the used of Advanced Process Control at the Wastewater Treatment works at Lleida in Spain
A look back on an article on smart wastewater networks in order to see how the industry has measured up in the interim around the adoption of Digital Transformation in the Water Industry.
COLLEGE BUS MANAGEMENT SYSTEM PROJECT REPORT.pdfKamal Acharya
The College Bus Management system is completely developed by Visual Basic .NET Version. The application is connect with most secured database language MS SQL Server. The application is develop by using best combination of front-end and back-end languages. The application is totally design like flat user interface. This flat user interface is more attractive user interface in 2017. The application is gives more important to the system functionality. The application is to manage the student’s details, driver’s details, bus details, bus route details, bus fees details and more. The application has only one unit for admin. The admin can manage the entire application. The admin can login into the application by using username and password of the admin. The application is develop for big and small colleges. It is more user friendly for non-computer person. Even they can easily learn how to manage the application within hours. The application is more secure by the admin. The system will give an effective output for the VB.Net and SQL Server given as input to the system. The compiled java program given as input to the system, after scanning the program will generate different reports. The application generates the report for users. The admin can view and download the report of the data. The application deliver the excel format reports. Because, excel formatted reports is very easy to understand the income and expense of the college bus. This application is mainly develop for windows operating system users. In 2017, 73% of people enterprises are using windows operating system. So the application will easily install for all the windows operating system users. The application-developed size is very low. The application consumes very low space in disk. Therefore, the user can allocate very minimum local disk space for this application.
CFD Simulation of By-pass Flow in a HRSG module by R&R Consult.pptxR&R Consult
CFD analysis is incredibly effective at solving mysteries and improving the performance of complex systems!
Here's a great example: At a large natural gas-fired power plant, where they use waste heat to generate steam and energy, they were puzzled that their boiler wasn't producing as much steam as expected.
R&R and Tetra Engineering Group Inc. were asked to solve the issue with reduced steam production.
An inspection had shown that a significant amount of hot flue gas was bypassing the boiler tubes, where the heat was supposed to be transferred.
R&R Consult conducted a CFD analysis, which revealed that 6.3% of the flue gas was bypassing the boiler tubes without transferring heat. The analysis also showed that the flue gas was instead being directed along the sides of the boiler and between the modules that were supposed to capture the heat. This was the cause of the reduced performance.
Based on our results, Tetra Engineering installed covering plates to reduce the bypass flow. This improved the boiler's performance and increased electricity production.
It is always satisfying when we can help solve complex challenges like this. Do your systems also need a check-up or optimization? Give us a call!
Work done in cooperation with James Malloy and David Moelling from Tetra Engineering.
More examples of our work https://www.r-r-consult.dk/en/cases-en/
4. Content-based Image Retrieval
(CBIR)
Searching a large database for images that match a query:
• What kinds of databases?
• What kinds of queries?
• What constitutes a match?
• How do we make such searches efficient?
5. Applications
• Art Collections
– e.g. Fine Arts Museum of San Francisco
• Medical Image Databases
– CT, MRI, Ultrasound, The Visible Human
• Scientific Databases
– e.g. Earth Sciences
• General Image Collections for Licensing
– Corbis, Getty Images
• The World Wide Web
6. What is a Query?
An image you already have
– How did you get it?
A rough sketch you draw
– How might you draw it?
A symbolic description of what you want
– What’s an example?
7. Example: IBM QBIC
• IBM QBIC (Query by Image
Content)
• The first commercial system
• Uses or has-used color
percentages, color layout,
texture, shape, location, and
keywords.
8. Example: Berkeley Blobworld
• Images are segmented on
color plus texture
• User selects a region of the
query image
• System returns images with
similar regions
• Works really well for tigers
and zebras
9. Example: Like.com
• Small company
• Search for products similar to a
selected one
• Purses, shoes, sunglasses,
jewelry…etc.
11. Features
• Color
histograms, gridded layout, wavelets
• Texture
Laws, Gabor filters, LBP, polarity
• Shape
What preprocessing must occur to get shape?
• Objects and their Relationships
This is the most powerful, but you have to be able to recognize the
objects!
12. QBIC Histogram Similarity
• h(I) is a K-bin histogram of a database image
• h(Q) is a K-bin histogram of the query image
• The QBIC color histogram distance is:
• A is a K x K similarity matrix
dhist =(I,Q)=(h(I)-h(Q))A(h(I)-h(Q))
R G B Y C V
1 0 0 .5 0 .5
0 1 0 .5 .5 0
0 0 1
1
1
1
R
G
B
Y
C
V
?
?
14. Gridded Color
• Gridded color distance is the sum of the color distances
• in each of the corresponding grid squares.
What color distance would you use for a pair of grid squares?
1 1
2 2
3 3
4 4
16. Search by Texture
• Pick and Click (user clicks on a pixel and system
– retrieves images that have in them a region with
– similar texture to the region surrounding it
• Gridded (just like gridded color, but use texture)
• Histogram-based (e.g. compare the LBP histograms)
18. Shape Distances
• Shape goes one step further than color and texture.
• It requires identification of regions to compare.
• There have been many shape similarity measures suggested for
pattern recognition that can be used to construct shape distance
measures.
19. Global Shape Properties:
Projection Matching
0
4
1
3
2
0
0 4 3 2 1 0
In projection matching, the horizontal and vertical
projections form a histogram.
Feature Vector
(0,4,1,3,2,0,0,4,3,2,1,0)
What are the weaknesses of this method? strengths?
21. Boundary Matching
• Fourier Descriptors
• Sides and Angles
• Elastic Matching
• The distance between query shape and image shape has
two components:
1. energy required to deform the query shape into one that best
matches the image shape
2. measure of how well the deformed query matches the image
23. Regions and Relationships
1. Segment the image into
regions
2. Find their properties and
interrelationships
3. Construct a graph
representation with
nodes for regions and
edges for spatial
relationships
4. Use graph matching to
compare images
Sky
Tiger Grass
Sky
inside
Image Image map
24. Object Detection:
Rowley’s Face Finder
1. Convert to gray scale
2. Normalize for lighting*
3. Histogram equalization
4. Apply neural net(s) trained
on 16K images
• What data is fed to the
classifier?
• 32 x 32 windows in a
pyramid structure
25. Fleck and Forsyth’s
Skin Detector
• The “Finding Naked People” Paper
• Algorithm:
• Look for LARGE areas that satisfy this to identify pornography.
1. Convert RGB to HIS
2. Use the intensity component to compute a texture map
texture = med2 ( | I - med1(I) | )
3. If a pixel falls into either of the following ranges, it’s a
potential skin pixel
texture < 5, 110 < hue < 150, 20 < saturation < 60
texture < 5, 130 < hue < 170, 30 < saturation < 130
27. Jacobs, Finkelstein, Salesin Method
for Image Retrieval (1995)
1. Use YIQ color space
2. Use Haar wavelets
3. 128 x 128 images yield
16,384 coefficients x 3
color channels
4. Truncate by keeping the
40-60 largest coefficients
(make the rest 0)
5. Quantize to 2 values (+1
for positive, -1 for
negative)
28. Andy Berman’s FIDS System
• Multiple distance
measures
• Boolean and linear
combinations
• Efficient indexing using
images as keys
29. Bare-Bones Triangle Inequality
Algorithm
Offline
1. Choose a small set of key images
2. Store distances from database
images to keys
Online (given query Q)
1. Compute the distance from Q to
each key
2. Obtain lower bounds on distances
to database images
3. Threshold or return all images in
order of lower bounds
Offline
1. Choose key images for each
measure*)
2. Store distances from database
images to keys for all measures
Online (given query Q)
1. Calculate lower bounds for each
measure
2. Combine to form lower bounds for
composite measures
3. Continue as in single measure
algorithm
*) with multiple distance measure
32. History
• Early face recognition systems: based on features and
distances
Bledsoe (1966), Kanade (1973)
• Appearance-based models: eigenfaces
Sirovich & Kirby (1987), Turk & Pentland (1991)
• Real-time face detection with boosting
Viola & Jones (2001)
33. The space of all face images
• When viewed as vectors of pixel
values, face images are
extremely high-dimensional
• 100x100 image = 10,000
dimensions
• However, relatively few 10,000-
dimensional vectors correspond
to valid face images
• We want to effectively model the
subspace of face images
34. The space of all face images
• We want to construct a low-
dimensional linear subspace that
best explains the variation in the
set of face images
35. Principal Component Analysis
• Given: N data points x1, … ,xN in Rd
• We want to find a new set of features that are linear
combinations of original ones:
u(xi) = uT(xi – µ)
(µ: mean of data points)
• What unit vector u in Rd captures the most variance of the
data?
36. Principal Component Analysis
• Direction that maximizes the variance of the projected
data:
• Direction that maximizes the variance is the eigenvector
associated with the largest eigenvalue of Σ
var(u) =
1
N
uT
(xi -m)
i=1
N
å (uT
(xi -m))T
= uT
(xi -m)
i=1
N
å (xi -m)T
é
ë
ê
ù
û
úu
= uT
u
å
Projection of data point
Covariance matrix
37. Eigenfaces: Key idea
• Assume that most face images lie on
a low-dimensional subspace determined by the first k (k<d)
directions of maximum variance
• Use PCA to determine the vectors u1,…uk that span that
subspace:
x ≈ μ + w1u1 + w2u2 + … + wkuk
• Represent each face using its “face space” coordinates
(w1,…wk)
• Perform nearest-neighbor recognition in “face space”
40. Eigenfaces example
Face x in “face space” coordinates:
Reconstruction:
= +
µ + w1u1 + w2u2 + w3u3 + w4u4 + …
^
x =
x [u1
T
(x -m),...,uk
T
(x -m)]
= w1,w2,...,wk
41. Summary: Recognition with
Eigenfaces
Process labeled training images:
• Find mean µ and covariance matrix Σ
• Find k principal components (eigenvectors of Σ) u1,…uk
• Project each training image xi onto subspace spanned by principal
components:
(wi1,…,wik) = (u1
T(xi – µ), … , uk
T(xi – µ))
Given novel image x:
• Project onto subspace:
(w1,…,wk) = (u1
T(x– µ), … , uk
T(x – µ))
• Optional: check reconstruction error x – x to determine whether
image is really a face
• Classify as closest training face in k-dimensional subspace
^
42. Acknowledgment
Some of slides in this PowerPoint presentation are adaptation from
various slides, many thanks to:
1. Linda Saphiro, Department of Computer Science and Engineering,
University of Washington
(http://homes.cs.washington.edu/~shapiro/)
2. Svetlana Lazebnik, Department of Computer Science, University of
Illinois at Urbana-Champaign (http://web.engr.illinois.edu/~slazebni/)