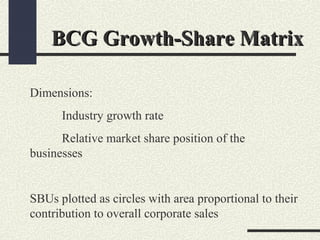
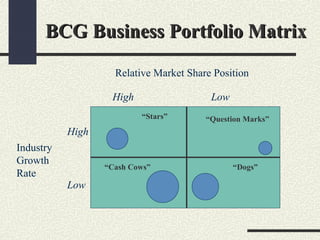
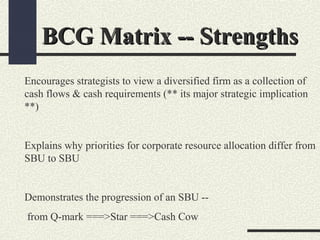
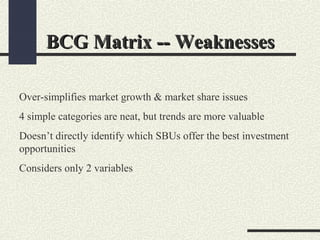
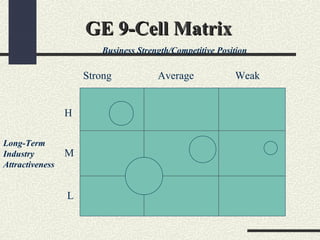
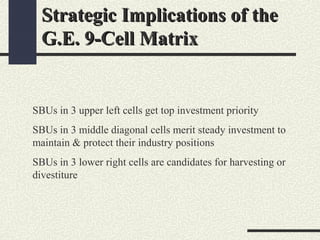
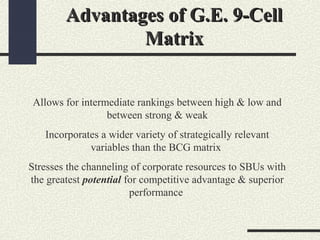
BCG Growth Share Matrix &
GE 9 Cell Matrix
By Neha Soni
Asst Professor
BCG Growth-Share MatrixBCG Growth-Share Matrix
Dimensions:
Industry growth rate
Relative market share position of the
businesses
SBUs plotted as circles with area proportional to their
contribution to overall corporate sales
BCG Growth-Share MatrixBCG Growth-Share Matrix
Dimensions:
Industry growth rate
Relative market share position of the
businesses
SBUs plotted as circles with area proportional to their
contribution to overall corporate sales
BCG Business Portfolio MatrixBCG Business Portfolio Matrix
High Low
High
Low
“Stars”
“Cash Cows”
“Question Marks”
“Dogs”
Industry
Growth
Rate
Relative Market Share Position
BCG Matrix -- StrengthsBCG Matrix -- Strengths
Encourages strategists to view a diversified firm as a collection of
cash flows & cash requirements (** its major strategic implication
**)
Explains why priorities for corporate resource allocation differ from
SBU to SBU
Demonstrates the progression of an SBU --
from Q-mark ===>Star ===>Cash Cow
BCG Matrix -- WeaknessesBCG Matrix -- Weaknesses
Over-simplifies market growth & market share issues
4 simple categories are neat, but trends are more valuable
Doesn’t directly identify which SBUs offer the best investment
opportunities
Considers only 2 variables
G.E. 9-Cell MatrixG.E. 9-Cell Matrix
Dimensions:
Long-term industry attractiveness
Business strength/Competitive position
SBUs plotted as circles with area proportional to the size of
the industry, & a sector within each circle representing the
SBUs market share in its industry
Strong Average Weak
H
M
L
GE 9-Cell MatrixGE 9-Cell Matrix
Business Strength/Competitive Position
Long-Term
Industry
Attractiveness
Strategic Implications of theStrategic Implications of the
G.E. 9-Cell MatrixG.E. 9-Cell Matrix
SBUs in 3 upper left cells get top investment priority
SBUs in 3 middle diagonal cells merit steady investment to
maintain & protect their industry positions
SBUs in 3 lower right cells are candidates for harvesting or
divestiture
Advantages of G.E. 9-CellAdvantages of G.E. 9-Cell
MatrixMatrix
Allows for intermediate rankings between high & low and
between strong & weak
Incorporates a wider variety of strategically relevant
variables than the BCG matrix
Stresses the channeling of corporate resources to SBUs with
the greatest potential for competitive advantage & superior
performance
Weaknesses of G.E. 9-CellWeaknesses of G.E. 9-Cell
MatrixMatrix
Provides no guidance on specifics of SBU strategy
Only suggests general strategic posture -- aggressive
expansion, fortify-&-defend, or harvest/divest
Doesn’t address the issue of strategic coordination across
related SBUs
Tends to obscure SBUs about to “take off” or “crash & burn”
-- static, not dynamic

Ppt for bcg & ge nine cell matrix

  • 1.
    BCG Growth ShareMatrix & GE 9 Cell Matrix By Neha Soni Asst Professor
  • 2.
    BCG Growth-Share MatrixBCGGrowth-Share Matrix Dimensions: Industry growth rate Relative market share position of the businesses SBUs plotted as circles with area proportional to their contribution to overall corporate sales
  • 3.
    BCG Growth-Share MatrixBCGGrowth-Share Matrix Dimensions: Industry growth rate Relative market share position of the businesses SBUs plotted as circles with area proportional to their contribution to overall corporate sales
  • 4.
    BCG Business PortfolioMatrixBCG Business Portfolio Matrix High Low High Low “Stars” “Cash Cows” “Question Marks” “Dogs” Industry Growth Rate Relative Market Share Position
  • 5.
    BCG Matrix --StrengthsBCG Matrix -- Strengths Encourages strategists to view a diversified firm as a collection of cash flows & cash requirements (** its major strategic implication **) Explains why priorities for corporate resource allocation differ from SBU to SBU Demonstrates the progression of an SBU -- from Q-mark ===>Star ===>Cash Cow
  • 6.
    BCG Matrix --WeaknessesBCG Matrix -- Weaknesses Over-simplifies market growth & market share issues 4 simple categories are neat, but trends are more valuable Doesn’t directly identify which SBUs offer the best investment opportunities Considers only 2 variables
  • 7.
    G.E. 9-Cell MatrixG.E.9-Cell Matrix Dimensions: Long-term industry attractiveness Business strength/Competitive position SBUs plotted as circles with area proportional to the size of the industry, & a sector within each circle representing the SBUs market share in its industry
  • 8.
    Strong Average Weak H M L GE9-Cell MatrixGE 9-Cell Matrix Business Strength/Competitive Position Long-Term Industry Attractiveness
  • 9.
    Strategic Implications oftheStrategic Implications of the G.E. 9-Cell MatrixG.E. 9-Cell Matrix SBUs in 3 upper left cells get top investment priority SBUs in 3 middle diagonal cells merit steady investment to maintain & protect their industry positions SBUs in 3 lower right cells are candidates for harvesting or divestiture
  • 10.
    Advantages of G.E.9-CellAdvantages of G.E. 9-Cell MatrixMatrix Allows for intermediate rankings between high & low and between strong & weak Incorporates a wider variety of strategically relevant variables than the BCG matrix Stresses the channeling of corporate resources to SBUs with the greatest potential for competitive advantage & superior performance
  • 11.
    Weaknesses of G.E.9-CellWeaknesses of G.E. 9-Cell MatrixMatrix Provides no guidance on specifics of SBU strategy Only suggests general strategic posture -- aggressive expansion, fortify-&-defend, or harvest/divest Doesn’t address the issue of strategic coordination across related SBUs Tends to obscure SBUs about to “take off” or “crash & burn” -- static, not dynamic