1) The document discusses different types of measurement scales used in research including nominal, ordinal, interval, and ratio scales.
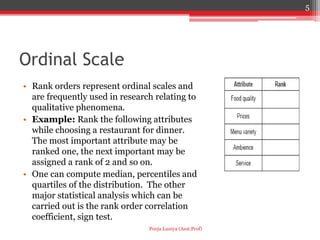
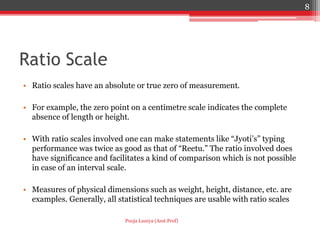
2) Nominal scales simply assign numbers or symbols to identify objects without quantitative significance, ordinal scales rank objects but the distances between ranks are not specified, interval scales have equal intervals but an arbitrary zero point, and ratio scales have a true zero point allowing comparisons like doubles.
3) Examples of each scale are provided such as player numbers (nominal), ranking restaurant attributes (ordinal), standardized test scores (interval), and physical measurements like height (ratio).
caling is the branch of measurement that involves the construction of an instrument that associates qualitative constructs with quantitative metric units. Scaling evolved out of efforts in psychology and education to measure “unmeasurable” constructs like authoritarianism and self-esteem. In many ways, scaling remains one of the most arcane and misunderstood aspects of social research measurement. And, it attempts to do one of the most difficult of research tasks – measure abstract concepts.
Most people don’t even understand what scaling is. The basic idea of scaling is described in General Issues in Scaling, including the important distinction between a scale and a response format. Scales are generally divided into two broad categories: unidimensional and multidimensional. The unidimensional scaling methods were developed in the first half of the twentieth century and are generally named after their inventor. We’ll look at three types of unidimensional scaling methods here:
Thurstone or Equal-Appearing Interval Scaling
Likert or “Summative” Scaling
Guttman or “Cumulative” Scaling
In the late 1950s and early 1960s, measurement theorists developed more advanced techniques for creating multidimensional scales. Although these techniques are not considered here, you may want to look at the method of concept mapping that relies on that approach to see the power of these multivariate methods.
Things to Consider when Evaluating Options for Web Data ExtractionPromptCloud
Here is a detailed overview of different ways by which you can extract data from the web. This could help you make the final call while evaluating different options for web data extraction.
Evaluation Unit 4
Statistics in the View point of Evaluation
Unit 4 Syllabus-
4.2.1- Measuring Scales- Meaning and Statistical Use
4.2.2- Conversion and interpretation of Test Score
4.2.3- Normal Probability Curve
4.2.4- Central Tendency and its importance in Evaluation.
4.2.5- Dimensions of Deviation
The Unit 4 is all about Statistics…
Statistics is the study of the collection, analysis, interpretation, presentation, and organization of data.
In other words, it is a mathematical discipline to collect, summarize data.
Also, we can say that statistics is a branch of applied mathematics.
Statistics is simply defined as the study and manipulation of data. As we have already discussed in the introduction that statistics deals with the analysis and computation of numerical data.
Projective methods of Evaluation through Statistics-
Measurement is a process of assigning numbers to individuals or their characteristics according to specific rules.” (Eble and Frisbie, 1991, p.25).
This is very common and simple definition of the term ‘measurement’.
You can say that measurement is a quantitative description of one’s performance. Gay (1991) further simplified the term as a process of quantifying the degree to which someone or something possessed a given trait, i.e., quality, characteristics, or features.
Measurement assigns a numeral to quantify certain aspects of human and non-human beings.
It is numerical description of objects, traits, attributes, characteristics or behaviours.
Measurement is not an end in itself but definitely a means to evaluate the abilities of a person in education and other fields as well.
Measurement Scale-
Whenever we measure anything, we assign a numerical value. This numerical value is known as scale of measurement. A scale is a system or scheme for assigning values or scores to the characteristics being measured (Sattler, 1992). Like for measuring any aspect of the human being we assign a numeral to quantify it, further we can provide an order to it if we know the similar type of measurement of other members of the group, we can also make groups considering equal interval scores within the group.
Psychologist Stanley Stevens developed the four common scales of measurement:
Nominal
Ordinal
Interval &
Ratio
Each scale of measurement has properties that determine how to properly analyze the data.
Nominal scale-
In nominal scale, a numeral or label is assigned for characterizing the attribute of the person or thing.
That caters no order to define the attribute as high-low, more-less, big-small, superior-inferior etc.
In nominal scale, assigning a numeral is purely an individual matter.
It is nothing to do with the group scores or group measurement.
Statistics such as frequencies, percentages, mode, and chi-square tests are used in nominal measurement.
Examples include gender (male, female), colors (red, blue, green), or types of fruit (apple, banana, orange).
Ordinal scale-
Ordinal scale is synonymous to ranking or g
Research Methodology: Questionnaire, Sampling, Data Preparationamitsethi21985
As per PTU's MBA Syllabus, Unit No. 2: Sources Of Data: Primary And Secondary; Data Collection Methods; Questionnaire Designing: Construction, Types And Developing A Good Questionnaire. Sampling Design and Techniques, Scaling Techniques, Meaning, Types, Data Processing Operations, Editing, Coding, Classification, Tabulation. Research Proposal/Synopsis Writing. Practical Framework
This presentation covers introduction,meaning,definition,characteristics,objectives,advantages,limitations,essential conditions for an effective system & methods of standard costing.
This presentation covers meaning,definiton,characteristics & types of enrepreneur & meaning of entrepreneurship,its dimensions,classification of corporate entrepreneurship & factors affecting development of entrepreneurship
This presentation covers factors affecting elasticity of demand, degree of elasticity, different types of elasticity such as total outlay method, point method and percentage method.
The Team Member and Guest Experience - Lead and Take Care of your restaurant team. They are the people closest to and delivering Hospitality to your paying Guests!
Make the call, and we can assist you.
408-784-7371
Foodservice Consulting + Design
Modern Database Management 12th Global Edition by Hoffer solution manual.docxssuserf63bd7
https://qidiantiku.com/solution-manual-for-modern-database-management-12th-global-edition-by-hoffer.shtml
name:Solution manual for Modern Database Management 12th Global Edition by Hoffer
Edition:12th Global Edition
author:by Hoffer
ISBN:ISBN 10: 0133544613 / ISBN 13: 9780133544619
type:solution manual
format:word/zip
All chapter include
Focusing on what leading database practitioners say are the most important aspects to database development, Modern Database Management presents sound pedagogy, and topics that are critical for the practical success of database professionals. The 12th Edition further facilitates learning with illustrations that clarify important concepts and new media resources that make some of the more challenging material more engaging. Also included are general updates and expanded material in the areas undergoing rapid change due to improved managerial practices, database design tools and methodologies, and database technology.
Oprah Winfrey: A Leader in Media, Philanthropy, and Empowerment | CIO Women M...CIOWomenMagazine
This person is none other than Oprah Winfrey, a highly influential figure whose impact extends beyond television. This article will delve into the remarkable life and lasting legacy of Oprah. Her story serves as a reminder of the importance of perseverance, compassion, and firm determination.
Artificial intelligence (AI) offers new opportunities to radically reinvent the way we do business. This study explores how CEOs and top decision makers around the world are responding to the transformative potential of AI.
1. BBA V th Sem.Marketing Research
Topic: Measurement and Scaling
Techniques
Pooja Luniya- (Asst. Prof.)
G.D. Rungta College of Science & Technology
2. Measurement
Concept • Let us think….
▫ Bobby is 24 twice his younger brother
who is 12
▫ My attitude toward tide is (6-Good),
twice as compared to that of Sheena (3-
Average).
▫ Market rankings reveal that Tide is twice
better than Wheel
▫ Big Bazar is an economy store because
the prices in this store are half that of
any premium store
2
Pooja Luniya (Asst.Prof)
3. Scaling: concept
▫ Assigning numbers or other symbols to characteristics
of objects according to certain pre-specified rules.
▫ The measurement of physical properties is not a
complex deal, whereas measurement of psychological
properties requires a careful attention of a researcher.
3
Pooja Luniya (Asst.Prof)
4. Nominal scale:
• Nominal scale is simply a system of assigning
number symbols to events in order to label them.
• Example: assignment of numbers of basketball
players in order to identify them.
• Example: Gender: Male / Female
• Nominal data are, thus, counted data.
• One cannot usefully average the numbers on the
back of a group of football players and come up
with a meaningful value.
• Therefore, a frequency distribution table can be
prepared for the nominal scale variables and mode
of the distribution can be worked out
4
Pooja Luniya (Asst.Prof)
5. Ordinal Scale
• Rank orders represent ordinal scales and
are frequently used in research relating to
qualitative phenomena.
• Example: Rank the following attributes
while choosing a restaurant for dinner.
The most important attribute may be
ranked one, the next important may be
assigned a rank of 2 and so on.
• One can compute median, percentiles and
quartiles of the distribution. The other
major statistical analysis which can be
carried out is the rank order correlation
coefficient, sign test.
5
Pooja Luniya (Asst.Prof)
6. Interval
• A scale in which the number are used to rate object and the intervals
are adjusted in terms of some rule that has been established as a
basis for making the units equal.
• The primary limitation of the interval scale is the lack of a true zero;
it does not have the capacity to measure the complete absence of a
trait or characteristic.
• Product moment correlation techniques are appropriate and the
generally used tests for statistical significance are the ‘t’ test and ‘F’
test.
6
Pooja Luniya (Asst.Prof)
7. Example: Interval Scale
The numbers on this scale can be added, subtracted,
multiplied or divided. One can compute arithmetic mean,
standard deviation, correlation coefficient and conduct a t-
test, Z-test, regression analysis and factor analysis.
7
Pooja Luniya (Asst.Prof)
8. Ratio Scale
• Ratio scales have an absolute or true zero of measurement.
• For example, the zero point on a centimetre scale indicates the complete
absence of length or height.
• With ratio scales involved one can make statements like “Jyoti’s” typing
performance was twice as good as that of “Reetu.” The ratio involved does
have significance and facilitates a kind of comparison which is not possible
in case of an interval scale.
• Measures of physical dimensions such as weight, height, distance, etc. are
examples. Generally, all statistical techniques are usable with ratio scales
8
Pooja Luniya (Asst.Prof)