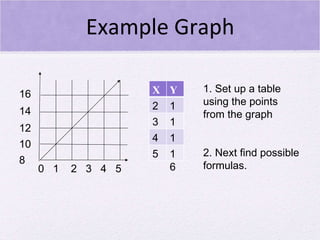
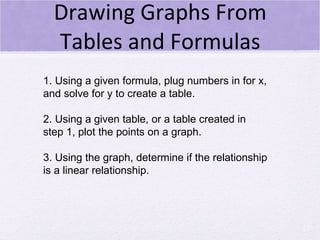
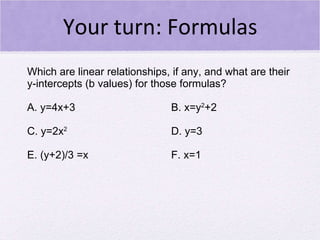
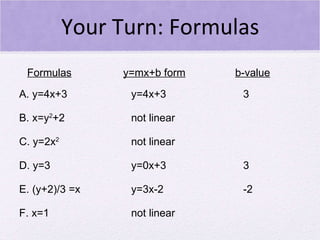
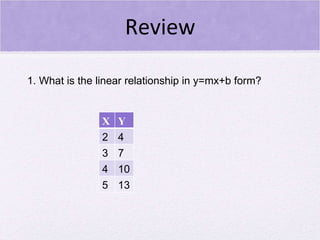
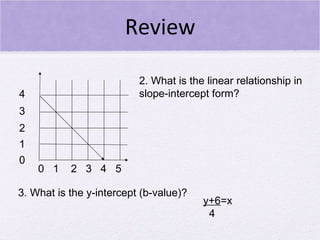
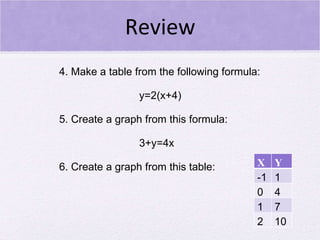
Recognizing and Interpreting Linear Relationships Sara Salefske
Linear Relationships Definition:  A set of directly proportional points, that when placed on a graph, create a straight line.
How to Tell if it is Linear Figure out a common way to get from each X-value to their corresponding Y-values. There are 4 easy steps to help you out. Start with the first X-value and the first Y-value. Take all possible relationships into consideration.
How to Tell (cont.) Example:  The first pair, (2,10) could have the possible formulas of : y=x+8, y=(x+3)2, y=2x+6, etc. X Y 2 10 3 12 4 14 5 16
How to Tell (cont.) Use one of the possible relationships on the next pair of numbers. If the same formula works for each set, it is linear. ** If there is  no  common formula for each set, it is  NOT  linear.
Your Turn: Tables It's your turn. Which tables, if any show linear relationships? Write on scrap paper which ones you think are, and a formula that would solve them. A B C D X Y 5 30 6 36 7 42 8 48 X Y 12 7 13 60 14 5 15 14 X Y 2 0 3 4 4 8 5 12 X Y 10 14 11 15 12 16 13 17
Your Turn: Tables A. Not a linear Relationship. B. 6x=y C. (x-2)4=y Or 4x-8=y D. x+4=y X Y 5 30 6 36 7 42 8 48 X Y 2 0 3 4 4 8 5 12 X Y 10 14 11 15 12 16 13 17 X Y 10 14 11 15 12 16 13 17 X Y 12 7 13 60 14 5 15 14
Now Learn to Use Graphs 1. Find easy points on the line. 2. Using these points/pairs, make a table. ** Also: if the graph is a line, it is a linear relationship, but some graphs  are  distorted, so be sure to pick some points to double check.
Example Graph 0  1  2  3  4  5 16 14 12 10 8 1. Set up a table using the points from the graph 2. Next find possible formulas. X Y 2 10 3 12 4 14 5 16
Example Graph 0  1  2  3  4  5 16 14 12 10 8 3. Do any of the formulas from step 2 work for every pair? 2x+6=y ** Always check your work. 4. If they all have the same relationship, it is a linear relationship. If not, its NOT linear.
Drawing Graphs From Tables and Formulas 1. Using a given formula, plug numbers in for x, and solve for y to create a table. 2. Using a given table, or a table created in step 1, plot the points on a graph. 3. Using the graph, determine if the relationship is a linear relationship.
Interpreting Formulas 1. If given formula fits slope-intercept form  (y=mx+b) , it is linear. 2. b is equal to the y-intercept. 3. y-intercept tells where a linear relationship would cross the y-axis.
Your turn: Formulas Which are linear relationships, if any, and what are their y-intercepts (b values) for those formulas? A. y=4x+3 B. x=y 2 +2 C. y=2x 2 D. y=3 E. (y+2)/3 =x F. x=1
Your Turn: Formulas A. y=4x+3 y=4x+3 3 B. x=y 2 +2 not linear C. y=2x 2 not linear D. y=3 y=0x+3 3 E. (y+2)/3 =x y=3x-2 -2 F. x=1 not linear Formulas y=mx+b form b-value
Review 1. What is the linear relationship in y=mx+b form? X Y 2 4 3 7 4 10 5 13
Review 0  1  2  3  4  5 4 3 2 1 0 2. What is the linear relationship in slope-intercept form? 3. What is the y-intercept (b-value)? y+6 =x 4
Review 4. Make a table from the following formula: y=2(x+4) 5. Create a graph from this formula: 3+y=4x 6. Create a graph from this table: X Y -1 1 0 4 1 7 2 10

PPT 7th grade math

  • 1.
    Recognizing and InterpretingLinear Relationships Sara Salefske
  • 2.
    Linear Relationships Definition: A set of directly proportional points, that when placed on a graph, create a straight line.
  • 3.
    How to Tellif it is Linear Figure out a common way to get from each X-value to their corresponding Y-values. There are 4 easy steps to help you out. Start with the first X-value and the first Y-value. Take all possible relationships into consideration.
  • 4.
    How to Tell(cont.) Example: The first pair, (2,10) could have the possible formulas of : y=x+8, y=(x+3)2, y=2x+6, etc. X Y 2 10 3 12 4 14 5 16
  • 5.
    How to Tell(cont.) Use one of the possible relationships on the next pair of numbers. If the same formula works for each set, it is linear. ** If there is no common formula for each set, it is NOT linear.
  • 6.
    Your Turn: TablesIt's your turn. Which tables, if any show linear relationships? Write on scrap paper which ones you think are, and a formula that would solve them. A B C D X Y 5 30 6 36 7 42 8 48 X Y 12 7 13 60 14 5 15 14 X Y 2 0 3 4 4 8 5 12 X Y 10 14 11 15 12 16 13 17
  • 7.
    Your Turn: TablesA. Not a linear Relationship. B. 6x=y C. (x-2)4=y Or 4x-8=y D. x+4=y X Y 5 30 6 36 7 42 8 48 X Y 2 0 3 4 4 8 5 12 X Y 10 14 11 15 12 16 13 17 X Y 10 14 11 15 12 16 13 17 X Y 12 7 13 60 14 5 15 14
  • 8.
    Now Learn toUse Graphs 1. Find easy points on the line. 2. Using these points/pairs, make a table. ** Also: if the graph is a line, it is a linear relationship, but some graphs are distorted, so be sure to pick some points to double check.
  • 9.
    Example Graph 0 1 2 3 4 5 16 14 12 10 8 1. Set up a table using the points from the graph 2. Next find possible formulas. X Y 2 10 3 12 4 14 5 16
  • 10.
    Example Graph 0 1 2 3 4 5 16 14 12 10 8 3. Do any of the formulas from step 2 work for every pair? 2x+6=y ** Always check your work. 4. If they all have the same relationship, it is a linear relationship. If not, its NOT linear.
  • 11.
    Drawing Graphs FromTables and Formulas 1. Using a given formula, plug numbers in for x, and solve for y to create a table. 2. Using a given table, or a table created in step 1, plot the points on a graph. 3. Using the graph, determine if the relationship is a linear relationship.
  • 12.
    Interpreting Formulas 1.If given formula fits slope-intercept form (y=mx+b) , it is linear. 2. b is equal to the y-intercept. 3. y-intercept tells where a linear relationship would cross the y-axis.
  • 13.
    Your turn: FormulasWhich are linear relationships, if any, and what are their y-intercepts (b values) for those formulas? A. y=4x+3 B. x=y 2 +2 C. y=2x 2 D. y=3 E. (y+2)/3 =x F. x=1
  • 14.
    Your Turn: FormulasA. y=4x+3 y=4x+3 3 B. x=y 2 +2 not linear C. y=2x 2 not linear D. y=3 y=0x+3 3 E. (y+2)/3 =x y=3x-2 -2 F. x=1 not linear Formulas y=mx+b form b-value
  • 15.
    Review 1. Whatis the linear relationship in y=mx+b form? X Y 2 4 3 7 4 10 5 13
  • 16.
    Review 0 1 2 3 4 5 4 3 2 1 0 2. What is the linear relationship in slope-intercept form? 3. What is the y-intercept (b-value)? y+6 =x 4
  • 17.
    Review 4. Makea table from the following formula: y=2(x+4) 5. Create a graph from this formula: 3+y=4x 6. Create a graph from this table: X Y -1 1 0 4 1 7 2 10