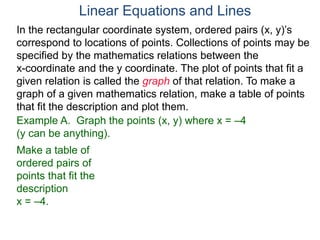
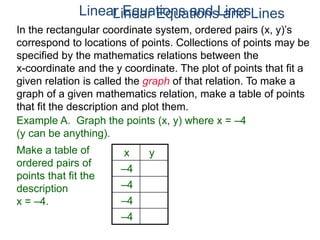
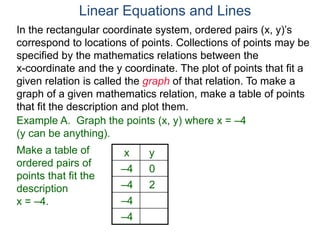
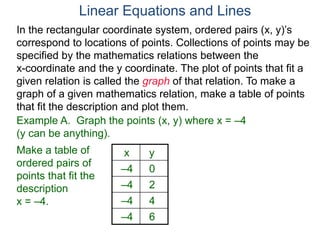
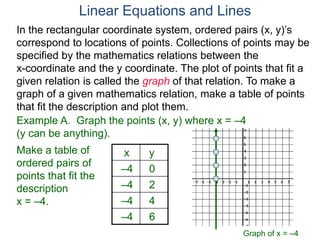
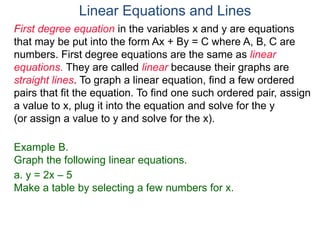
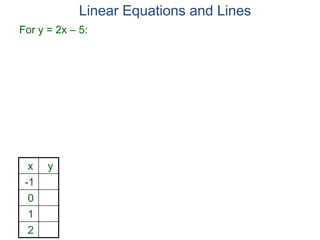
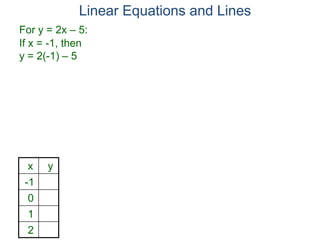
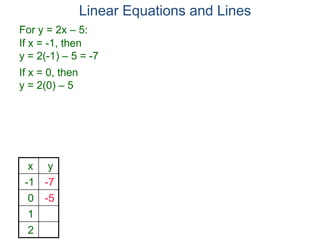
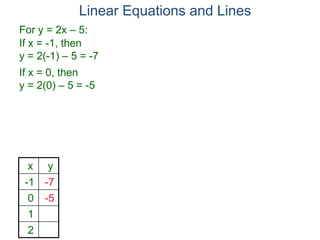
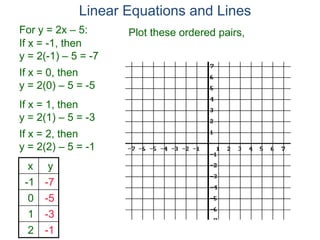
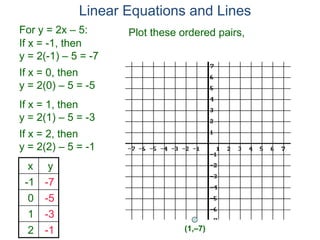
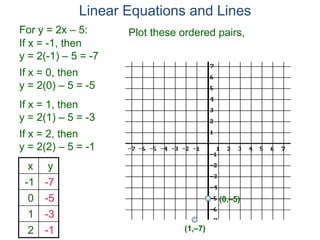
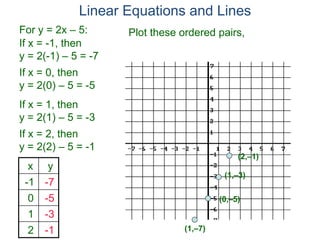
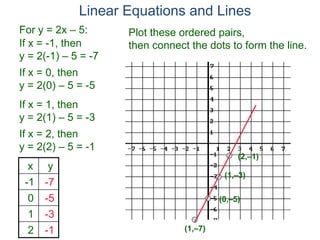
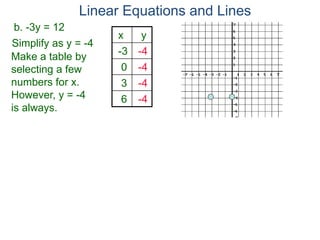
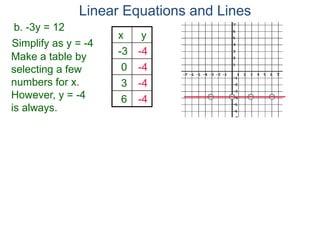
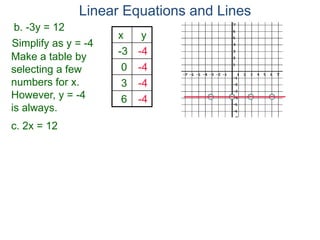
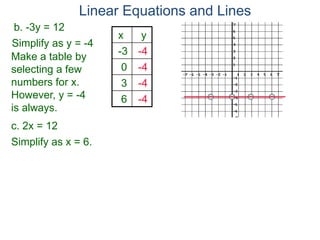
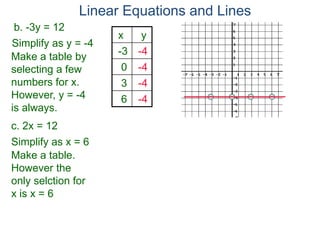
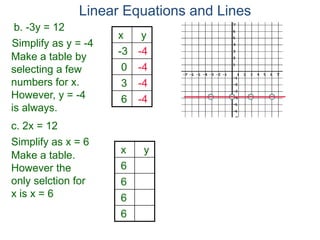
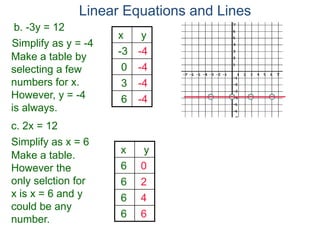
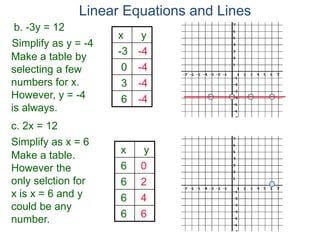
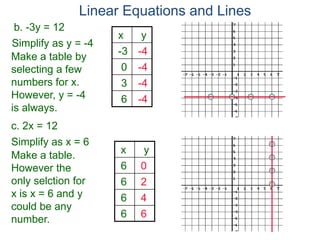
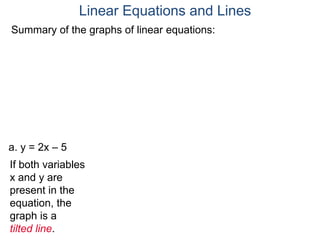
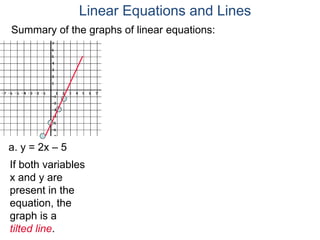
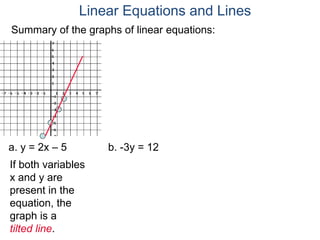
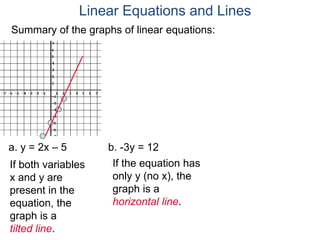
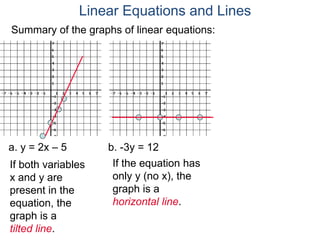
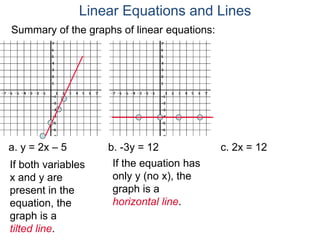
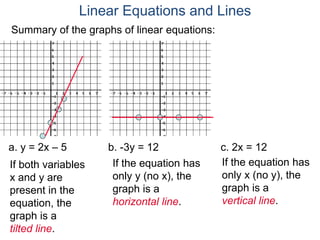
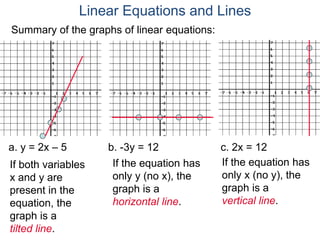
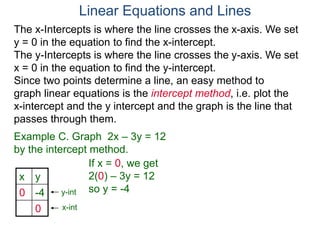
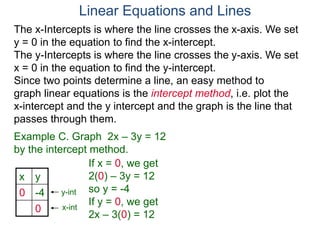
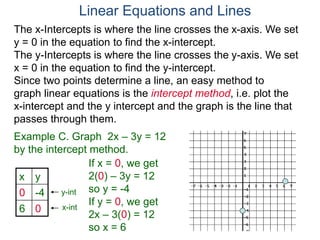
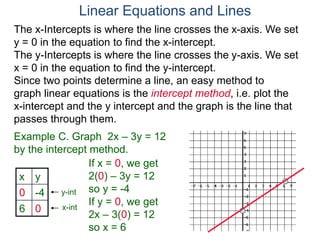
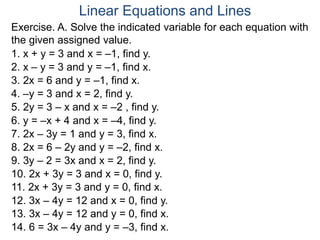
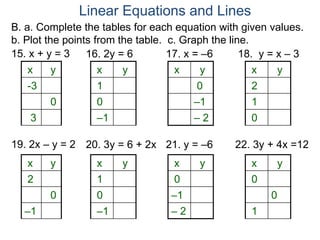
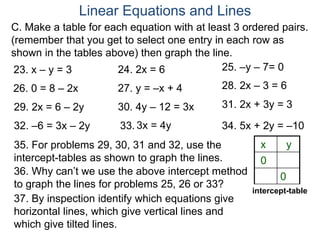
The document discusses linear equations and how to graph them. It explains that linear equations relate the x-coordinate and y-coordinate of points in a straight line. To graph a linear equation, one finds ordered pairs that satisfy the equation by choosing values for x and solving for y, then plots the points. An example demonstrates graphing the linear equation y = 2x - 5 by making a table of x and y values and plotting the line.