Downloaded 57 times
![• Microsoft Data Consultant
• DataScenarios – Data Consultancy Company
• Architect roles at multiple projects
• Creator of Power BI Custom Visuals
• HierarchySlicer [∞]
• Box and Whisker chart [∞]
• D3js Visual [∞]
• Contact
• mail@datascenarios.nl
• https://twitter.com/jppp
• https://linkedin.com/in/jpposthuma
• https://github.com/liprec
Jan Pieter Posthuma
2© 2019 – DataScenarios](https://image.slidesharecdn.com/201906-pbimcr-powerbifordevelopers-190627203734/85/Power-BI-for-Developers-2-320.jpg)


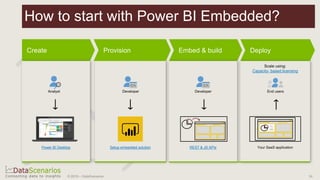


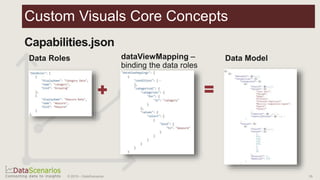


The document is a developer's guide for enhancing Power BI solutions, focusing on embedding analytics into applications using Power BI's APIs and custom visuals. It covers key topics such as authentication, data connectivity, and the benefits of Power BI embedded, along with a roadmap for future development. Additionally, it details the development process for custom visuals, including necessary tools and libraries, and emphasizes the importance of integrating analytics into application workflows.


![Microsoft Power Stack 2019 [Power BI, Excel, Azure & Friends]](https://cdn.slidesharecdn.com/ss_thumbnails/cl5khvpdqxat1towwmgy-signature-ad54afc6bb6f90c90525c52bba803ad4bbc4540a1573646d15de668783fb664a-poli-170212213019-thumbnail.jpg?width=640&height=640&fit=bounds)


