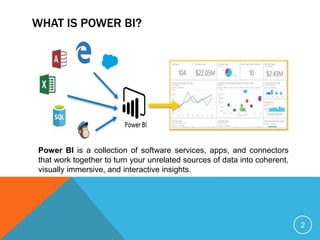
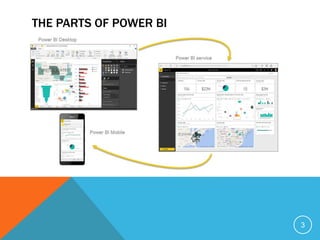
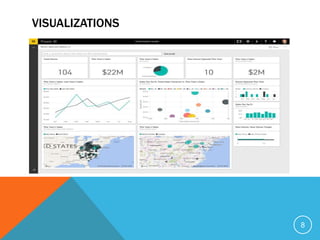
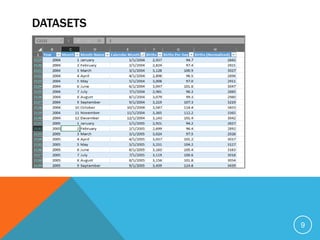
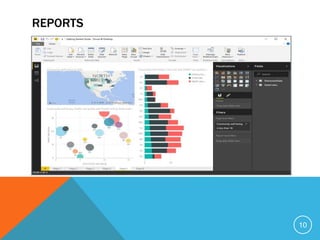
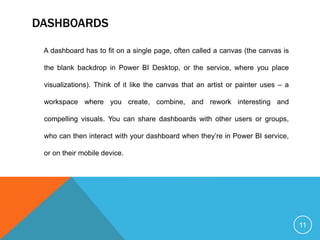
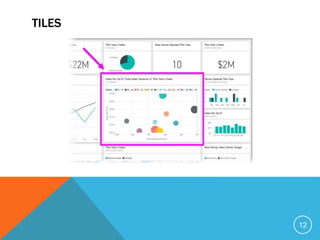
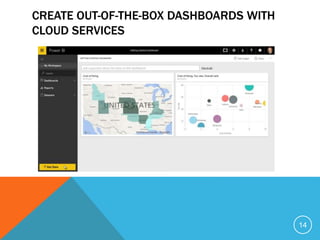
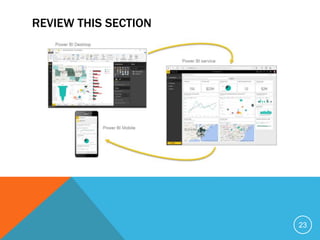
Get technically equipped to grow and build your Power BI (Business Intelligence) practice, enabling you to offer new solutions and services to customers. With Power BI, you can transform your customers' data into rich visuals they can collect and organize, helping them focus on what matters most to their businesses.
Introduction to Power BI to make smart decisionsVIVEK GURURANI
Power BI: Business intelligence like never before!
Power BI is a tool that allows accounting and finance managers and professionals to have relevant information at the right time to make strategic decisions in a flexible, centralized, and secure way. Transform your business with predictive analytics, data visualization, and information in real-time, thanks to Power BI.
Presentation Agenda:
1. Introduction to Power BI
2. Why would your business need Power BI?
3. Power BI Architecture
4. Data Sanitization & Cleansing Capabilities
5. Analytical Insights
6. Generating Department Wise Reports & Visualizations
7. Latest & Upcoming Power BI features
8. Live Q&A
A simplified version of my presentation:
- PowerBI solution architecture
- Key steps to visualize data in PowerBI
- PowerBI Demo
- R in PowerBI
- Custom Visuals
- PowerBI Report Server
- Azure services and Power BI
What Is Power BI? | Introduction To Microsoft Power BI | Power BI Training | ...Edureka!
( Power BI Training - https://www.edureka.co/power-bi-training )
This Edureka "What Is Power BI?" tutorial will help you an introduction to Power BI. This video helps you to learn the following topics:
1. Why Power BI?
2. What Is Power BI?
3. Who Use Power BI?
4. Components Of Power BI
5. Building Blocks Of Power BI
Check out our Power BI Playlist: https://goo.gl/97sJv1
This ppt covers everything that a beginner learning Power BI must know. It explains why power bi is the best choice for data visualization, what is its use, what are career opportunities, etc.
Explain about power BI Overview from Power BI Desktop, Power BI Service, Power BI Report Server and Power BI Mobile that consume all BI Data from Dataset and datamodel
What is Microsoft Power BI and what are its benefits. how we can Analyse data with the help of power BI. Power BI A Microsoft Business Intelligence and Data Analysis tool.
Presented to The Ottawa IT Community Meetup Group (Ottawa SQL - PASS Chapter) on Thursday September 19
Powerful Self-Service BI in Excel 2013 - Data search and discovery with Power Query (formerly "Data Explorer"), analyzing and modeling with Power Pivot, visualizing and exploring with Power View and Power Map (formerly codename "GeoFlow")
Power BI Training | Getting Started with Power BI | Power BI Tutorial | Power...Edureka!
This Edureka tutorial on "Getting started with Power BI" will provide you the fundamental knowledge of Power BI. Below are the topics covered in this tutorial:
1. What is Self Service Business Intelligence?
2. Why Power BI?
3. What is Power BI?
4. Demo on Power BI
Power BI is a business analytics service by Microsoft. It aims to provide interactive visualizations and business intelligence capabilities with an interface simple enough for end users to create their own reports and dashboards.
This presentation will give you an overview of what Microsoft Power BI is. What are its features. Why it is an upcoming popular Data Visualization tool in the market. How to use it and comparison with other Visualization tools.
BI: new of the buzz words that everyone is talking about but what is it? How can it be used to make a impact in my organization? How do I get started? This session was delivered for SharePoint Saturday Reston.
This slide deck explains in a comprehensive way what Power BI is, how the Power BI architecture looks like and what the usage scenarios are for using Power BI and related tools
Power BI Desktop | Power BI Tutorial | Power BI Training | EdurekaEdureka!
This Edureka "Power BI Desktop" tutorial will help you to understand what is Power BI Desktop with examples and demo. Below are the topics covered in this tutorial:
1. Why Power BI?
2. What Power BI?
3. Who use Power BI?
4. Flow of Work
5. Power BI Trends
What is the Power BI and learn the Power BI by self and this presentation contains some use full links which help us at time of developing the Power BI.
Power BI Tutorial For Beginners | Power BI Tutorial | Power BI Demo | Power B...Edureka!
( Power BI Training - https://www.edureka.co/power-bi-training )
This Edureka videoon "Power BI Tutorial" will provide you with the fundamental knowledge on Power BI (Blog: https://goo.gl/uFTDU3). Below are the topics covered in this tutorial:
1. Why do we need Business Intelligence?
2. What is Self Service Business Intelligence?
3. Why Power BI?
4. What is Power BI?
5. Demo: Report and Dashboard Creation
The presentation discusses the different aspects of Power BI like Power BI for O365, Data Discovery, Data Analysis, Data Visualization & Power Maps, Natural Language Search etc.
Its a business analytics solution presented by Netwoven at the Microsoft Power BI workshop held on Oct 30th at SVC Microsoft, Mountain View.
Microsoft Power BI | Brief Introduction | PPTSophia Smith
What is Power BI?
Microsoft Power BI is one of the most powerful data visualization software. It empowers the organizations with their tools and help the users to transform their raw data into valuable information. Let's have a look on How Power BI helps to your business.
Slides for the Usergroup meeting for the Manchester Power BI User Group on June 27th, 2019.
Subject: Power BI for Developers about Power BI Embedded and Power BI Custom Visuals
Power bi (1)Power BI Online Training Hyderabad | power bi online training ben...Big IT Trainings
Power BI Desktop integrates proven Microsoft technologies the powerful Query engine, data modeling, and visualizations. All sorts of different data sources, then combine and shape them in ways that facilitate making interesting, in Power BI online Training.
Power BI Full Course | Power BI Tutorial for Beginners | EdurekaEdureka!
YouTube Link: https://youtu.be/3u7MQz1EyPY
** Power BI Training - https://www.edureka.co/power-bi-training **
This Edureka PPT on "Power BI Full Course" will help you understand and learn Power BI in detail. This Power BI Tutorial is ideal for both beginners as well as professionals who want to master up their Power BI concepts.
Power BI vs Tableau | Key features and Comparison 2022 Sparity1
We are the leading iT Software development company in USA. We are the leaders in providing the best Software, Ai Mi, Data science, Data security, QA, UI/UX, RPA, App development, Digital transformation, Cloud and Cyber security services.
Schwettmann Technologies is a global solutions provider. Are devoted to putting great ideas into action, whether you are interested in Microsoft cloud solutions or wish to transform into a digital leader.
A powerful visualization and analysis tool with power apps update power biHeli Thakkar
Looking for analysis tool with PowerApps? Concetto Labs helps to explore a huge data intelligent visualization which indirectly helps streamline your business.
Top 20 Power BI Interview Questions and Answers in 2023.pdfAnanthReddy38
Here are 20 commonly asked Power BI interview questions along with their answers:
What is Power BI?
Power BI is a business analytics tool developed by Microsoft. It allows users to visualize and analyze data from various sources, create interactive reports, and share insights across an organization.
What are the different components of Power BI?
Power BI consists of three main components: Power BI Desktop (for creating reports and visualizations), Power BI Service (for publishing and sharing reports online), and Power BI Mobile (for accessing reports on mobile devices).
What is the difference between Power BI Desktop and Power BI Service?
Power BI Desktop is a Windows application used for creating and designing reports, while Power BI Service is a cloud-based platform where reports can be published, shared, and accessed online.
How can you import data into Power BI?
Data can be imported into Power BI from various sources such as Excel, SQL databases, SharePoint, Azure, and many others. Power BI provides built-in connectors and supports direct query, import, and live connection options.
What is a data model in Power BI?
A data model in Power BI is a collection of tables, relationships, and calculations that define how data is organized and related to each other. It forms the foundation for creating reports and visualizations.
Our experts at Sunflower Lab can create interactive dashboards and reports that transform your business data into intelligent data through the power of Power BI. Imagine if you could see your inventory, backlog, revenue, pipeline, bookings, orders etc. All in one dashboard? And that dashboard would dynamically update with real-time figures? Our experts in Power BI, can help your business leverage its full potential by adding dynamic options like forecasting. This will ensure that the next time you make a decision for your business you make an informed one.
Microsoft Power BI, the powerful analytics tool that has emerged as the leader in business analytics can be your career if you upskill yourself using Power BI Training in Chennai at Credo Systemz. Mainly, Our Power BI Certification Course in Chennai enables the aspirants to master this professional skill set from the basics under the guidance of our Business Intelligence Experts.
Power BI Interview Questions and Answers-Credo systemz.pdfnishajeni1
Microsoft Power BI, the powerful analytics tool that has emerged as the leader in business analytics can be your career if you upskill yourself using Power BI Training in Chennai at Credo Systemz. Mainly, Our Power BI Certification Course in Chennai enables the aspirants to master this professional skill set from the basics under the guidance of our Business Intelligence Experts.
Power BI vs Tableau: Which is Better Business ToolStat Analytica
Still Struggling between the Power BI and Tableau? Here is the in-depth difference between Power BI vs Tableau. With the help of this PDF you will be quite confident to choose the better one as per your requirements.
Top 60 Power BI Interview Questions and Answers for 2023.pdfDatacademy.ai
Description:-
Power BI is a business analytics service provided by Microsoft. It allows users to create reports and dashboards based on various data sources, such as Excel, databases, and online services. With Power BI, users can visualize and analyze their data, and share their insights with others in their organization. Power BI offers a range of features, including data modeling, data visualization, reporting, and collaboration. It is available as a standalone service, or as part of various Office 365 plans. Power BI is designed to be user-friendly, so that people with little or no technical expertise can use it to gain insights from their data.we are provide top 60 Power BI Interview Questions and Answers for 2023.
Visit by :-https://www.datacademy.ai/power-bi-interview-questions/
Opendatabay - Open Data Marketplace.pptxOpendatabay
Opendatabay.com unlocks the power of data for everyone. Open Data Marketplace fosters a collaborative hub for data enthusiasts to explore, share, and contribute to a vast collection of datasets.
First ever open hub for data enthusiasts to collaborate and innovate. A platform to explore, share, and contribute to a vast collection of datasets. Through robust quality control and innovative technologies like blockchain verification, opendatabay ensures the authenticity and reliability of datasets, empowering users to make data-driven decisions with confidence. Leverage cutting-edge AI technologies to enhance the data exploration, analysis, and discovery experience.
From intelligent search and recommendations to automated data productisation and quotation, Opendatabay AI-driven features streamline the data workflow. Finding the data you need shouldn't be a complex. Opendatabay simplifies the data acquisition process with an intuitive interface and robust search tools. Effortlessly explore, discover, and access the data you need, allowing you to focus on extracting valuable insights. Opendatabay breaks new ground with a dedicated, AI-generated, synthetic datasets.
Leverage these privacy-preserving datasets for training and testing AI models without compromising sensitive information. Opendatabay prioritizes transparency by providing detailed metadata, provenance information, and usage guidelines for each dataset, ensuring users have a comprehensive understanding of the data they're working with. By leveraging a powerful combination of distributed ledger technology and rigorous third-party audits Opendatabay ensures the authenticity and reliability of every dataset. Security is at the core of Opendatabay. Marketplace implements stringent security measures, including encryption, access controls, and regular vulnerability assessments, to safeguard your data and protect your privacy.
Techniques to optimize the pagerank algorithm usually fall in two categories. One is to try reducing the work per iteration, and the other is to try reducing the number of iterations. These goals are often at odds with one another. Skipping computation on vertices which have already converged has the potential to save iteration time. Skipping in-identical vertices, with the same in-links, helps reduce duplicate computations and thus could help reduce iteration time. Road networks often have chains which can be short-circuited before pagerank computation to improve performance. Final ranks of chain nodes can be easily calculated. This could reduce both the iteration time, and the number of iterations. If a graph has no dangling nodes, pagerank of each strongly connected component can be computed in topological order. This could help reduce the iteration time, no. of iterations, and also enable multi-iteration concurrency in pagerank computation. The combination of all of the above methods is the STICD algorithm. [sticd] For dynamic graphs, unchanged components whose ranks are unaffected can be skipped altogether.
Chatty Kathy - UNC Bootcamp Final Project Presentation - Final Version - 5.23...John Andrews
SlideShare Description for "Chatty Kathy - UNC Bootcamp Final Project Presentation"
Title: Chatty Kathy: Enhancing Physical Activity Among Older Adults
Description:
Discover how Chatty Kathy, an innovative project developed at the UNC Bootcamp, aims to tackle the challenge of low physical activity among older adults. Our AI-driven solution uses peer interaction to boost and sustain exercise levels, significantly improving health outcomes. This presentation covers our problem statement, the rationale behind Chatty Kathy, synthetic data and persona creation, model performance metrics, a visual demonstration of the project, and potential future developments. Join us for an insightful Q&A session to explore the potential of this groundbreaking project.
Project Team: Jay Requarth, Jana Avery, John Andrews, Dr. Dick Davis II, Nee Buntoum, Nam Yeongjin & Mat Nicholas
Explore our comprehensive data analysis project presentation on predicting product ad campaign performance. Learn how data-driven insights can optimize your marketing strategies and enhance campaign effectiveness. Perfect for professionals and students looking to understand the power of data analysis in advertising. for more details visit: https://bostoninstituteofanalytics.org/data-science-and-artificial-intelligence/
1. RAMAR BOSE
Research scholar, ANNA
UNIVERSITY
Ramar Bose
Research Scholar,
Anna University, Tamil Nadu.
Introduction to Power BI
2. WHAT IS POWER BI?
2
Power BI is a collection of software services, apps, and connectors
that work together to turn your unrelated sources of data into coherent,
visually immersive, and interactive insights.
4. HOW POWER BI MATCHES YOUR ROLE
How you use Power BI may depend on your role in a project or on a team.
And other people, in other roles, might use Power BI differently, which is just
fine.
You might primarily use the Power BI service, but your number-crunching,
business-report-creating coworker might make extensive use of Power BI
Desktop (and publish Desktop reports to the Power BI service, which you
then view). And another coworker, in sales, might mainly use her Power BI
phone app to monitor progress on her sales quotas, and to drill into new sales
lead details.
4
5. THE FLOW OF WORK IN POWER BI
A common flow of work in Power BI begins in Power BI
Desktop, where a report is created. That report is then
published to the Power BI service, and then shared so users
of Power BI Mobile apps can consume the information.
5
6. USING POWER BI
6
• Bring data into Power BI
Desktop, and create a report.
• Publish to the Power BI
service, where you create
new visualizations or build
dashboards
• Share your dashboards with
others, especially people
who are on the go
• View and interact with
shared dashboards and
reports in Power BI Mobile
apps
THE COMMON FLOW OF ACTIVITY
7. BUILDING BLOCKS OF POWER BI
7
THE BASIC BUILDING BLOCKS IN POWER BI ARE THE
FOLLOWING:
VISUALIZATIONS
DATASETS
REPORTS
DASHBOARDS
TILES
11. DASHBOARDS
A dashboard has to fit on a single page, often called a canvas (the canvas is
the blank backdrop in Power BI Desktop, or the service, where you place
visualizations). Think of it like the canvas that an artist or painter uses – a
workspace where you create, combine, and rework interesting and
compelling visuals. You can share dashboards with other users or groups,
who can then interact with your dashboard when they’re in Power BI service,
or on their mobile device.
11
13. A QUICK LOOK AT THE POWER BI SERVICE
A content pack is a collection of pre-configured, ready-made visuals and
reports based on specific data sources, such as Salesforce. Using a content
pack is like microwaving a TV dinner or ordering a fast-food value meal: with
just a few clicks and comments, you're quickly served up a collection of
entrees designed to go well together, all presented in a tidy, ready-to-
consume package.
13
24. WE DISCUSSED THE BASIC BUILDING BLOCKS
IN POWER BI TOO, WHICH ARE
• Visualizations – a visual representation of data, sometimes just called visuals
• Datasets – a collection of data that Power BI uses to create visualizations
• Reports – a collection of visuals from a dataset, spanning one or more pages
• Dashboards – a single page collection of visuals, built from a report
• Tiles – a single visualization found in a report or dashboard
24
Thank You.!
Ramar Bose,
Research Scholar,
bsramar@gmail.com
Anna University, Tamil Nadu.
Editor's Notes
Power BI consists of a Windows desktop application called Power BI Desktop, an online SaaS (Software as a Service) service called the Power BI service, and mobile Power BI apps available on Windows phones and tablets, as well as for iOS and Android devices.
A visualization (sometimes also referred to as a visual) is a visual representation of data, such as a chart, a graph, a color-coded map, or other interesting things you can create to represent your data visually. Power BI has all sorts of different visualization types, and more coming all the time. The following image shows a collection of different visualizations that were created in the Power BI service.
Datasets can also be a combination of many different sources, which you can filter and combine to provide a unique collection data (a dataset) for use in Power BI.
For example, you could create a dataset from three different database fields, one website table, an Excel table, and online results of an email marketing campaign. That unique combination is still considered a single dataset, even though it was pulled together from many different sources.
In Power BI, a report is a collection of visualizations that appear together on one or more pages. Just like any other report you might create for a sales presentation, or a report you would write for a school assignment, in Power BI a report is a collection of items that are related to one another.
A tile is a single visualization found in a report or on a dashboard. It’s the rectangular box that contains each individual visual.
The canvas (the area in the center of the Power BI service) shows you the available sources of data in the Power BI service. In addition to common data sources such as Excel files, databases, or Azure data, Power BI can connect to software services (also called SaaS providers, or cloud services) such as Salesforce, Facebook, Google Analytics, and a whole assortment of other SaaS services just as easily.