Downloaded 117 times


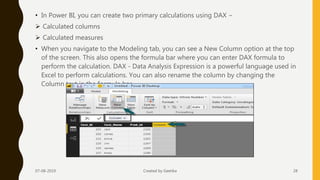
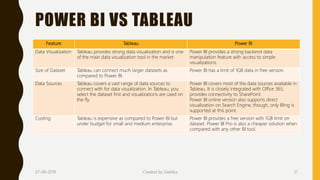
![• In the following example, we have created a new column: Product Code (Product_C),
which is derived from the last 3 characters of Prod_Id column. Following is the formula
−
• To create a calculated measure, navigate to New Measure tab under Modeling. This
will add a new object under the Fields tab with the name Measure.
07-08-2019 Created by Geetika 29
Product_C = RIGHT( Sheet1[Prod_Id],3)](https://image.slidesharecdn.com/su1esysvqwekbsbmel7m-signature-16b31420c9f42b942fe814bf64382f95dd079aaa519507f0cdcebf2dce170d3b-poli-190807103539/85/Microsoft-Power-BI-29-320.jpg)


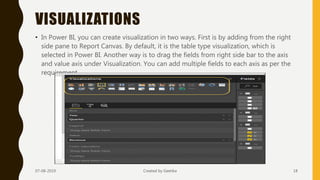
The document provides an overview of Microsoft Power BI, a business analytics service that offers interactive visualizations and business intelligence tools. It outlines features and components such as content packs, natural language queries, and the ability to connect to various data sources, alongside comparisons to Tableau regarding capabilities and pricing. Power BI enables users to create, publish, and share reports and dashboards efficiently, while also offering functionalities for data visualization and analysis using DAX.


![5G Explained! A High Level Overview [Introduction]](https://cdn.slidesharecdn.com/ss_thumbnails/5gexplainedahighleveloverview-260119165306-cc137a3e-thumbnail.jpg?width=640&height=640&fit=bounds)


