Downloaded 119 times

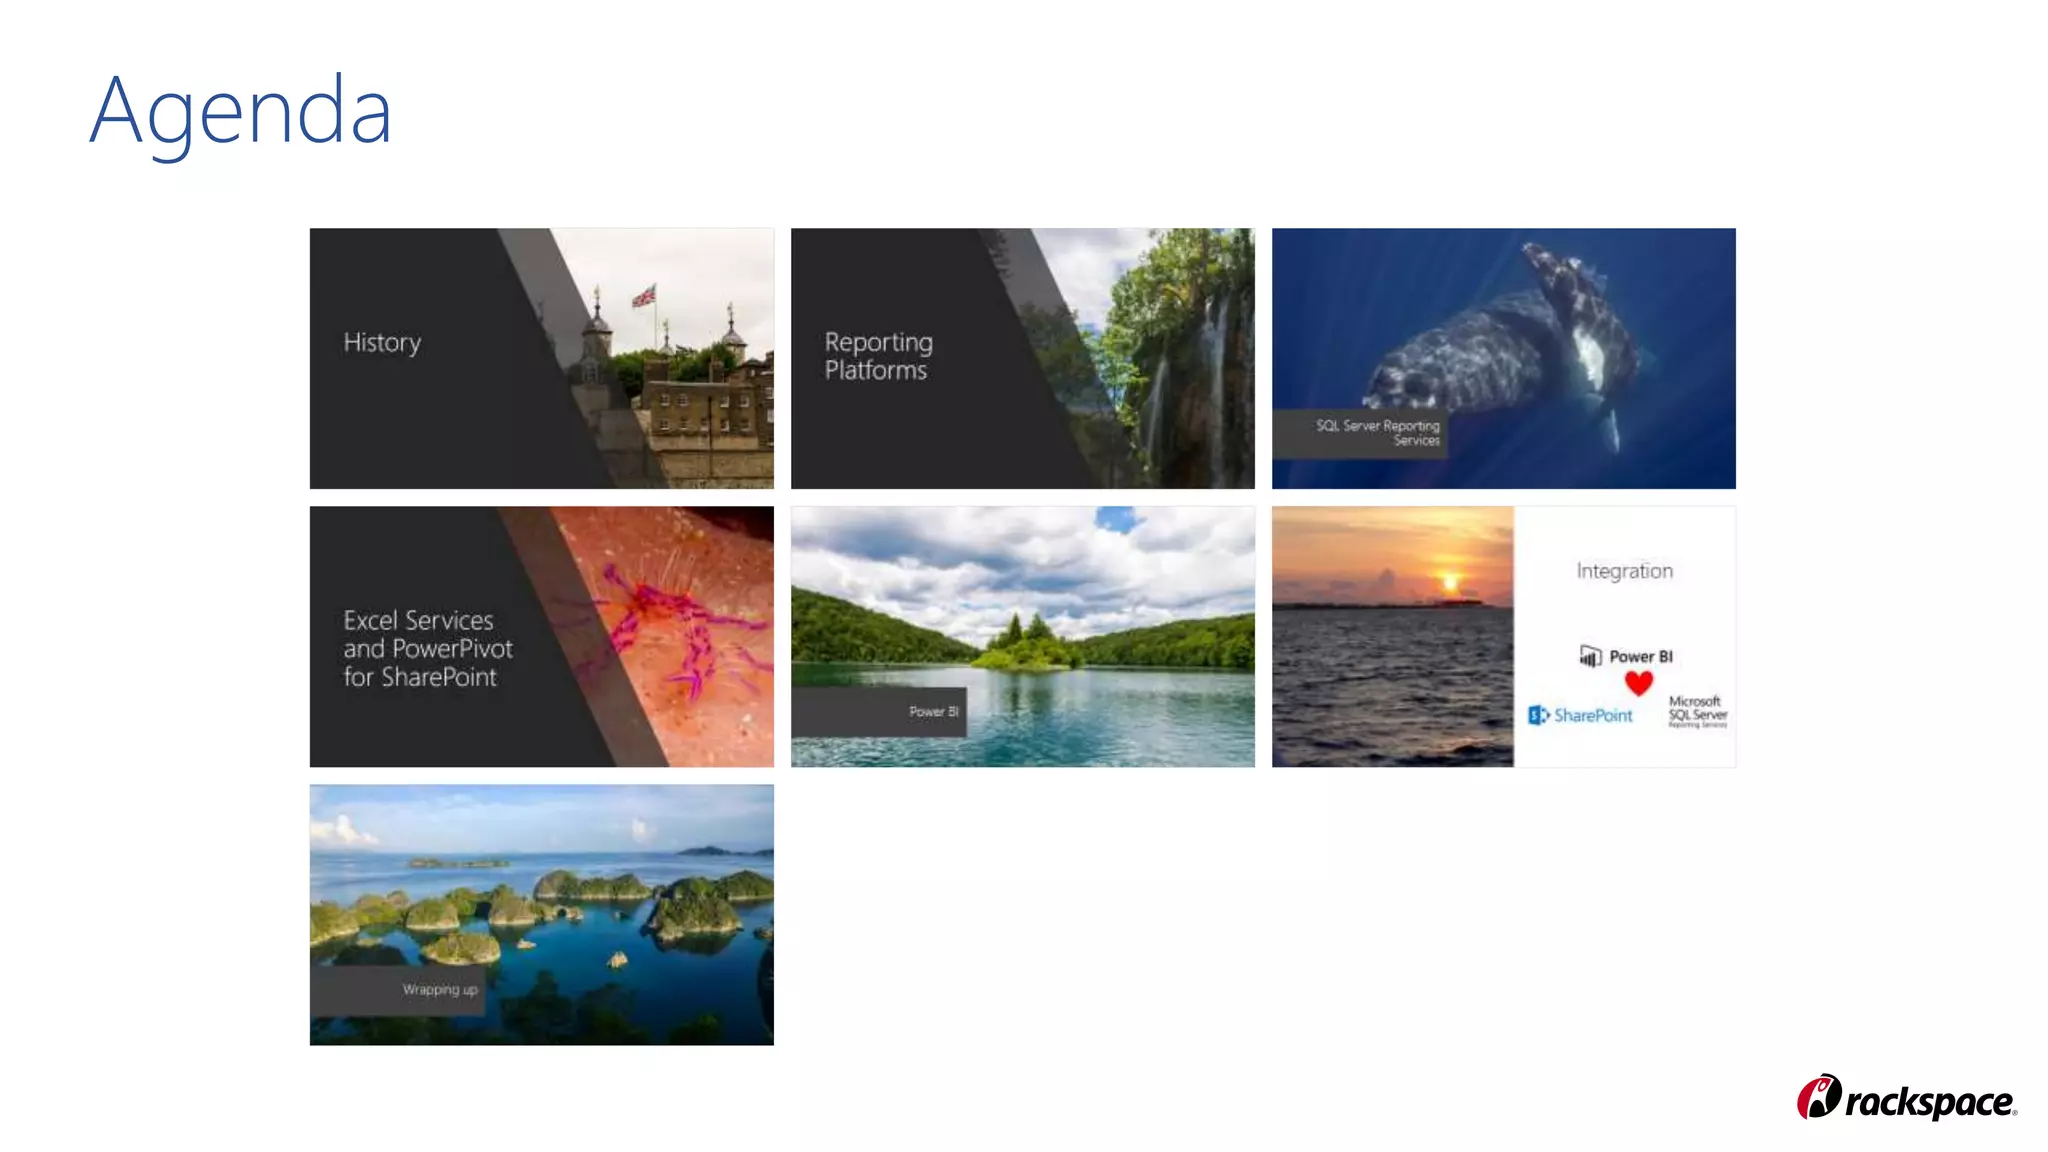

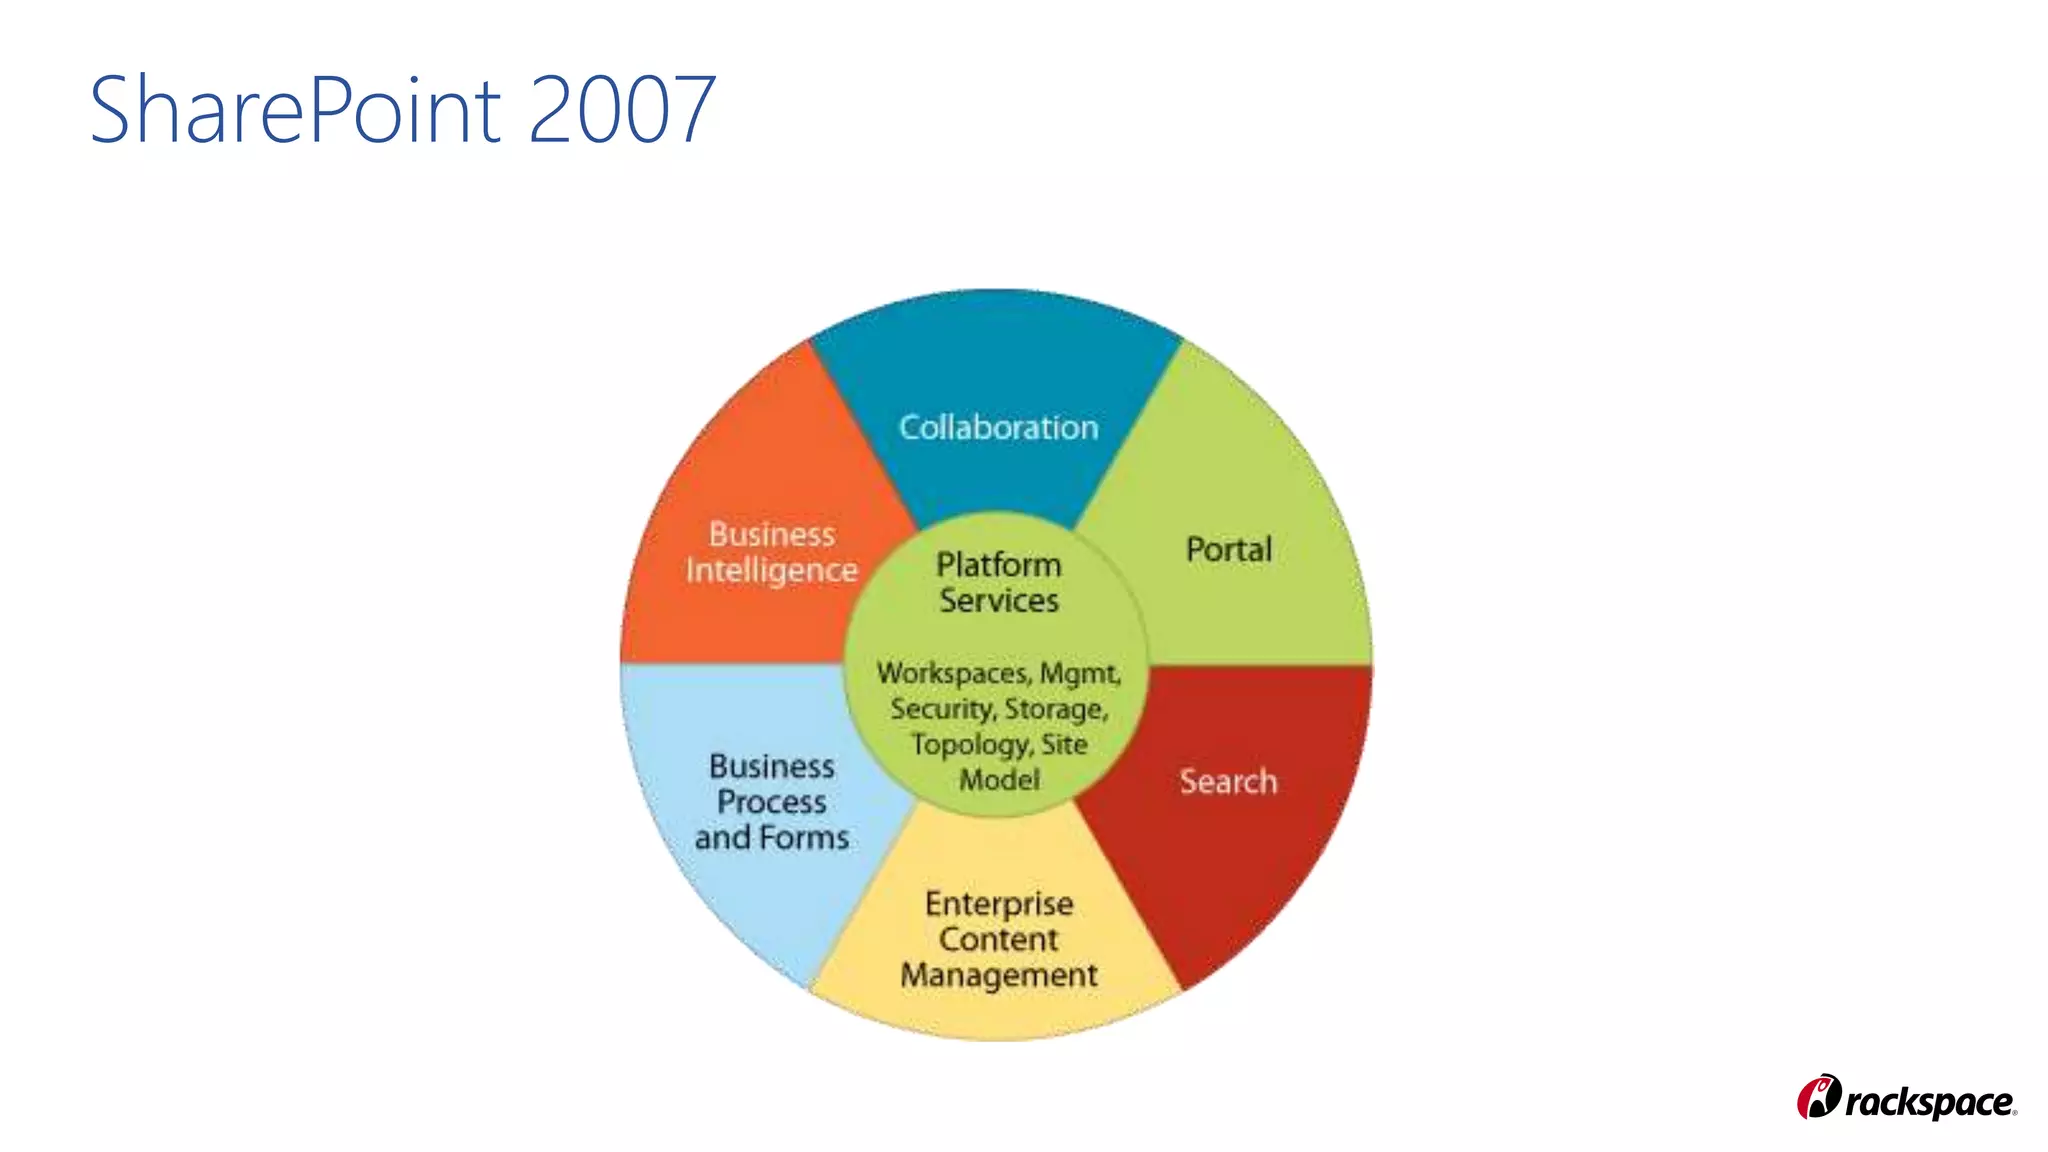
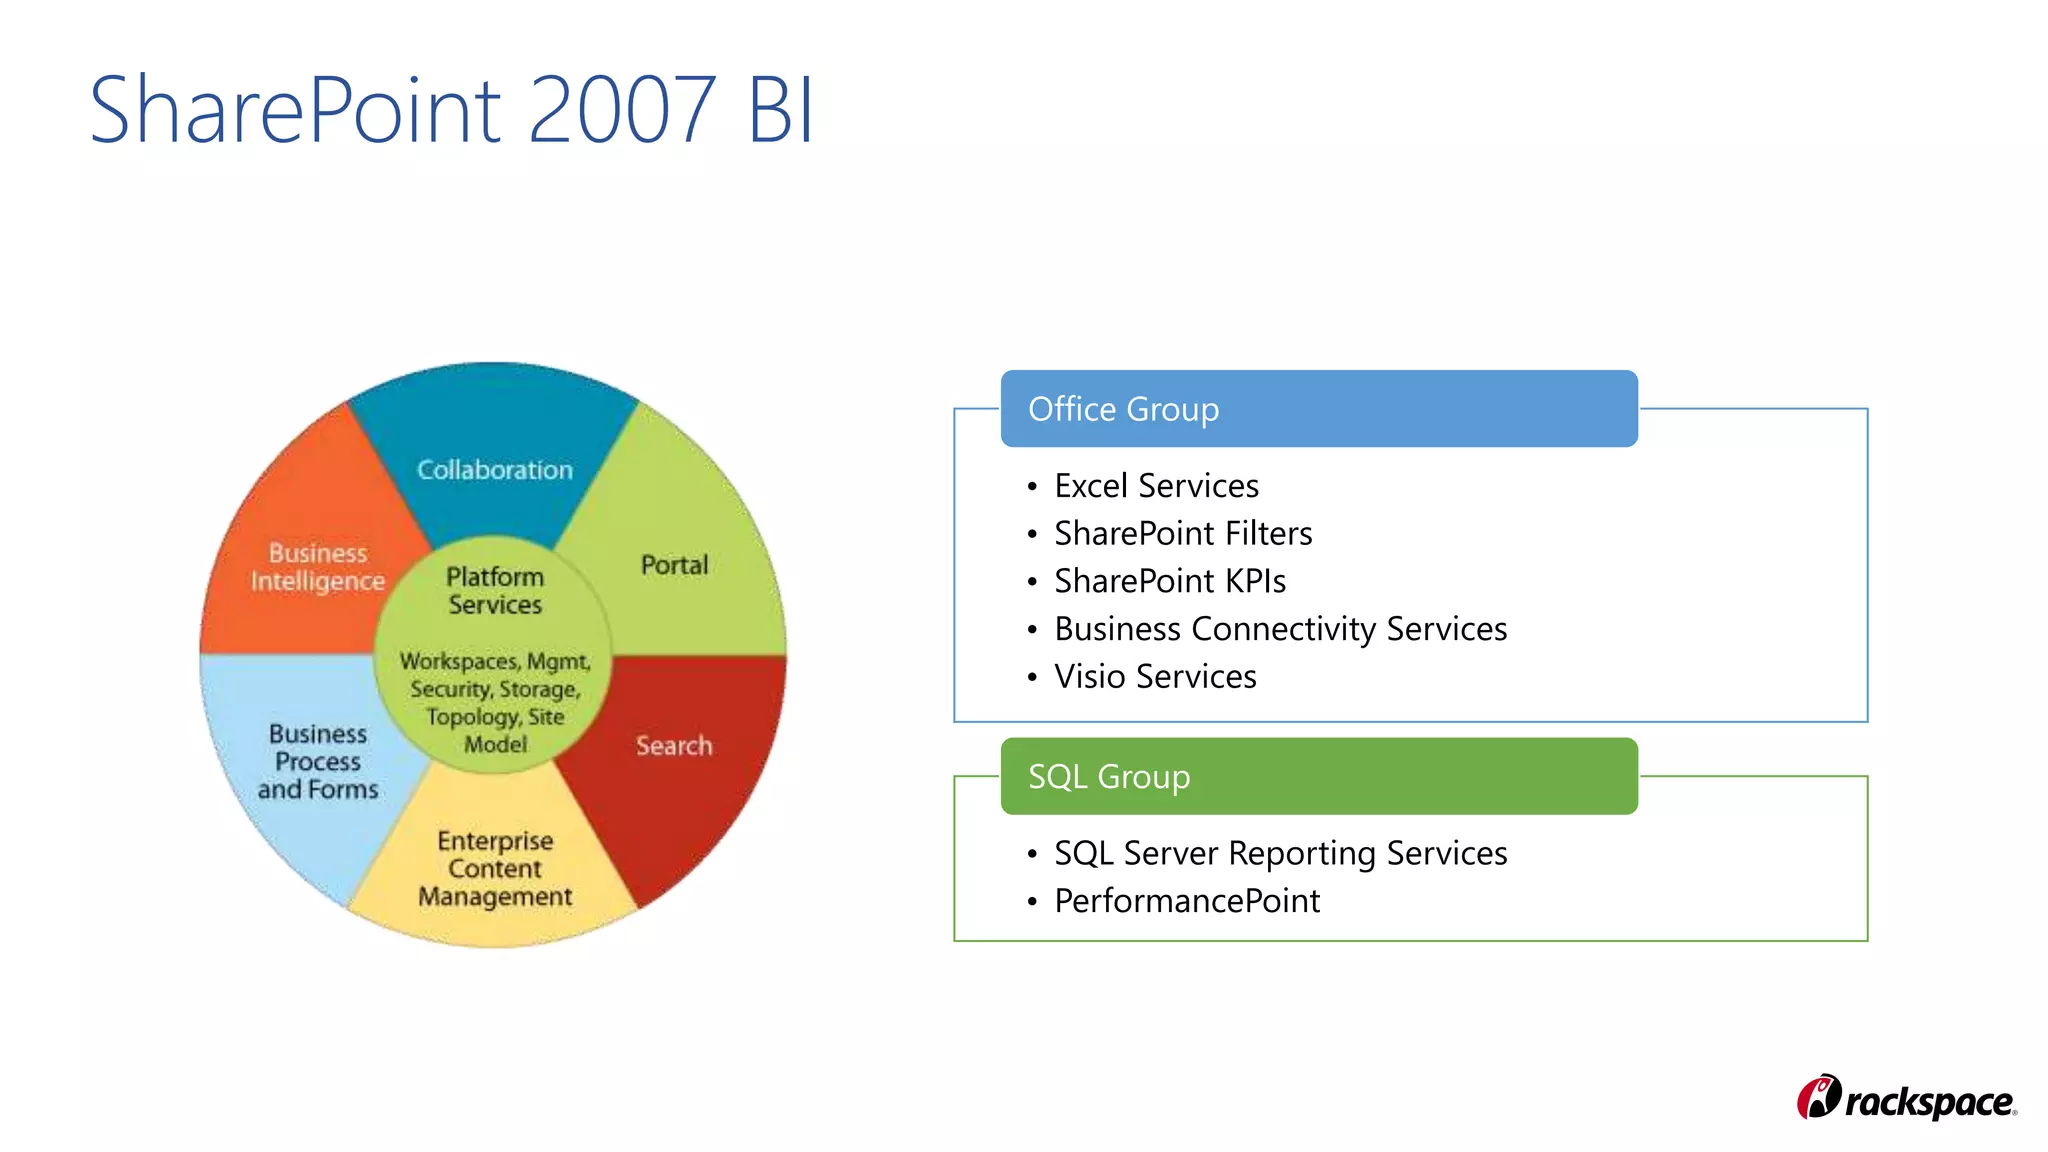
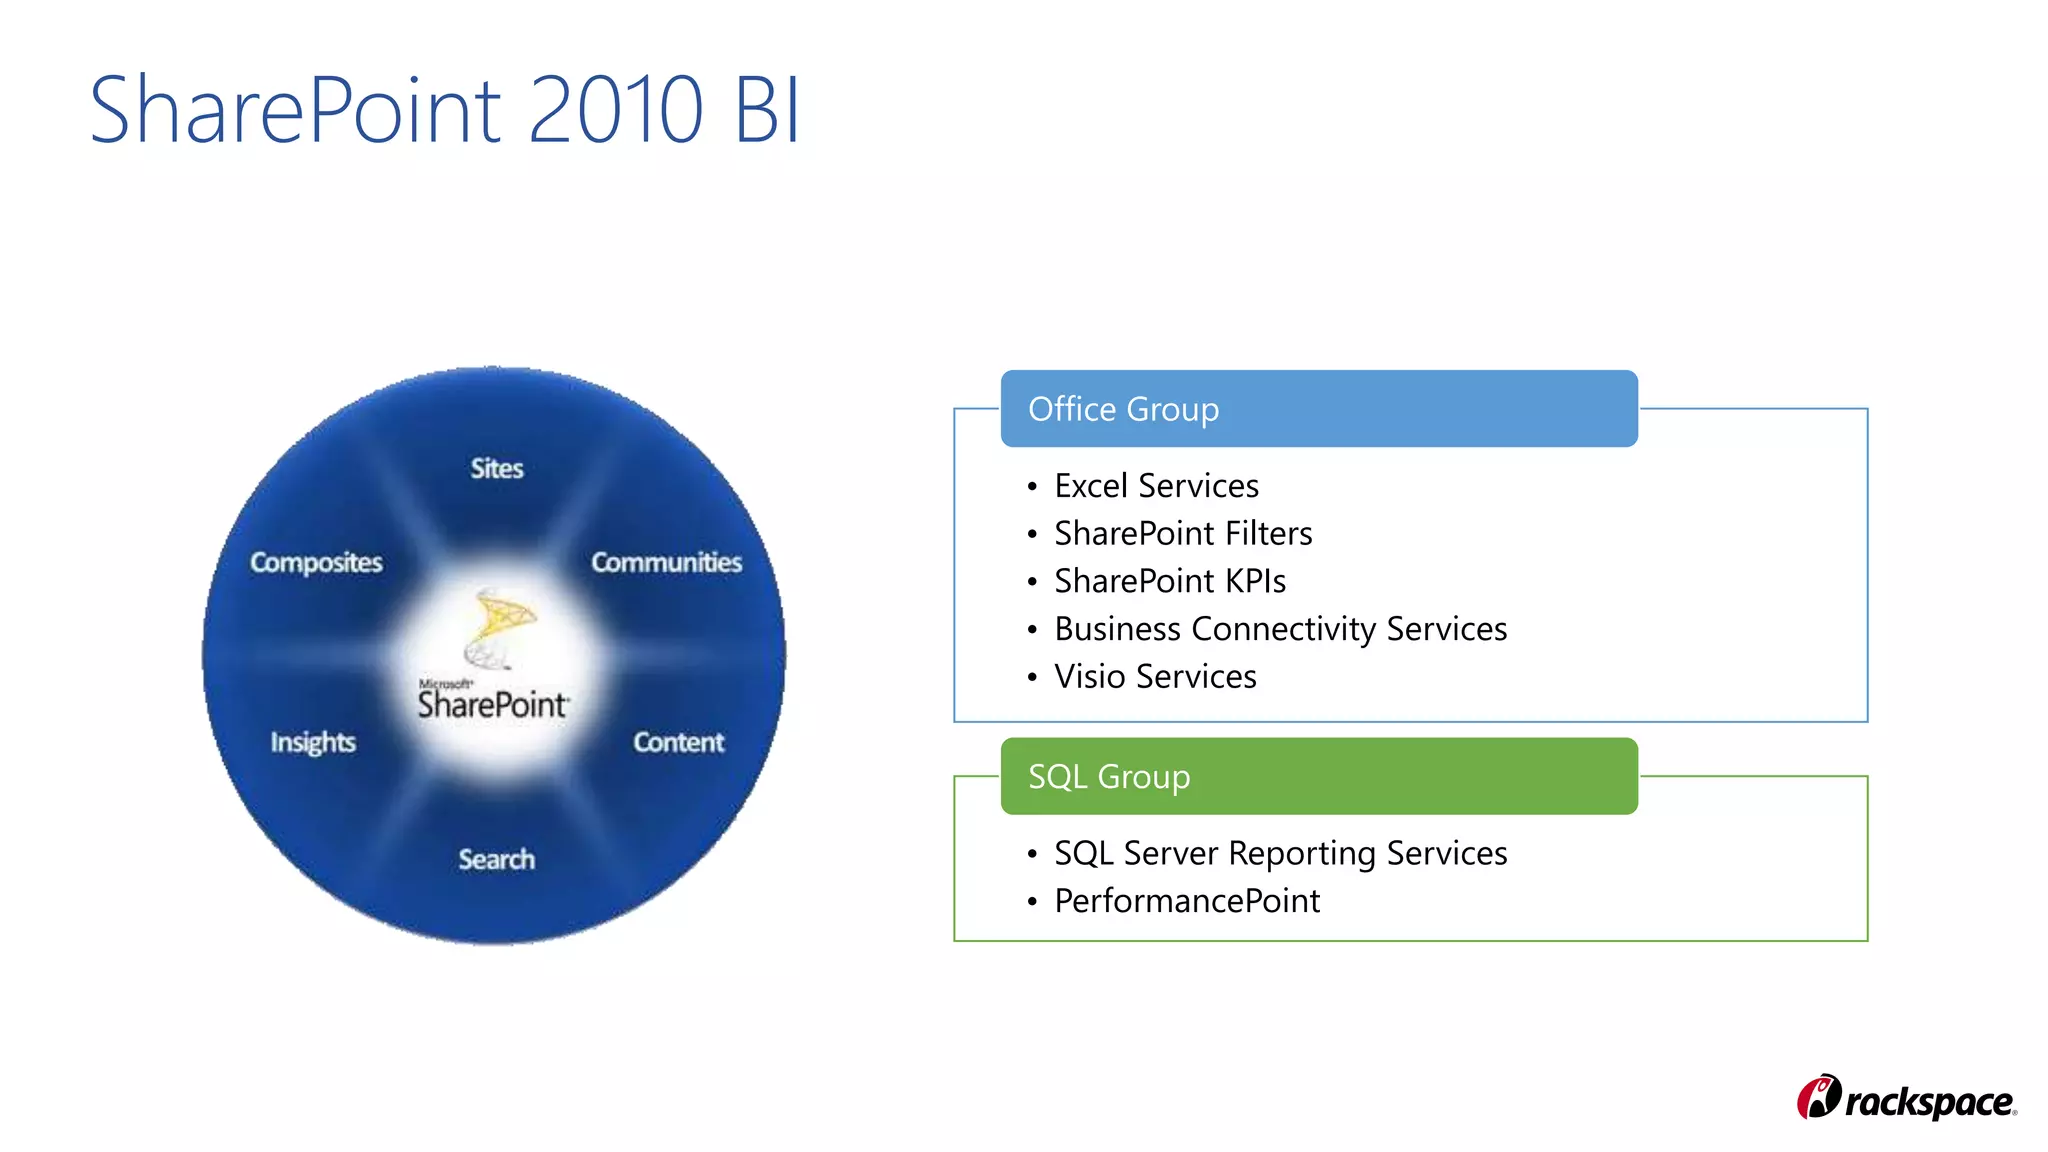
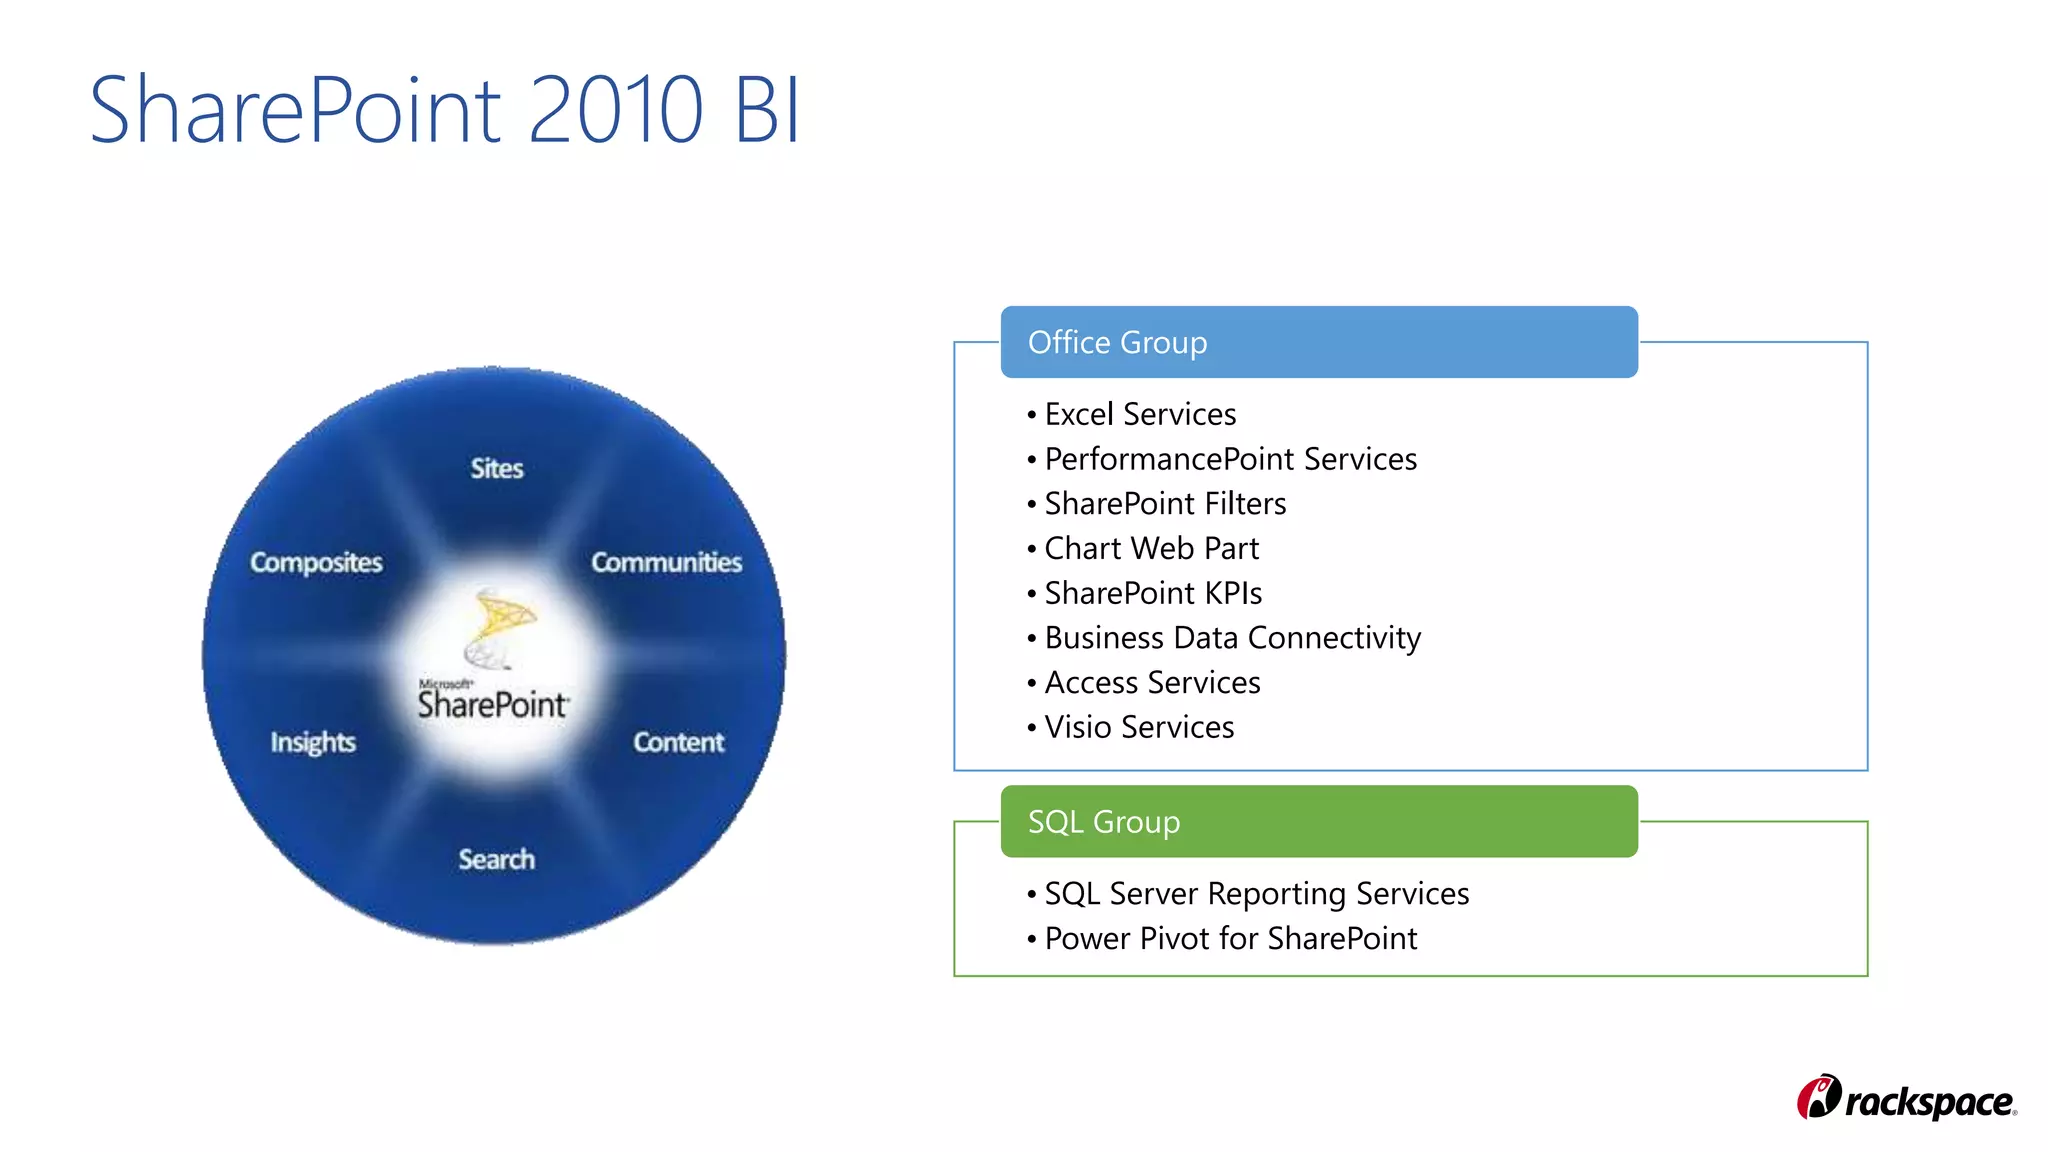
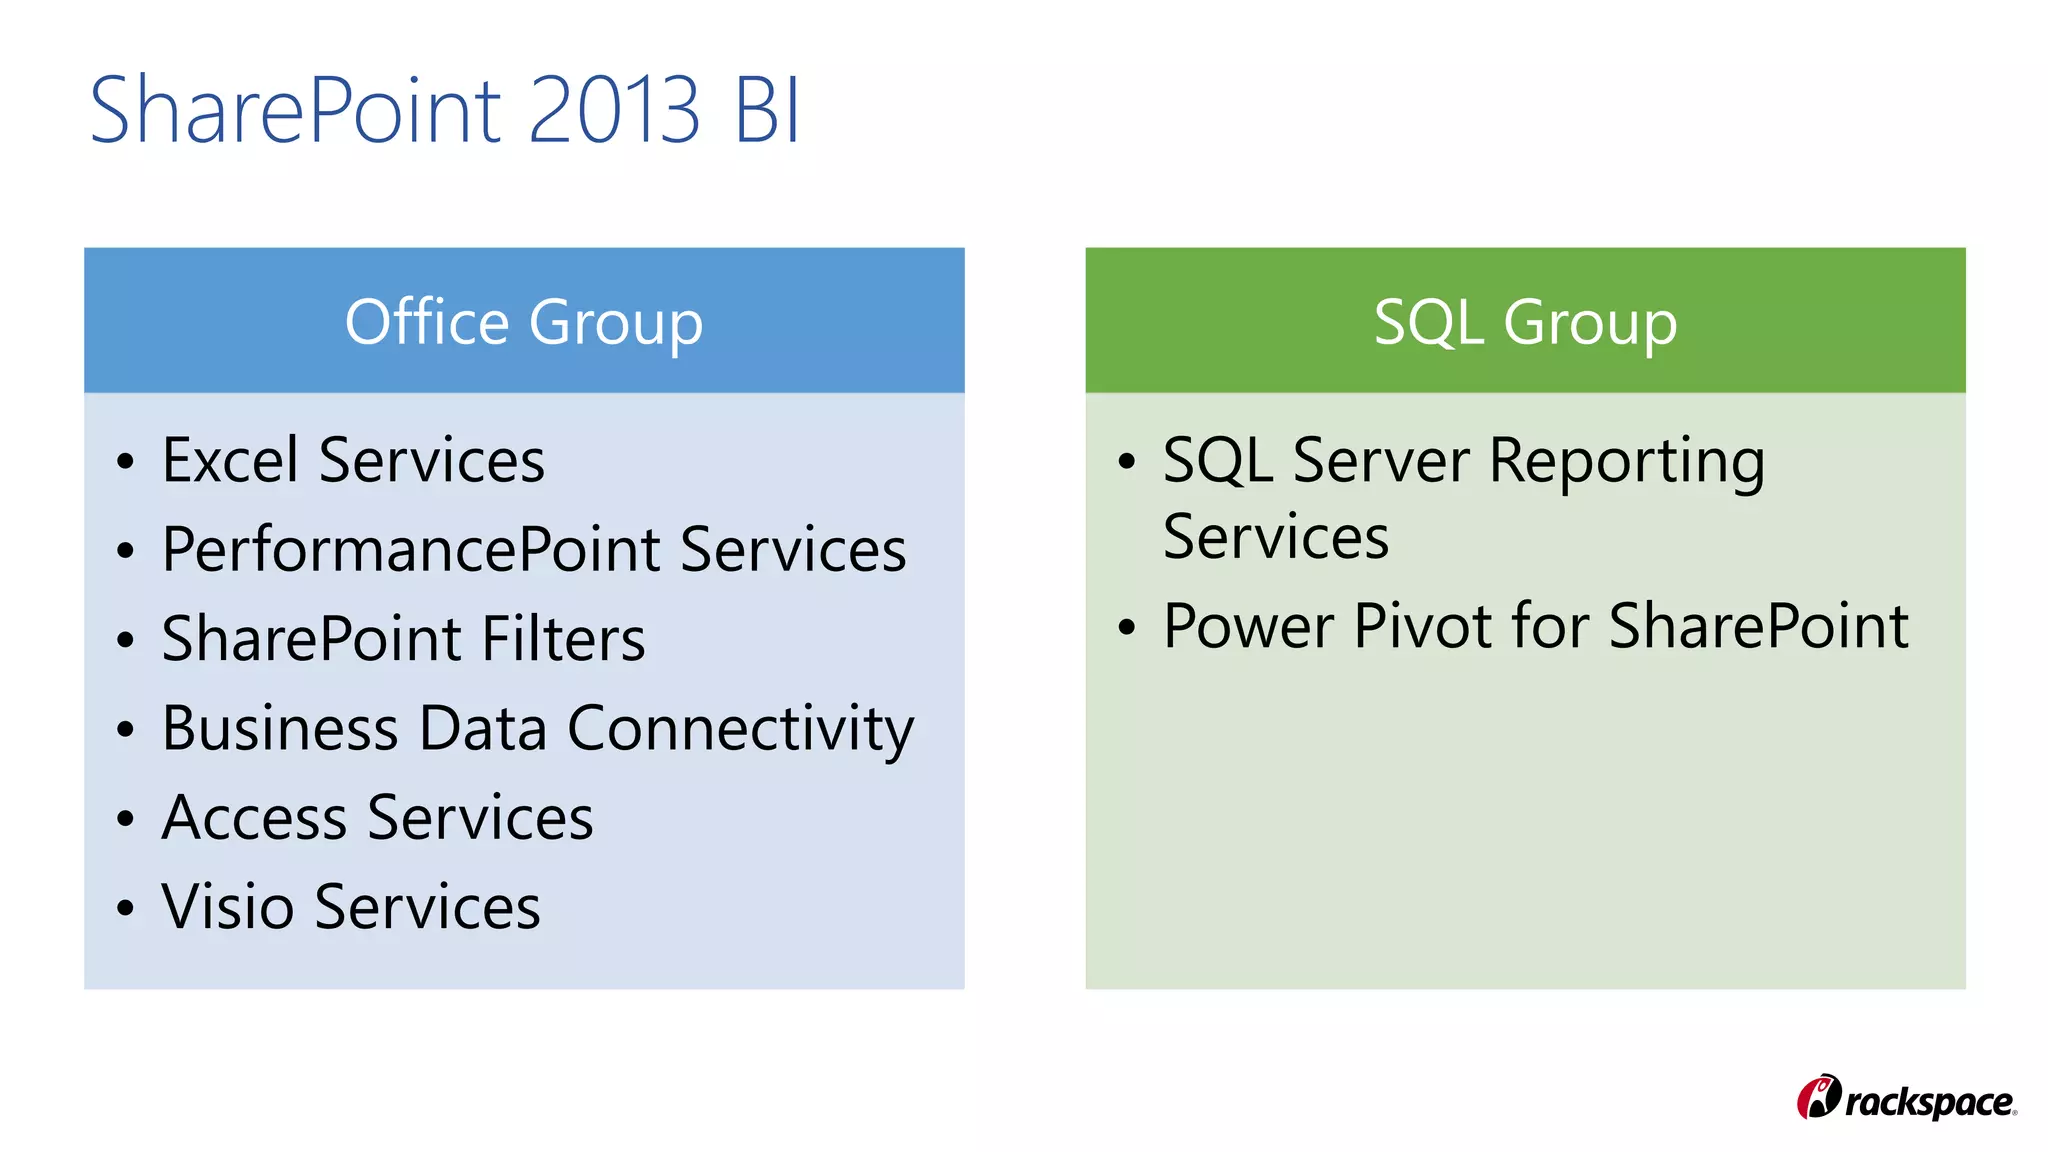
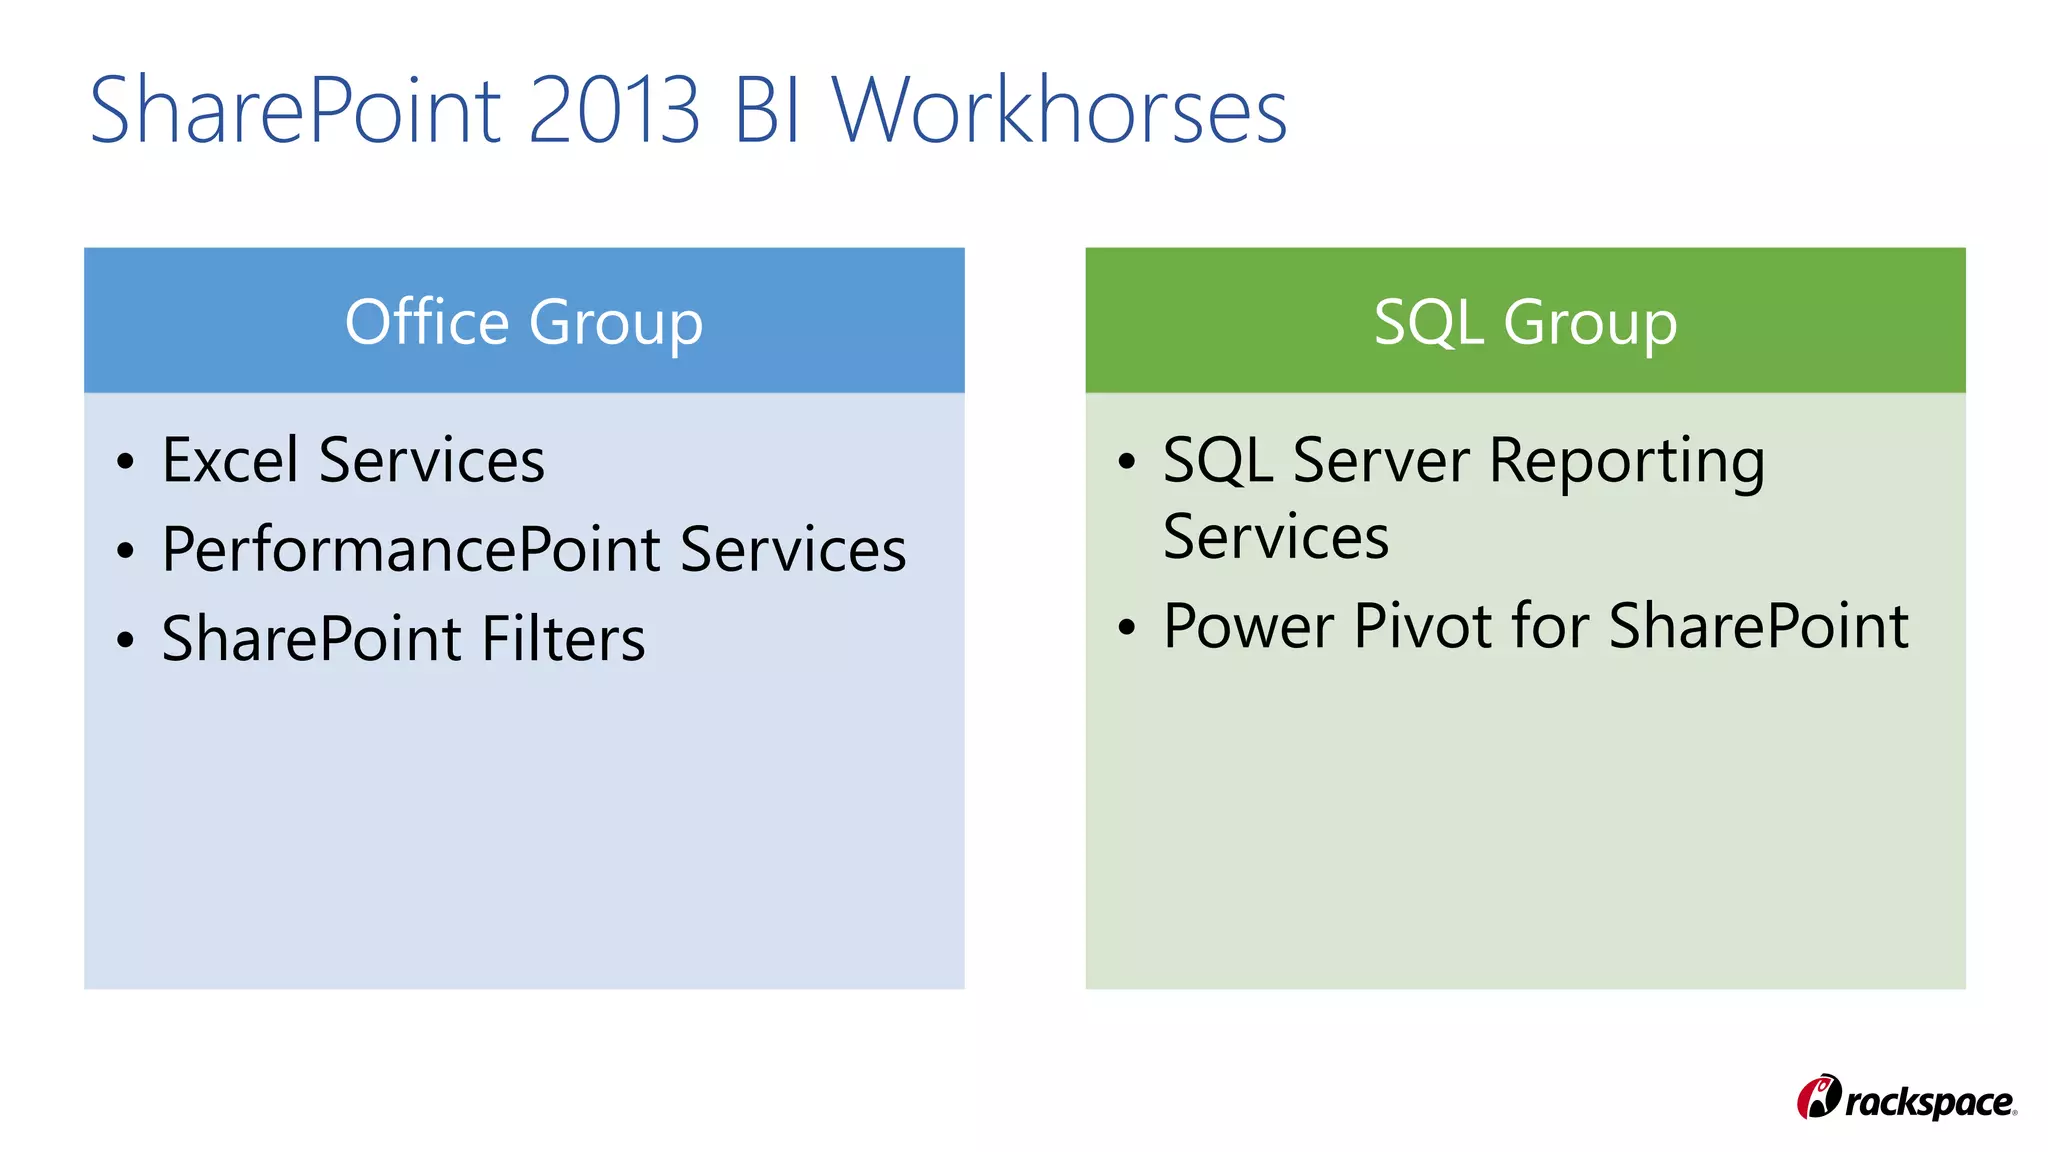
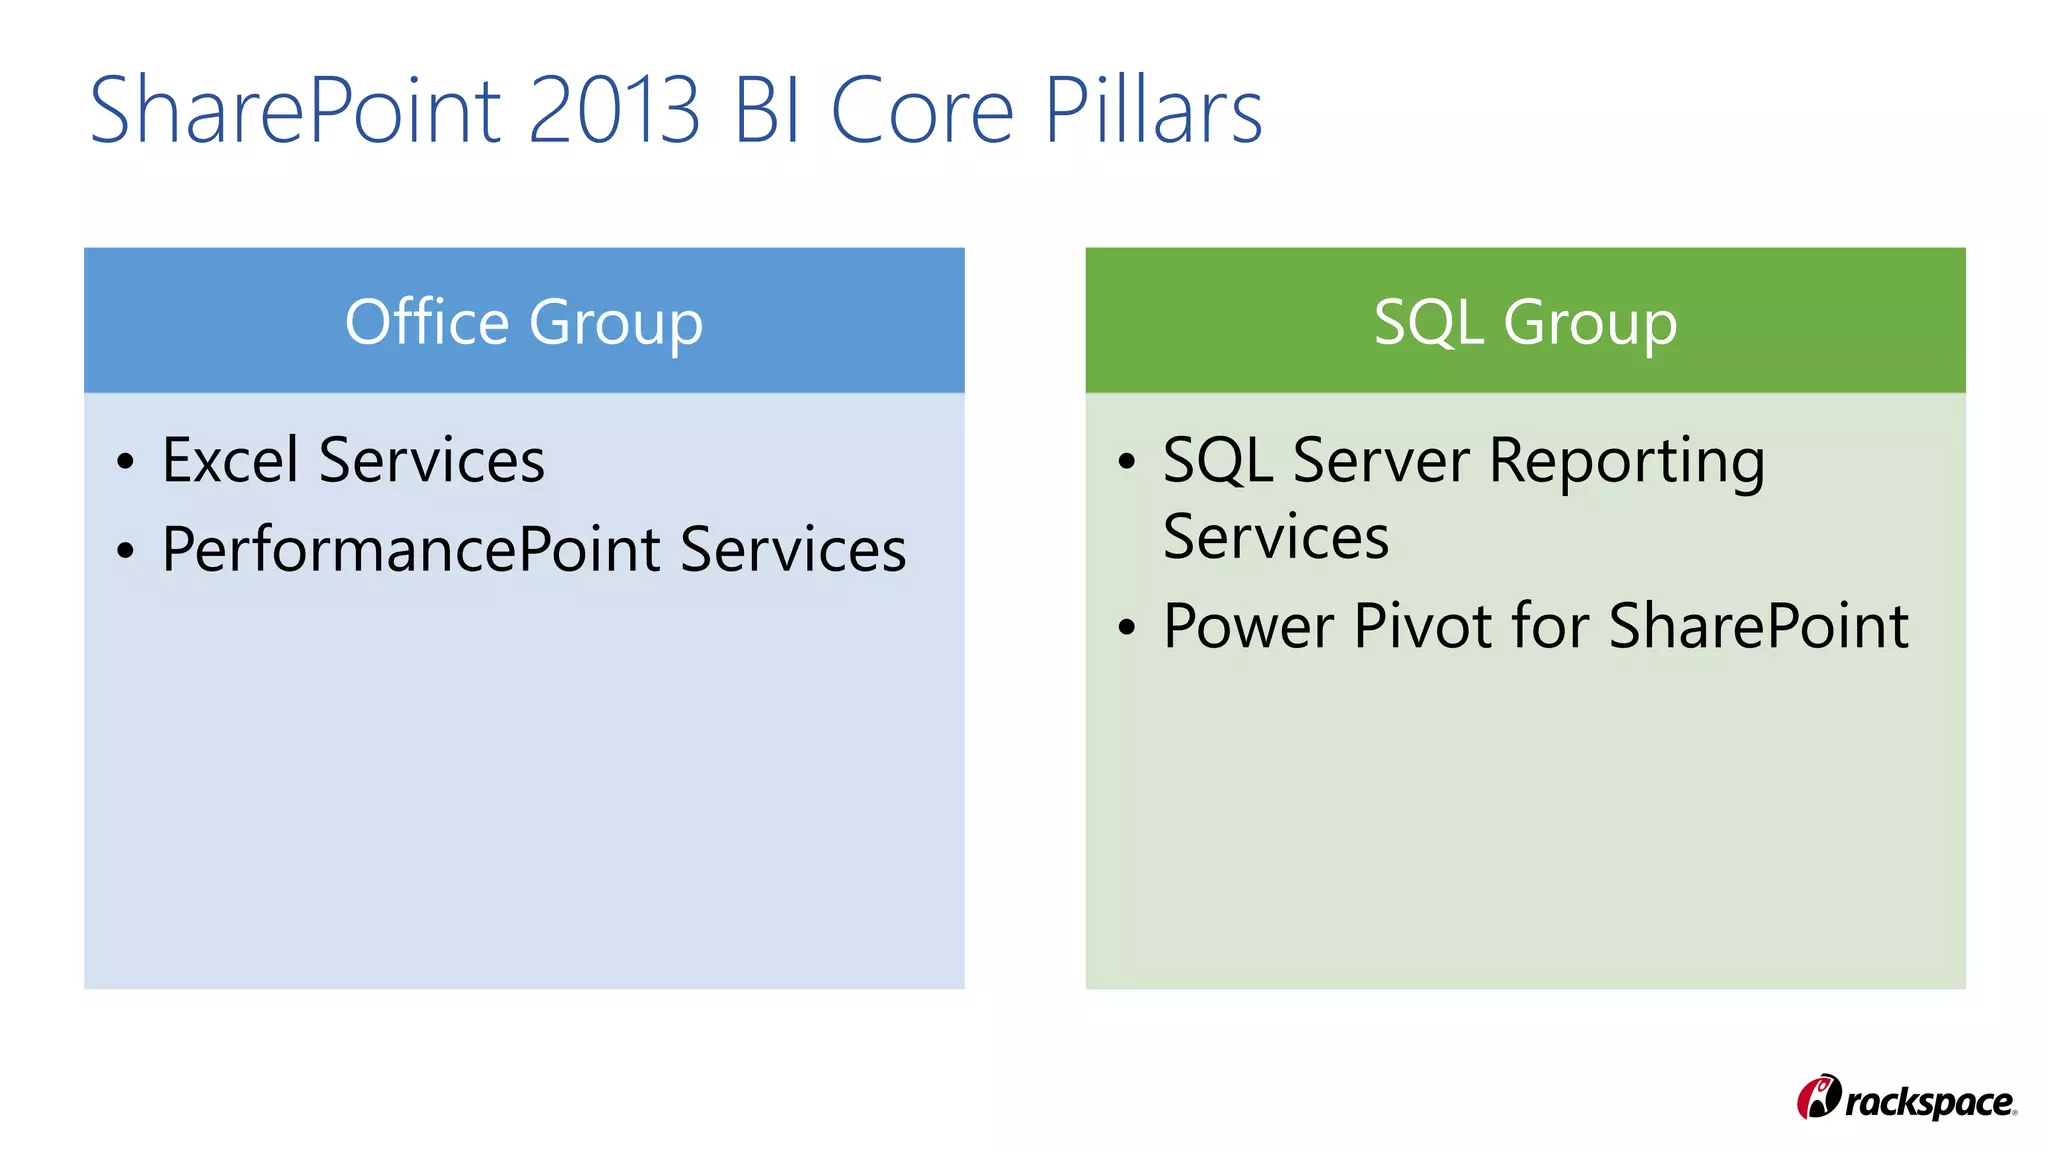
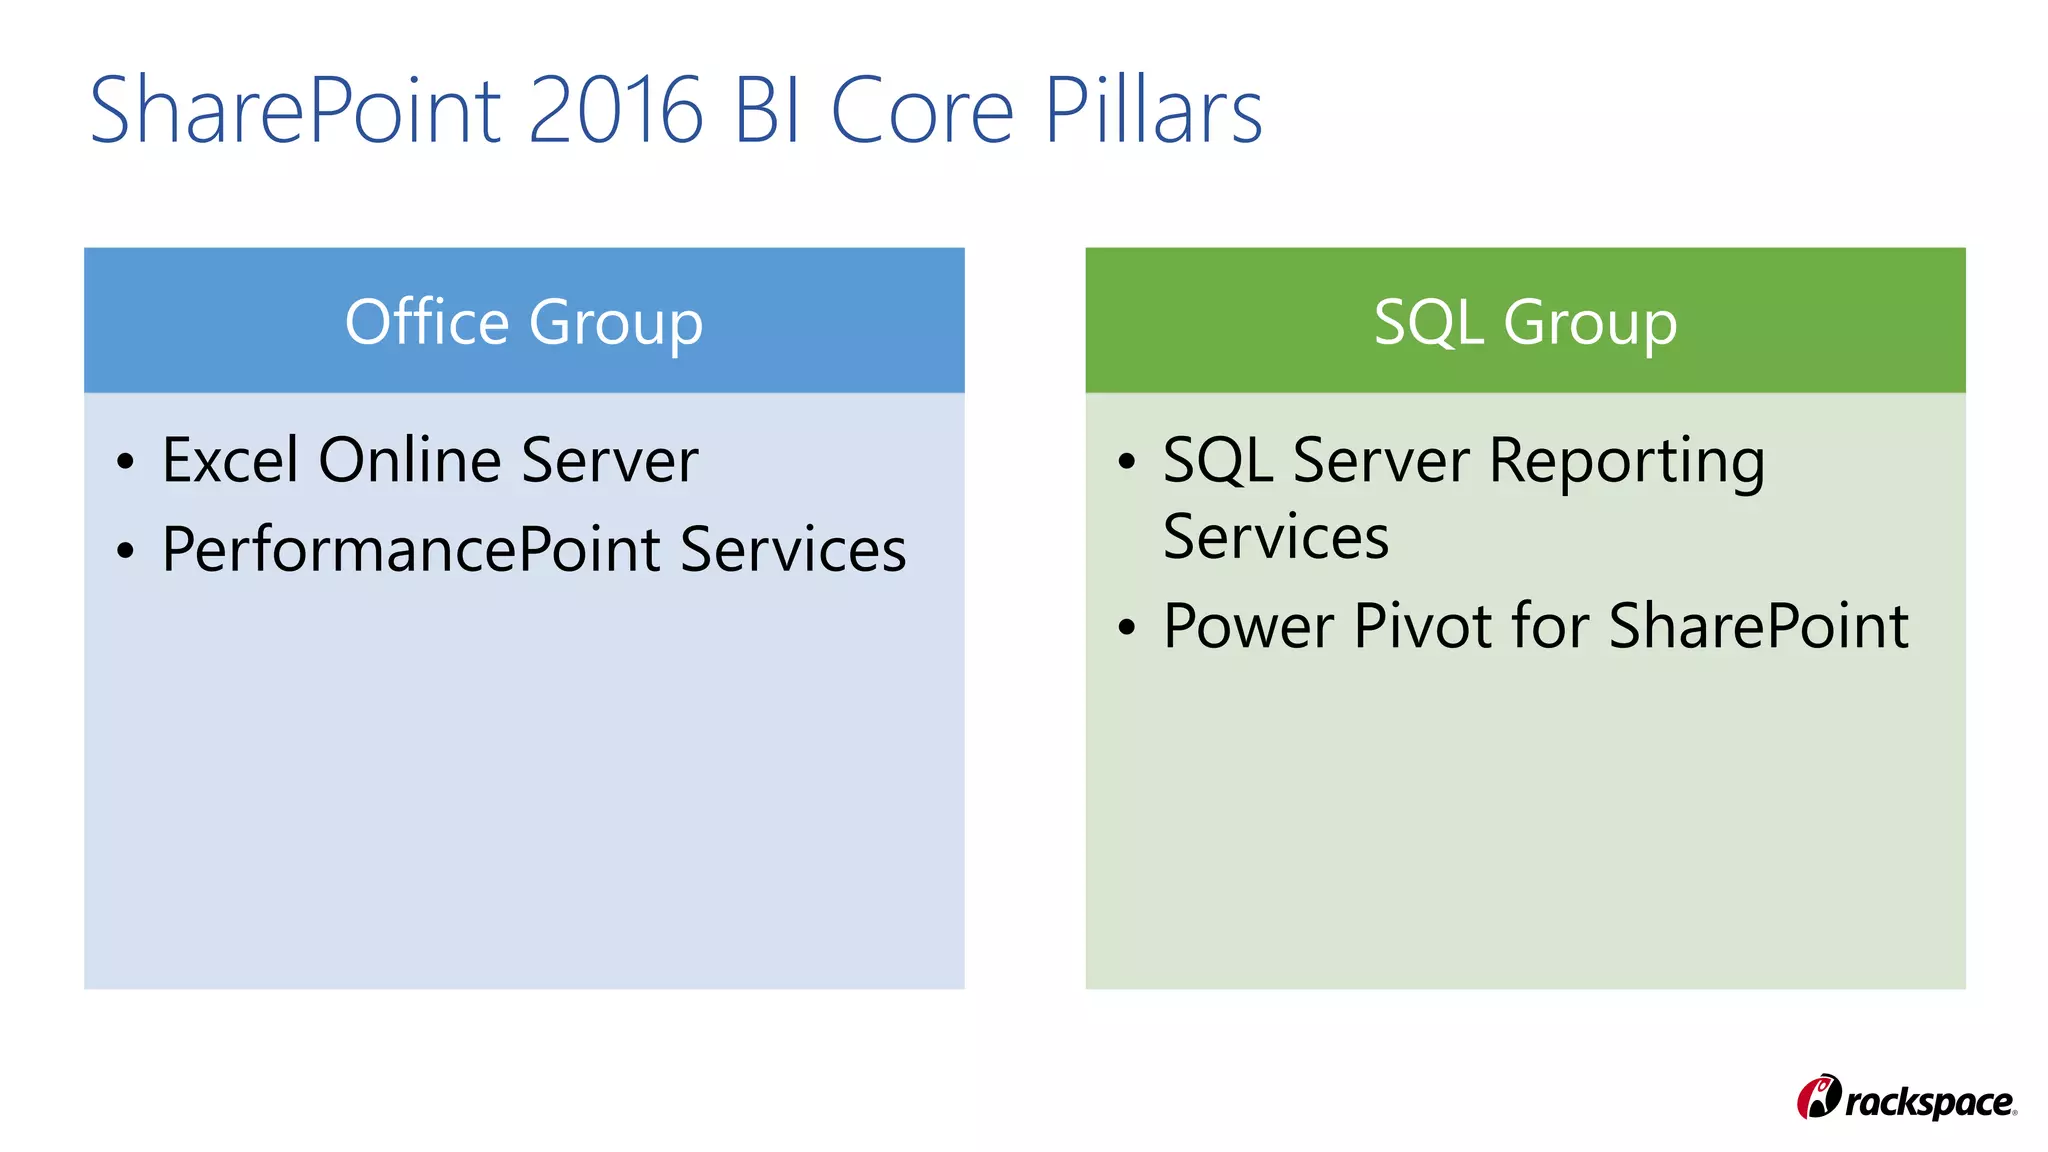
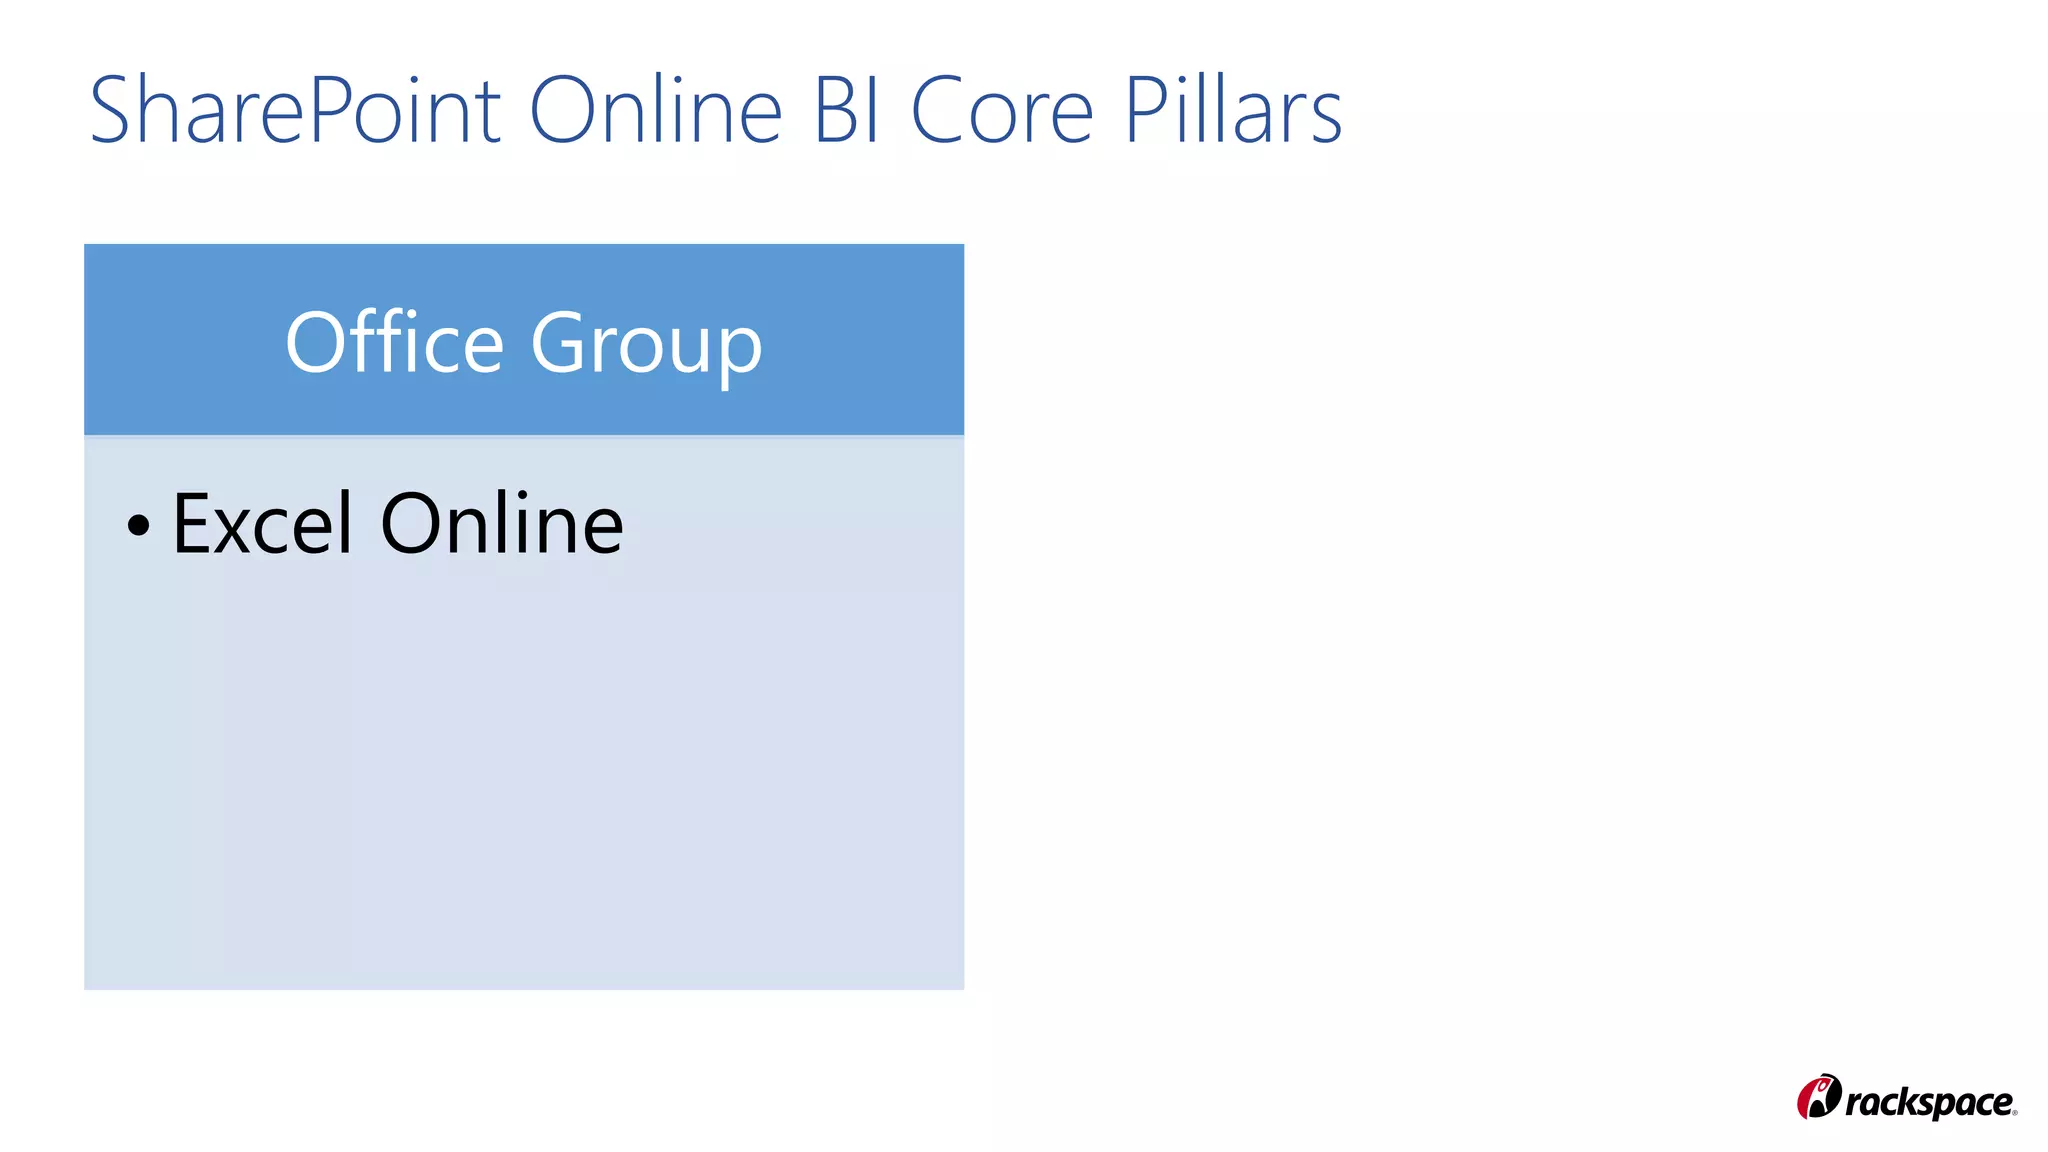
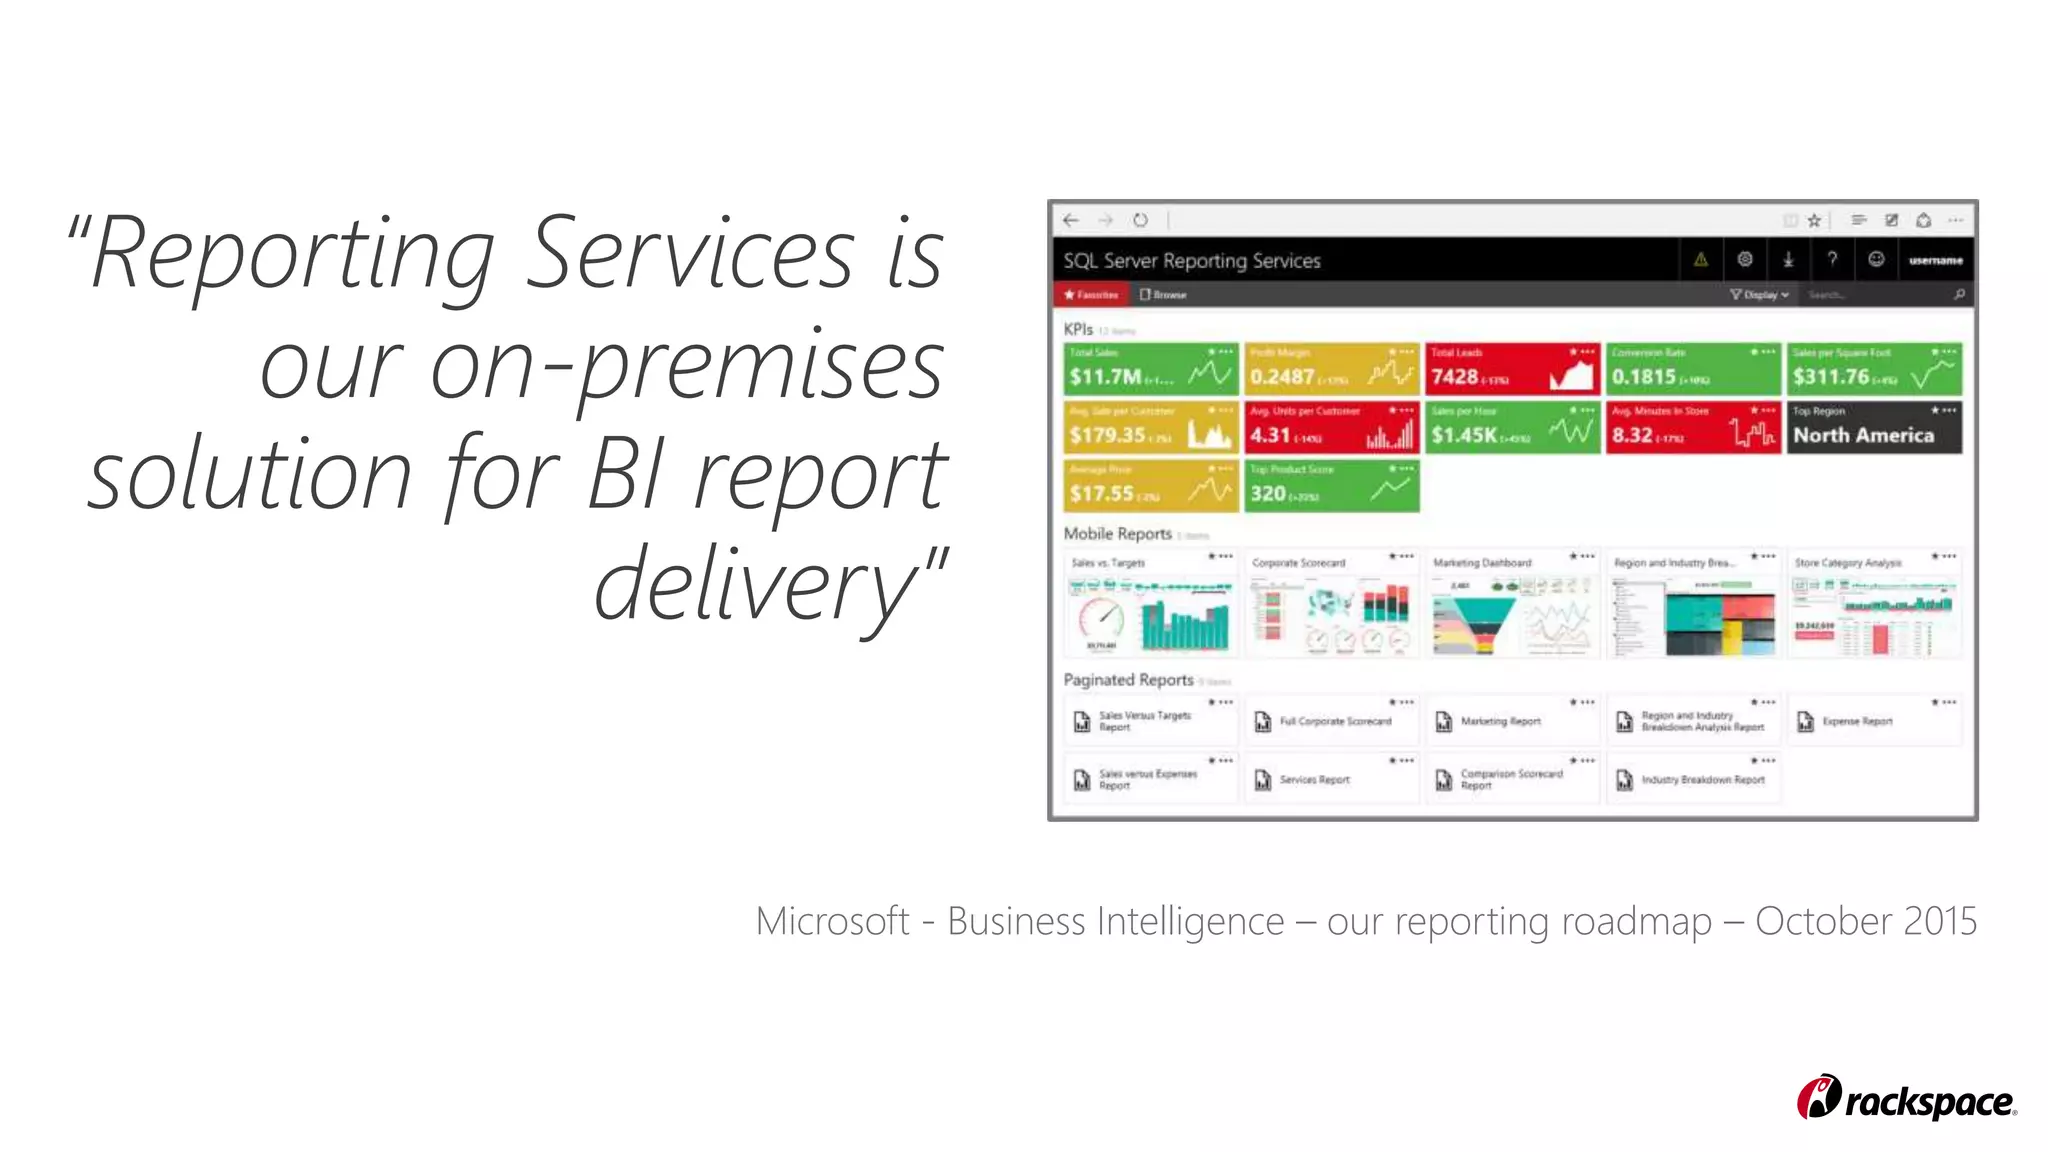
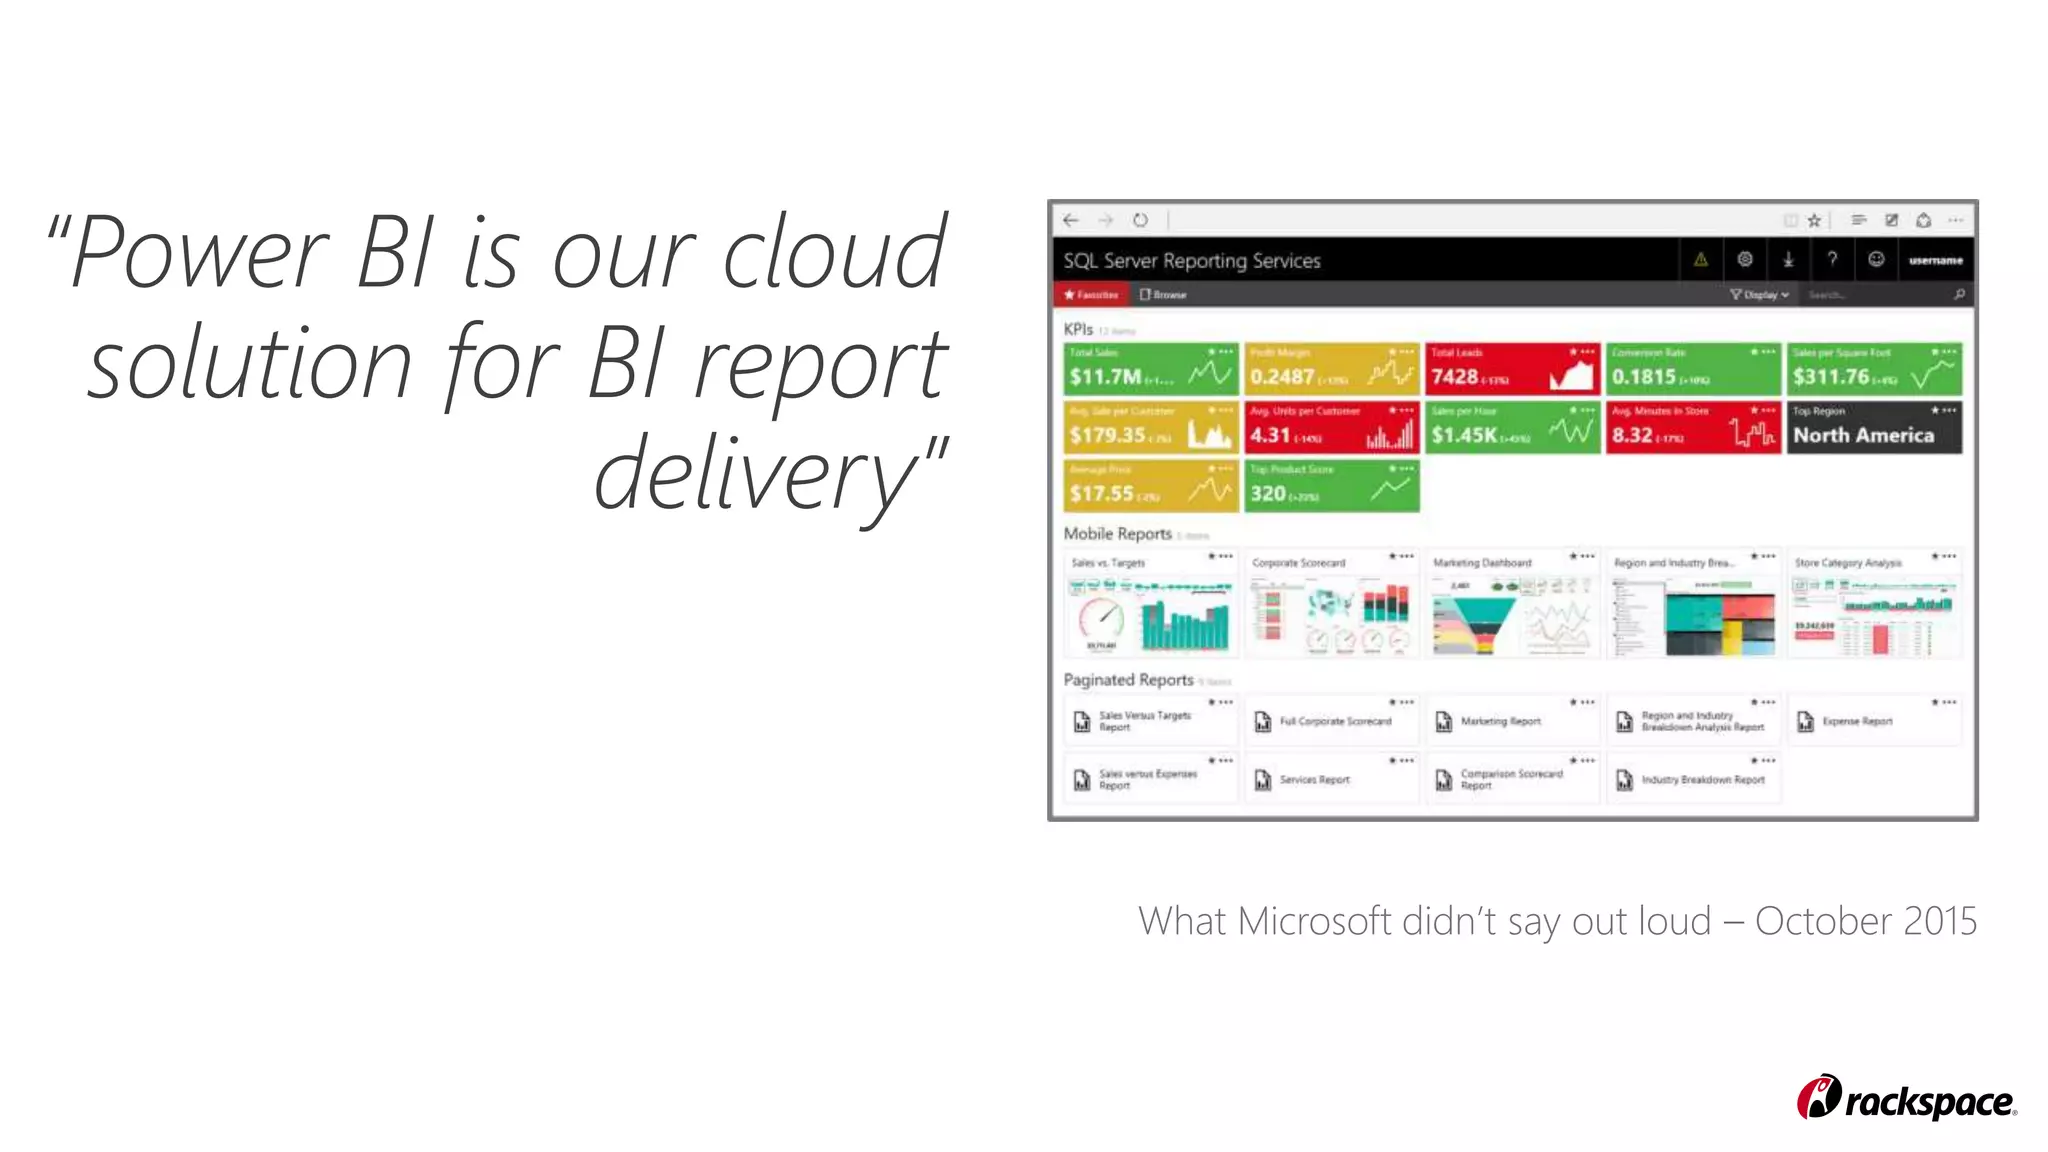
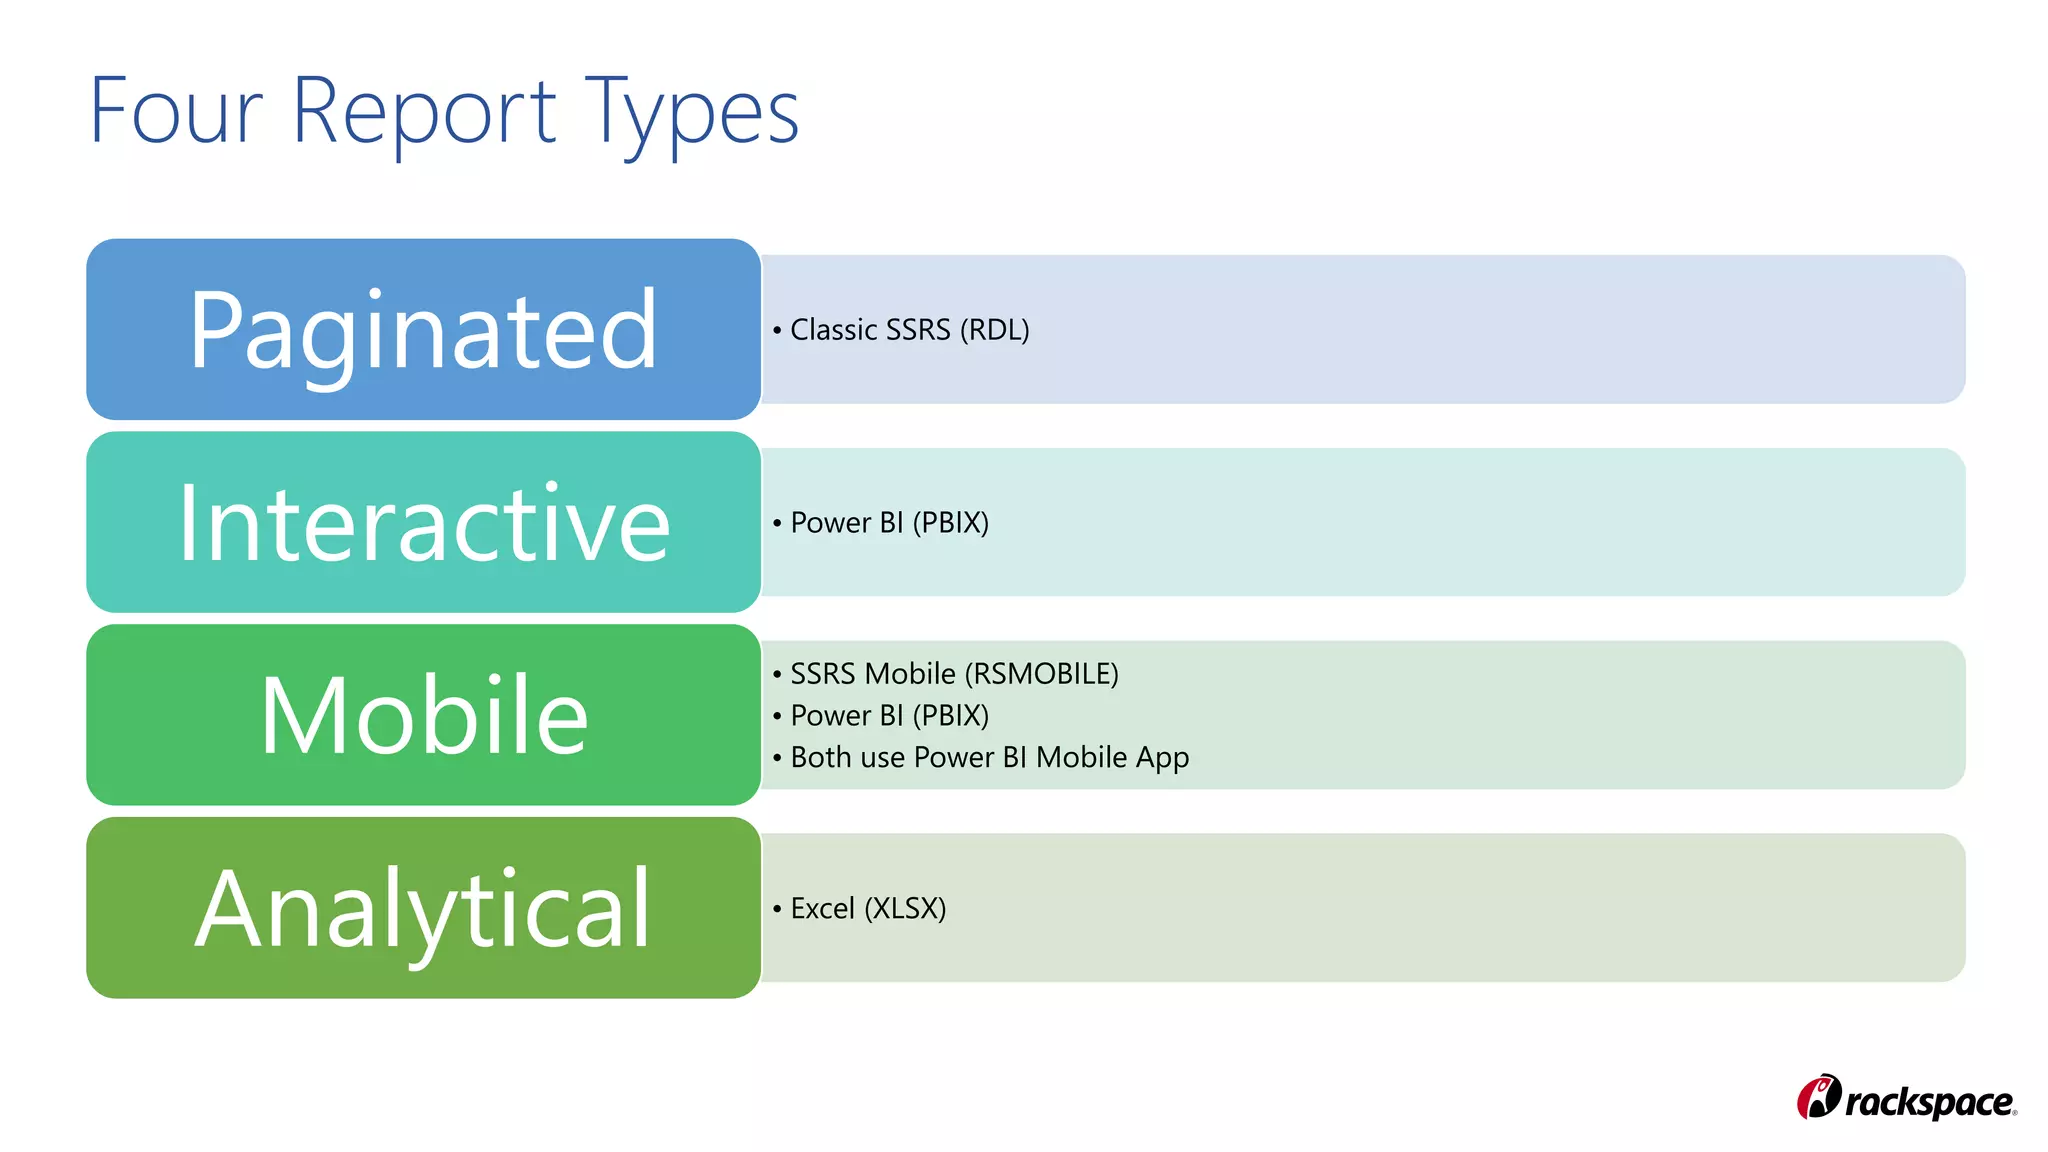
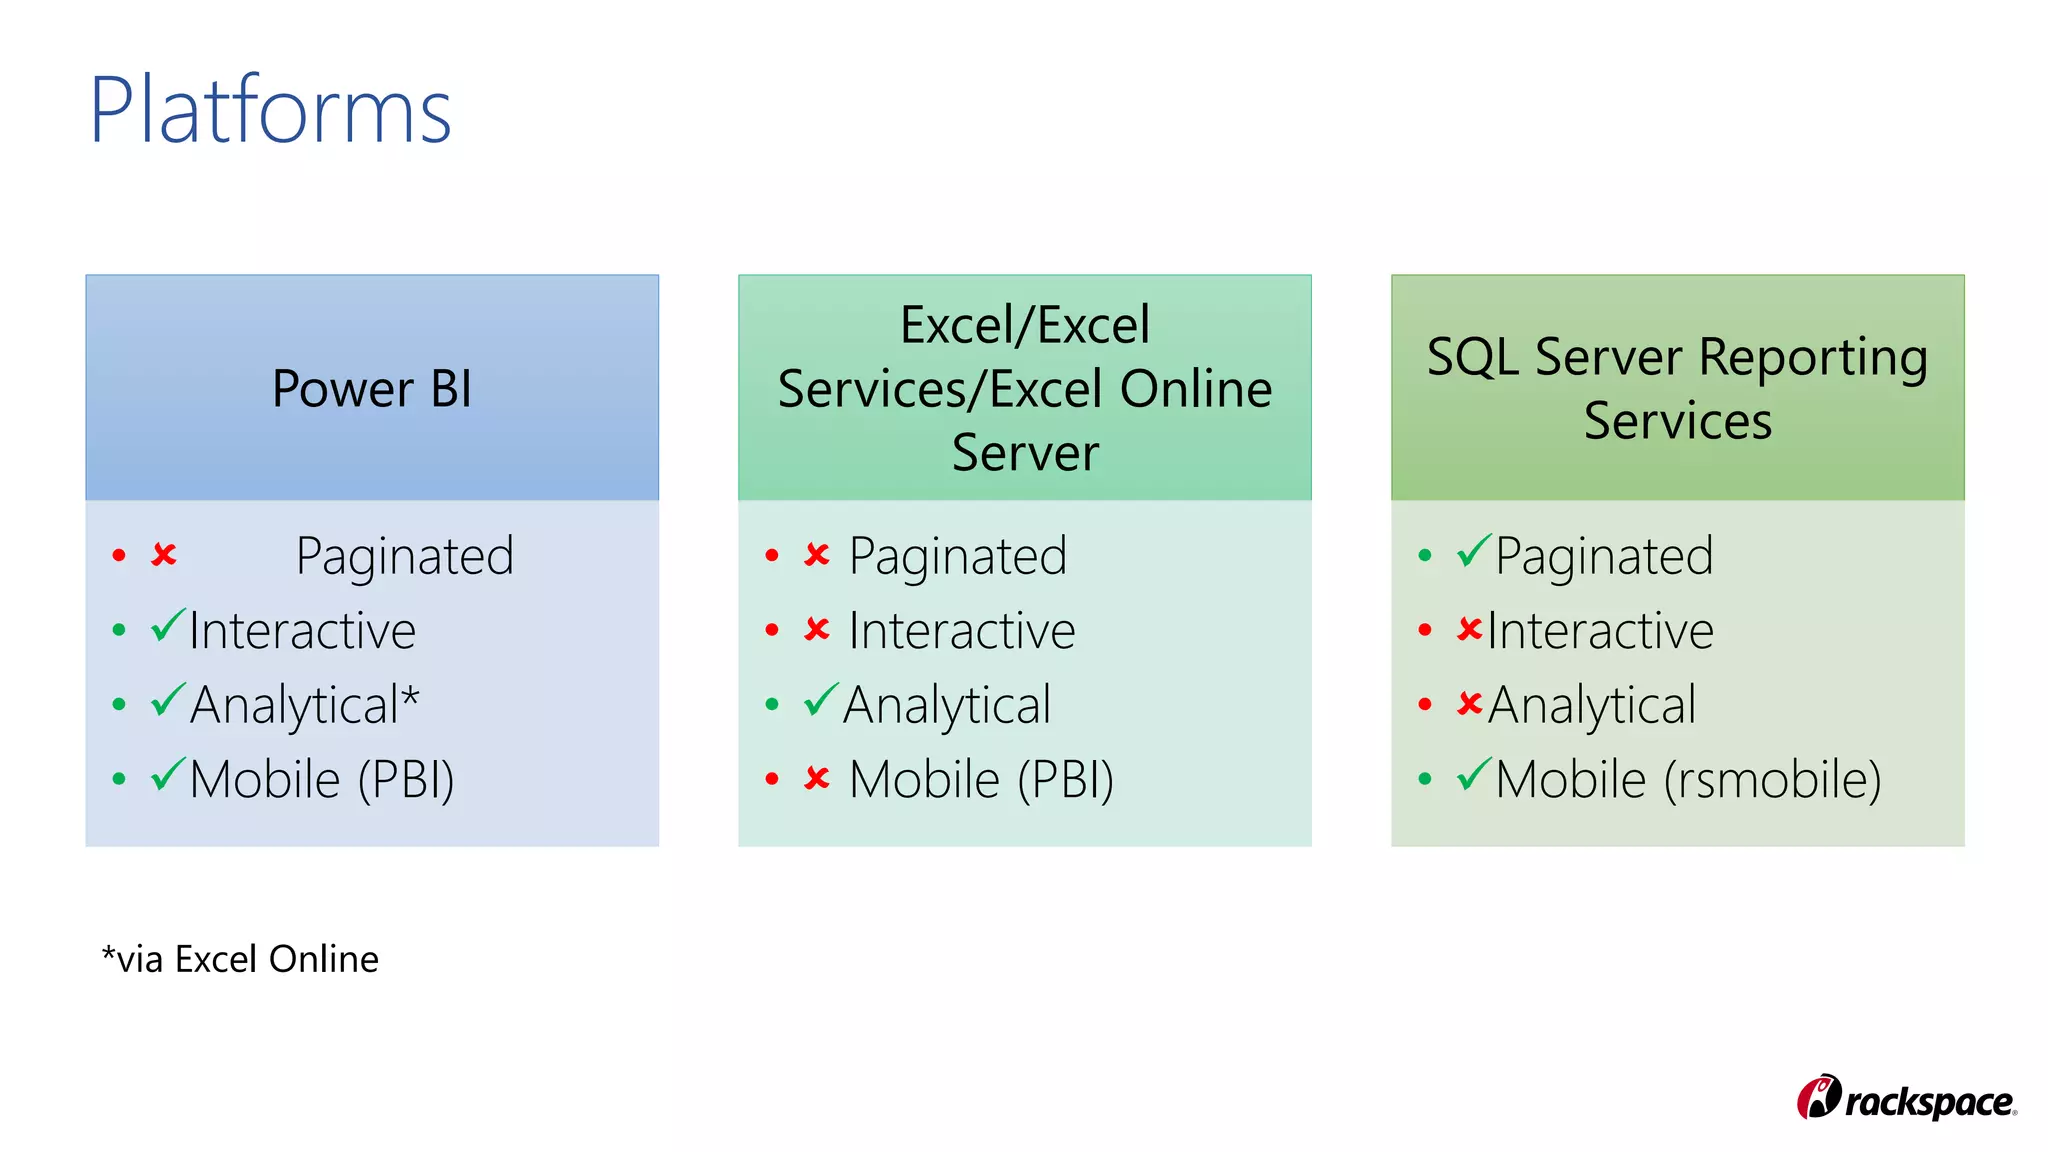
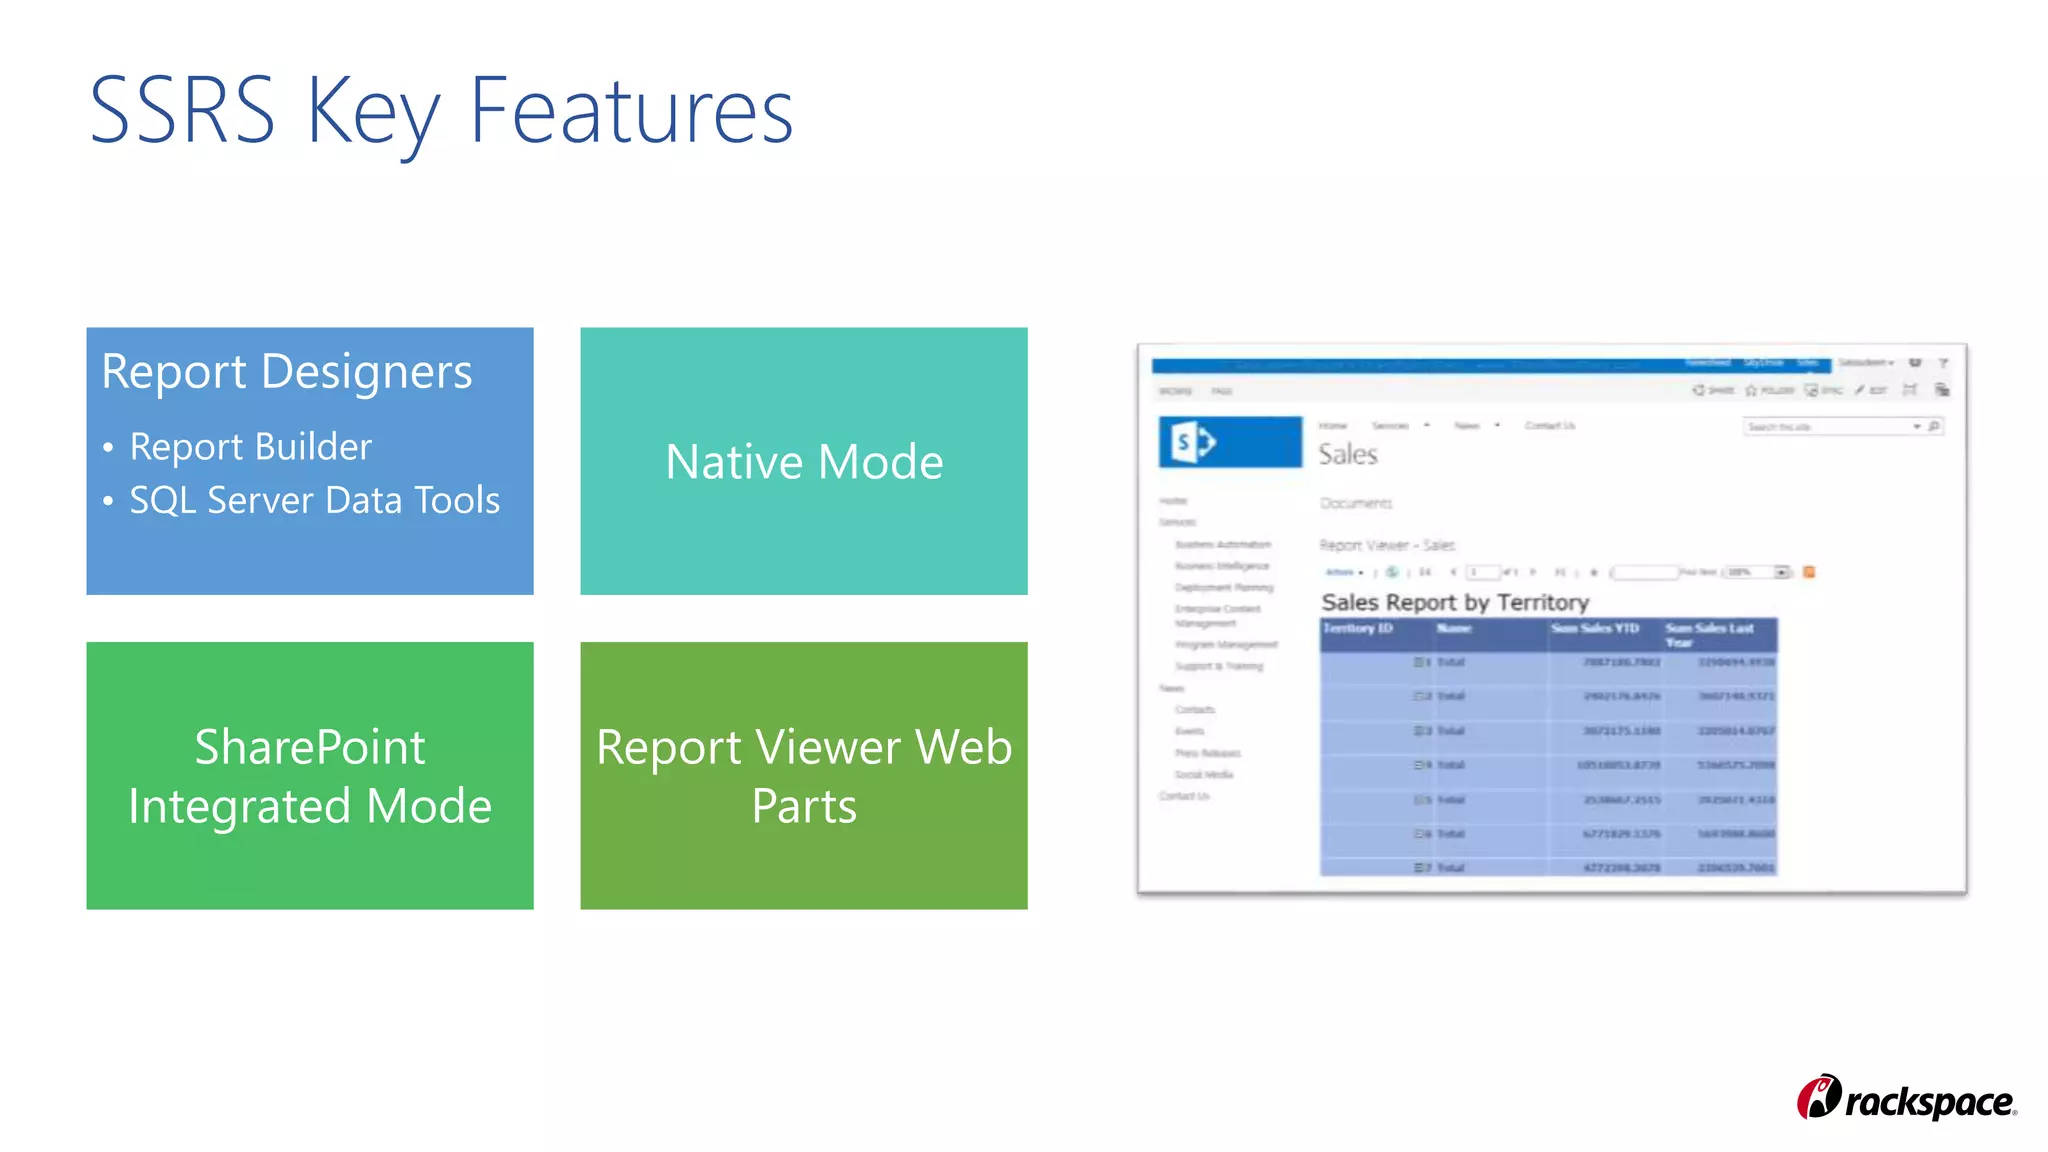
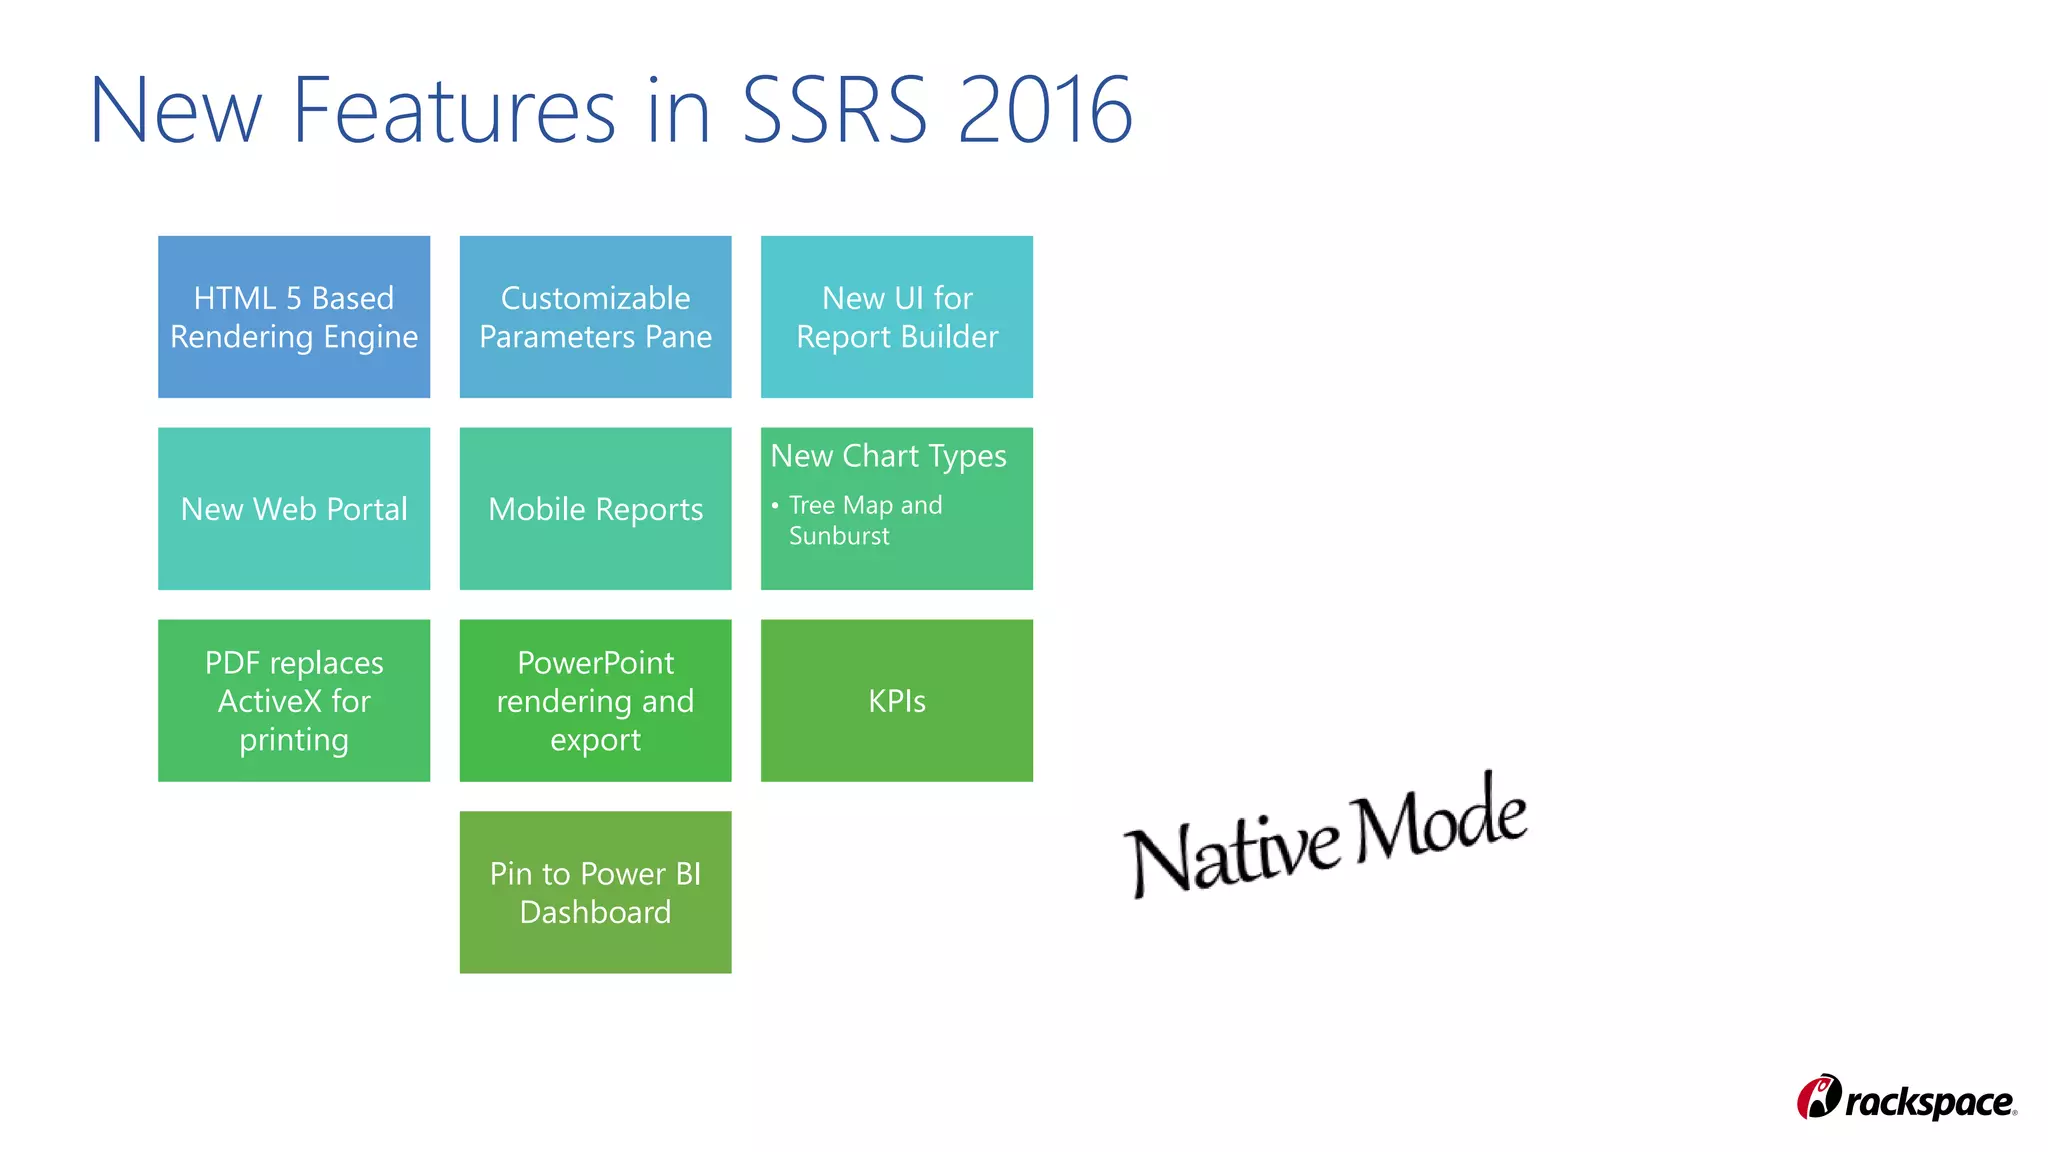
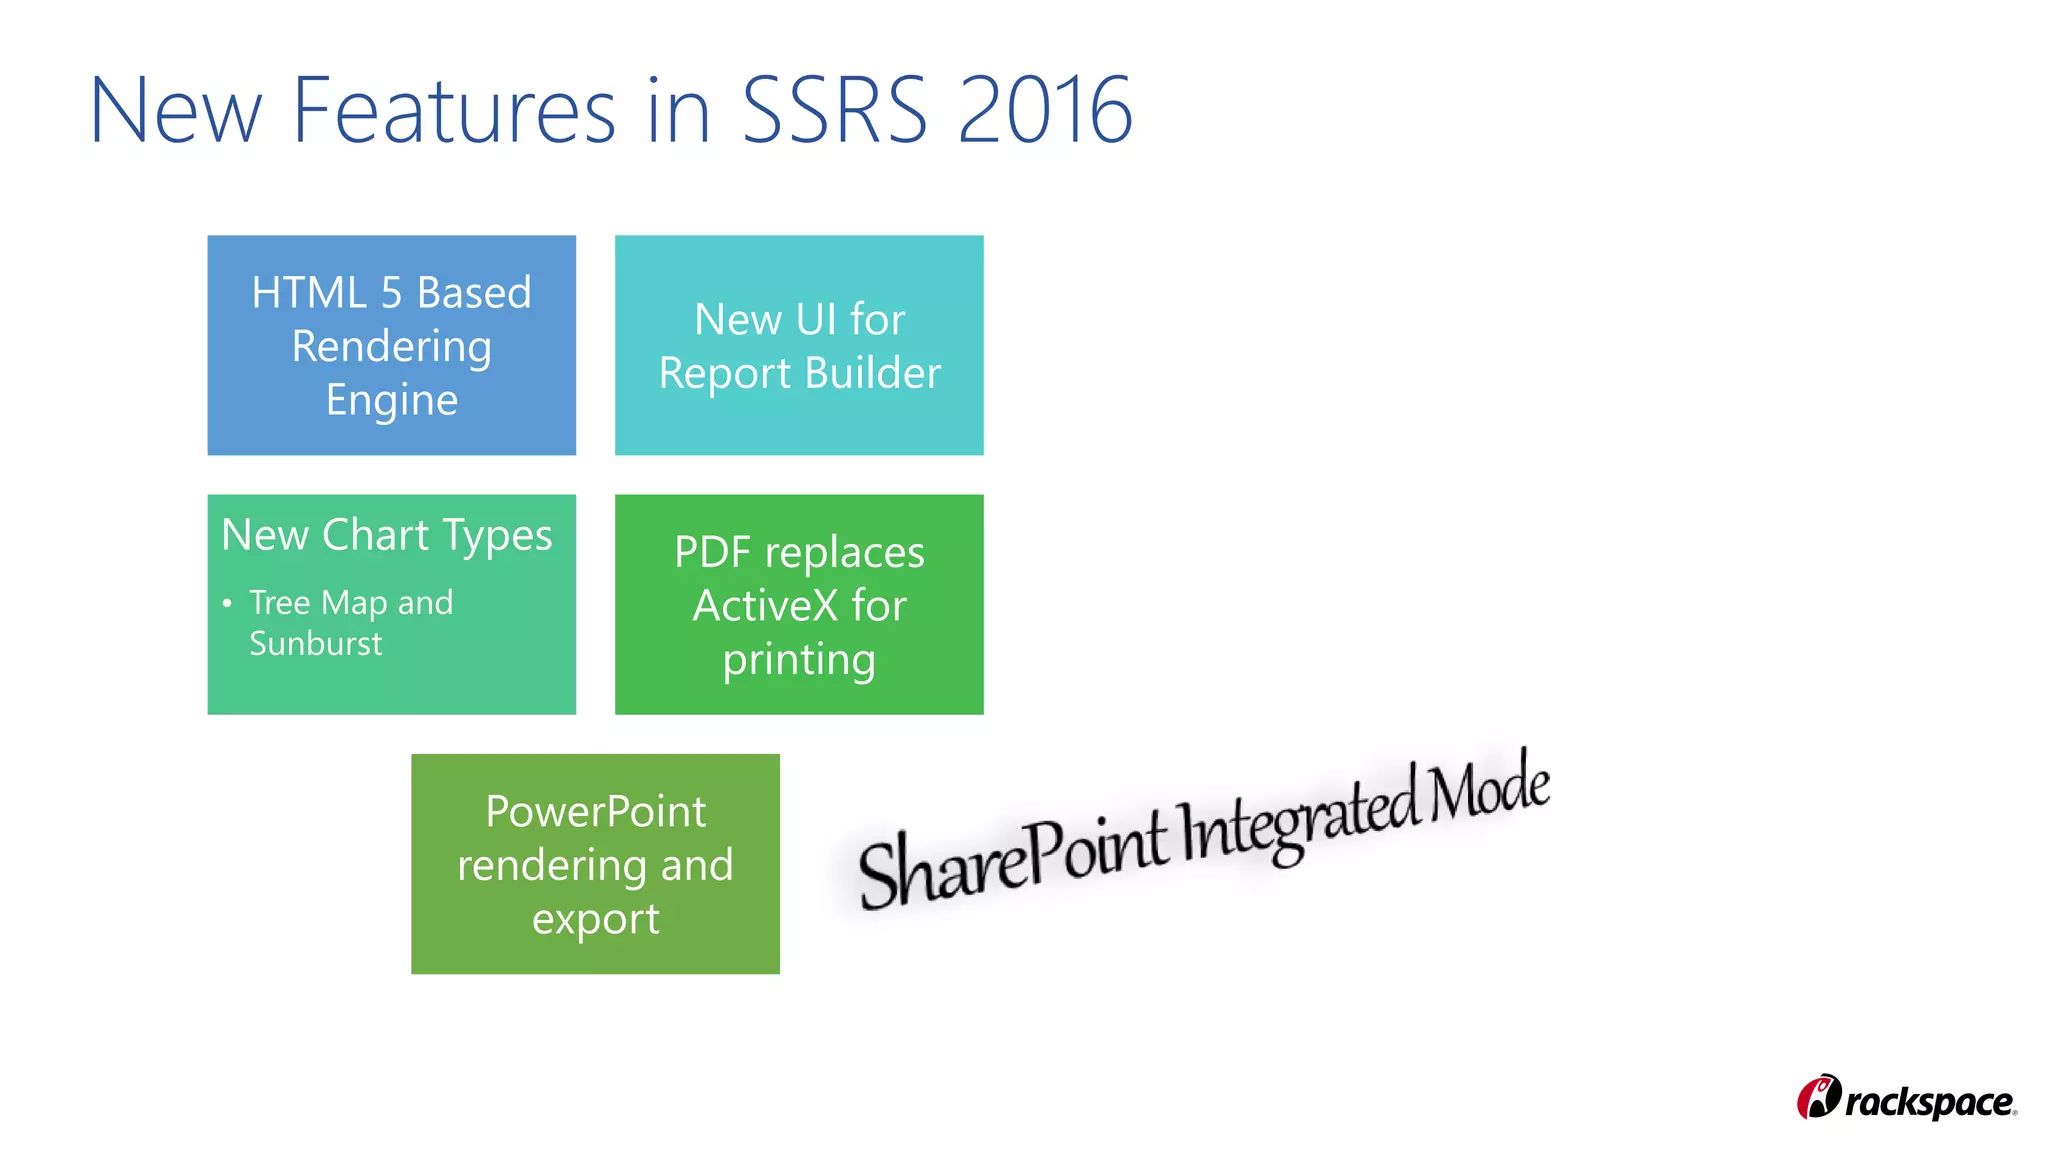
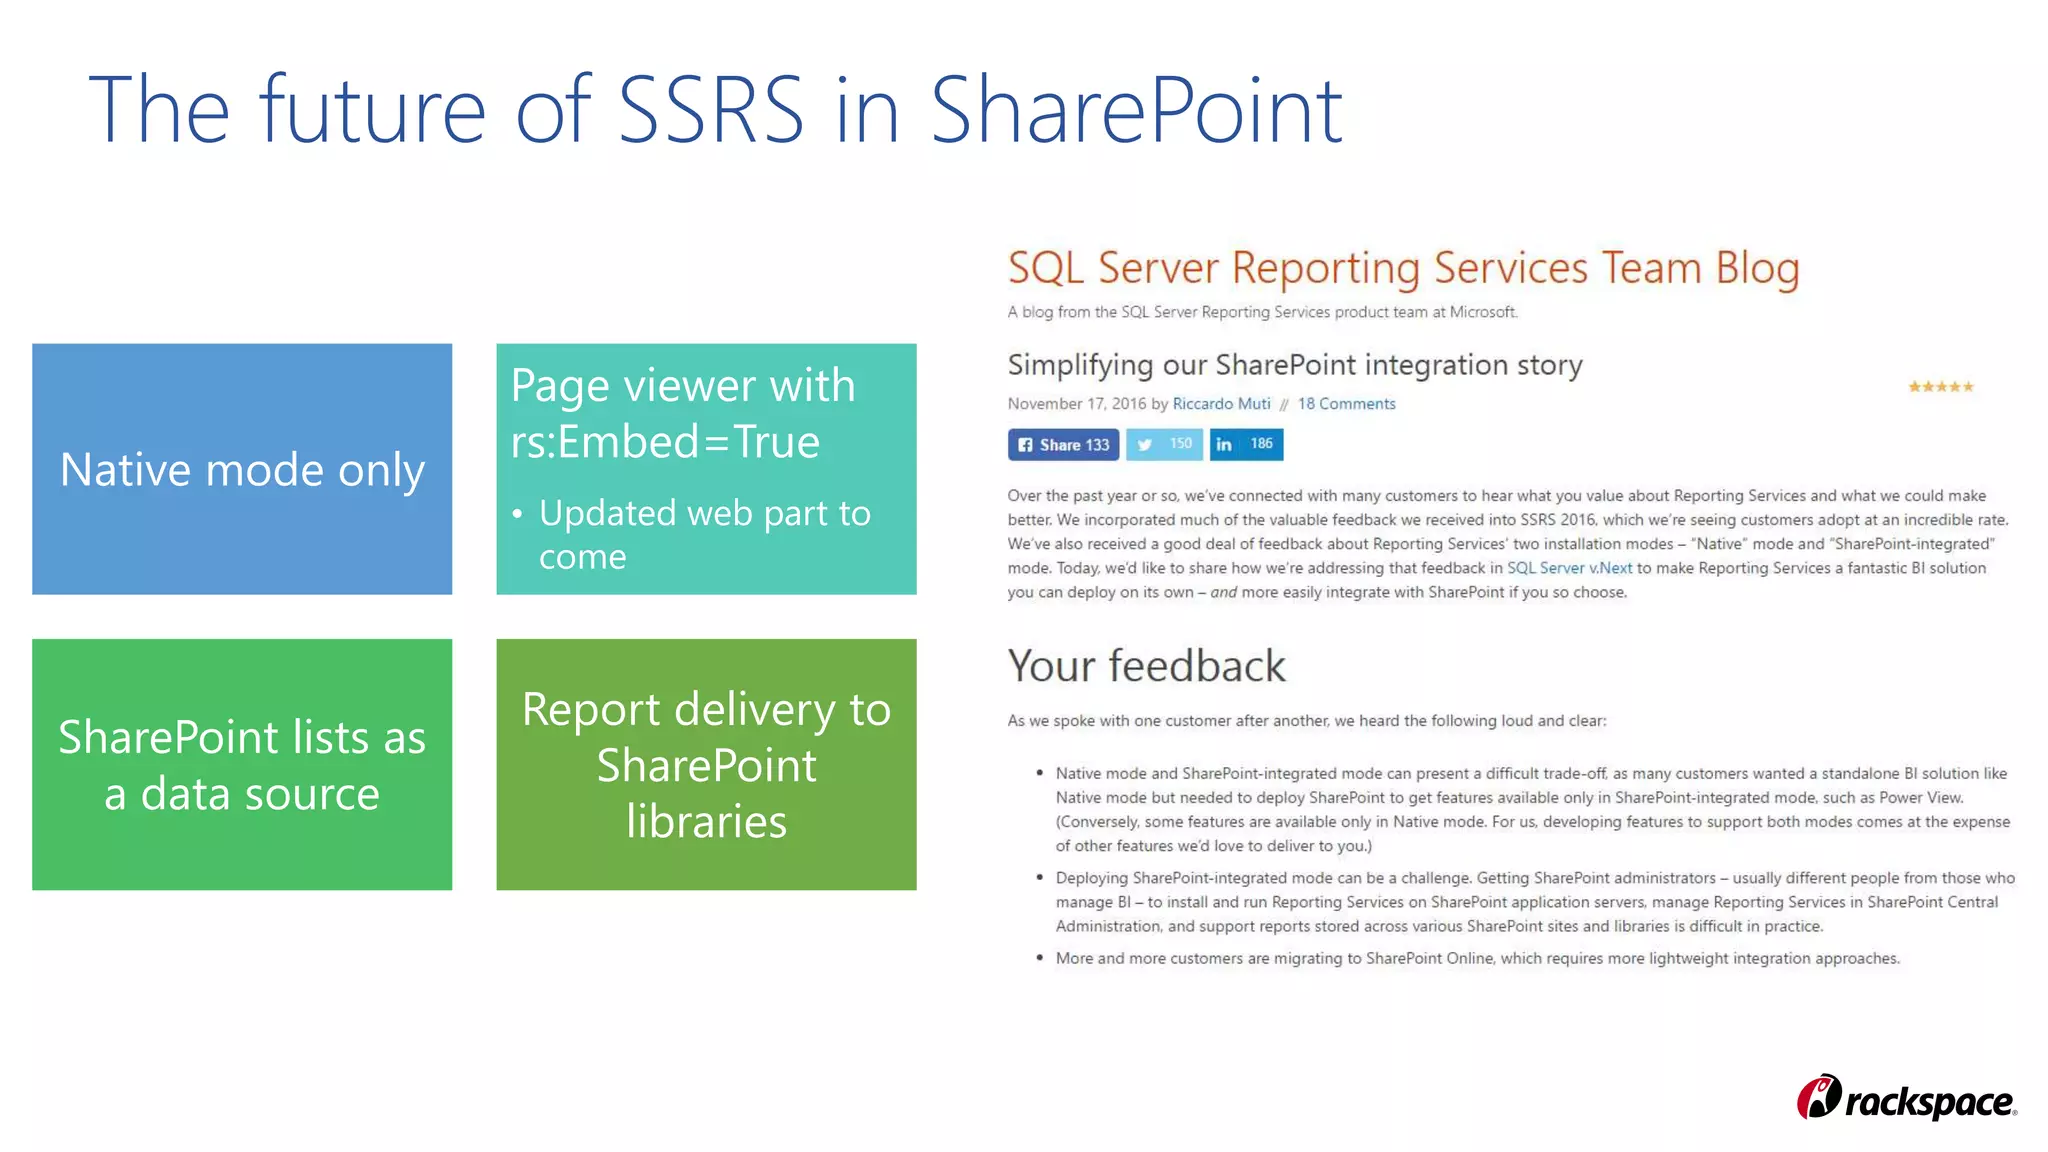
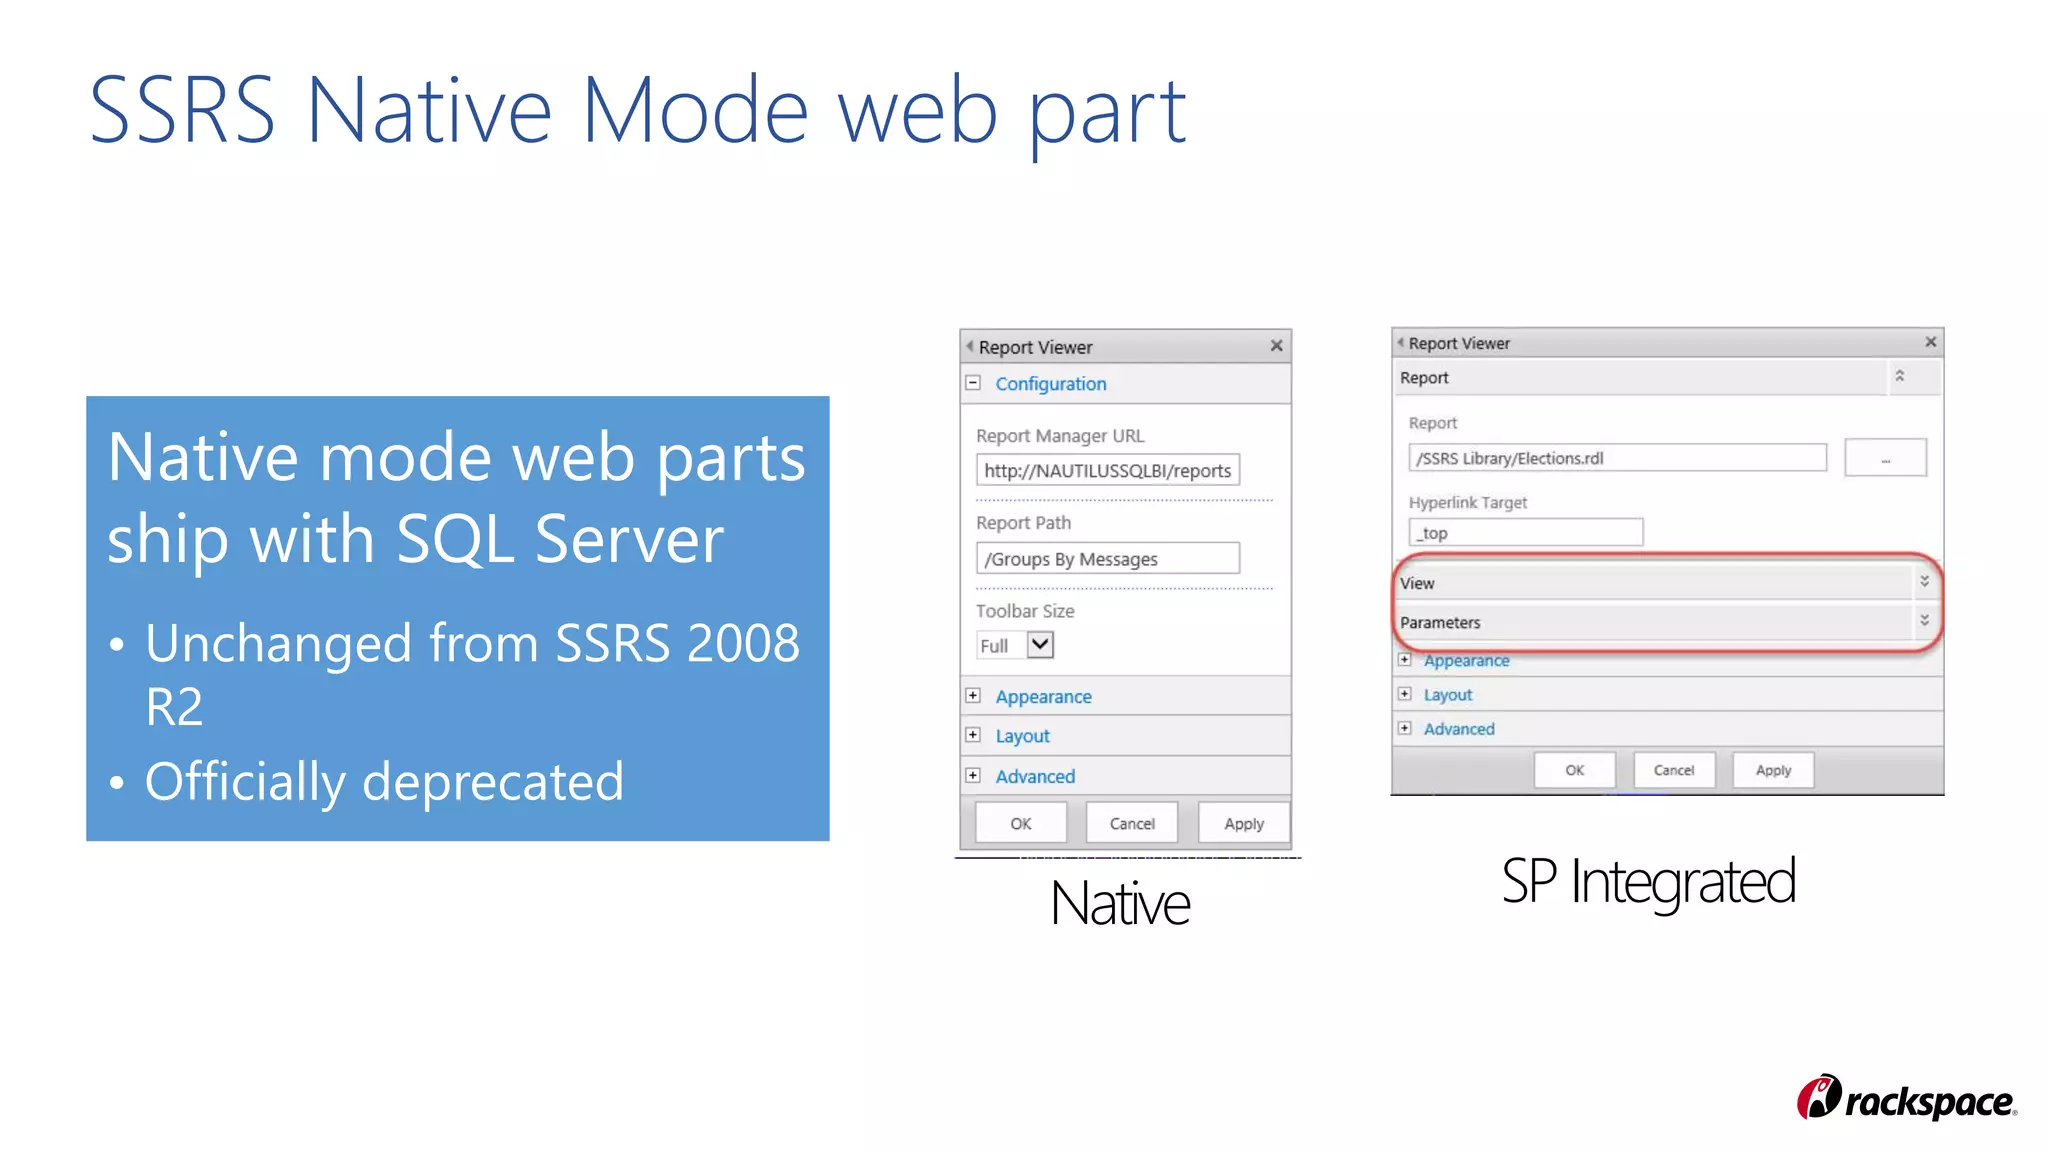

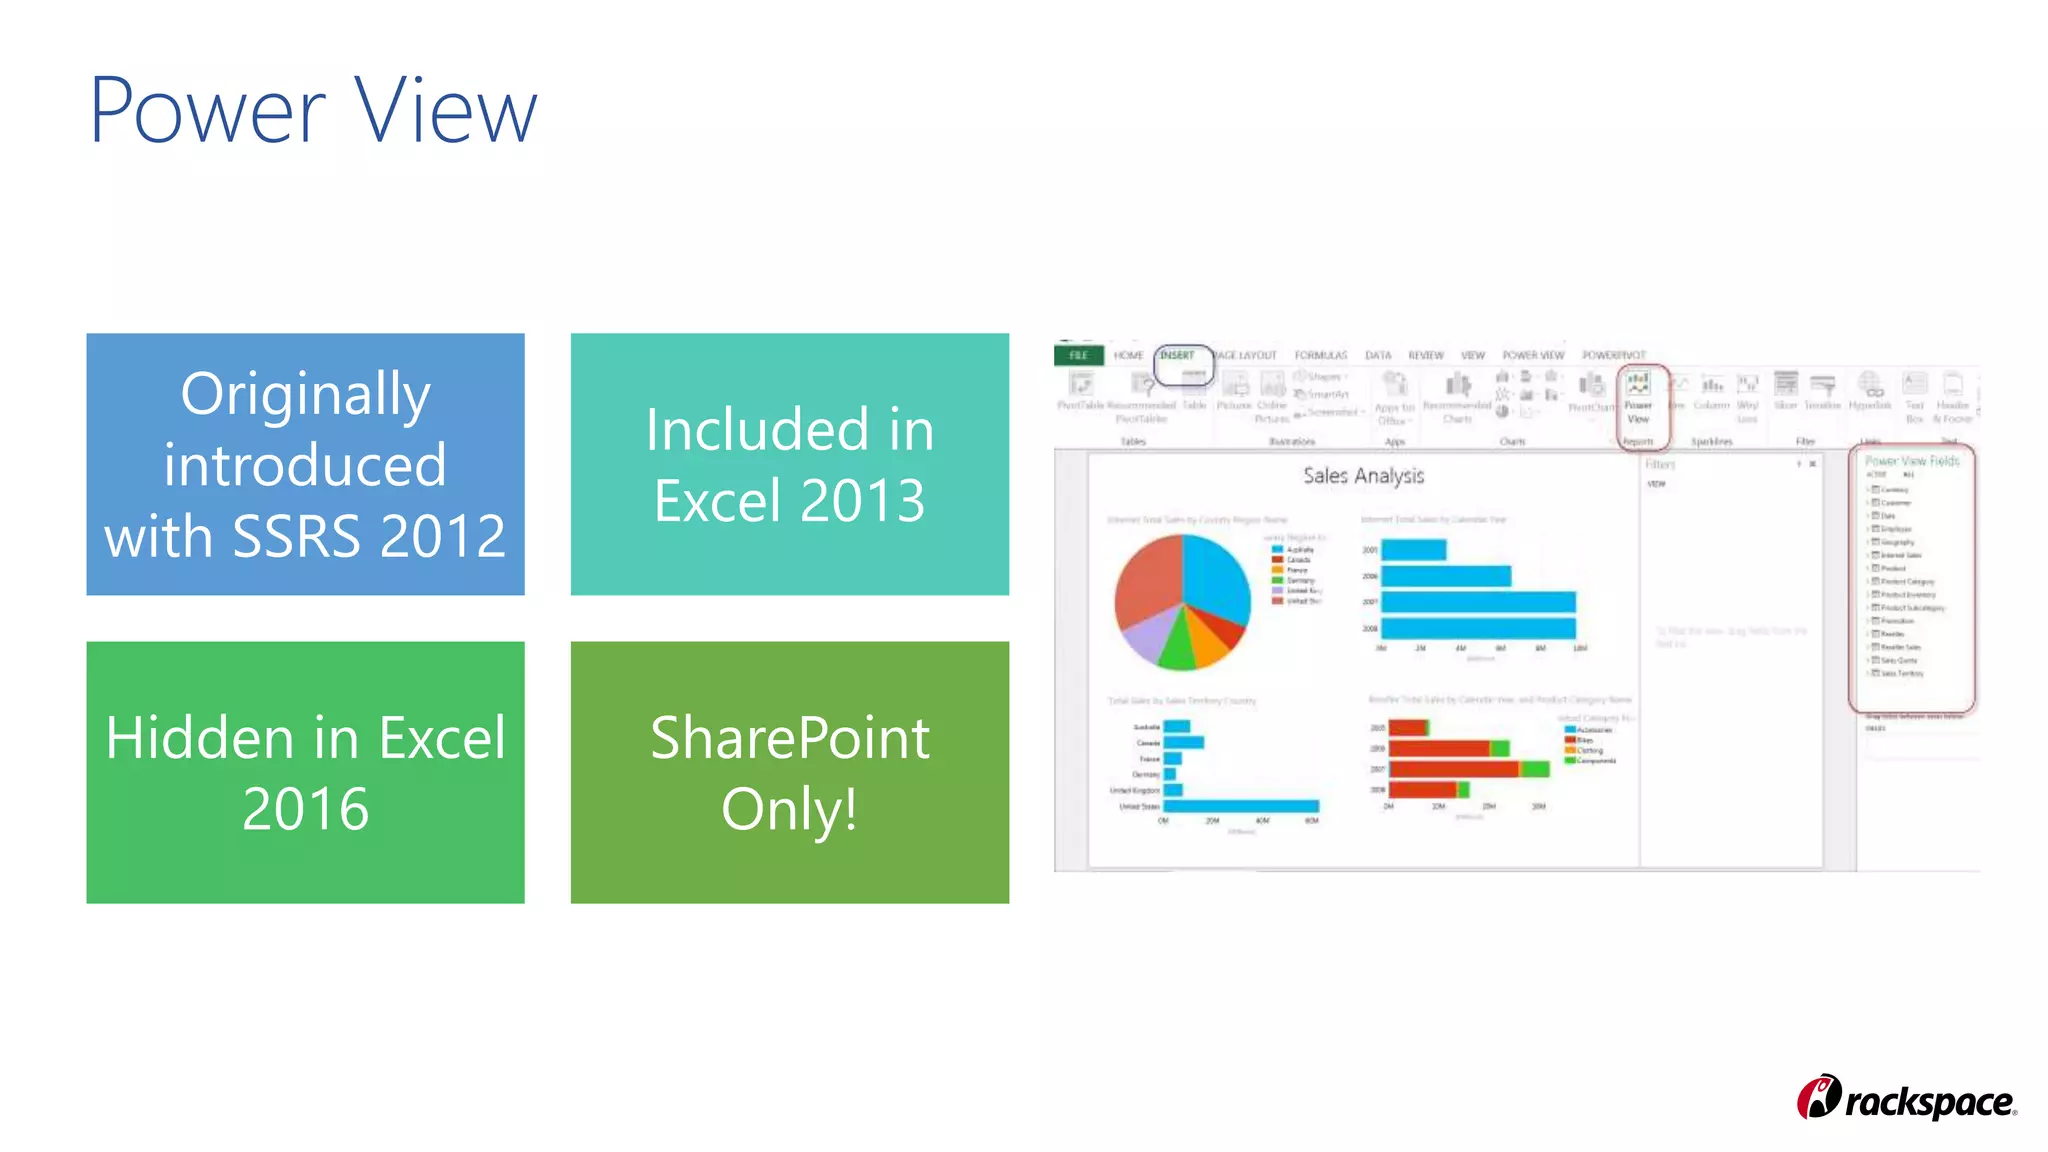
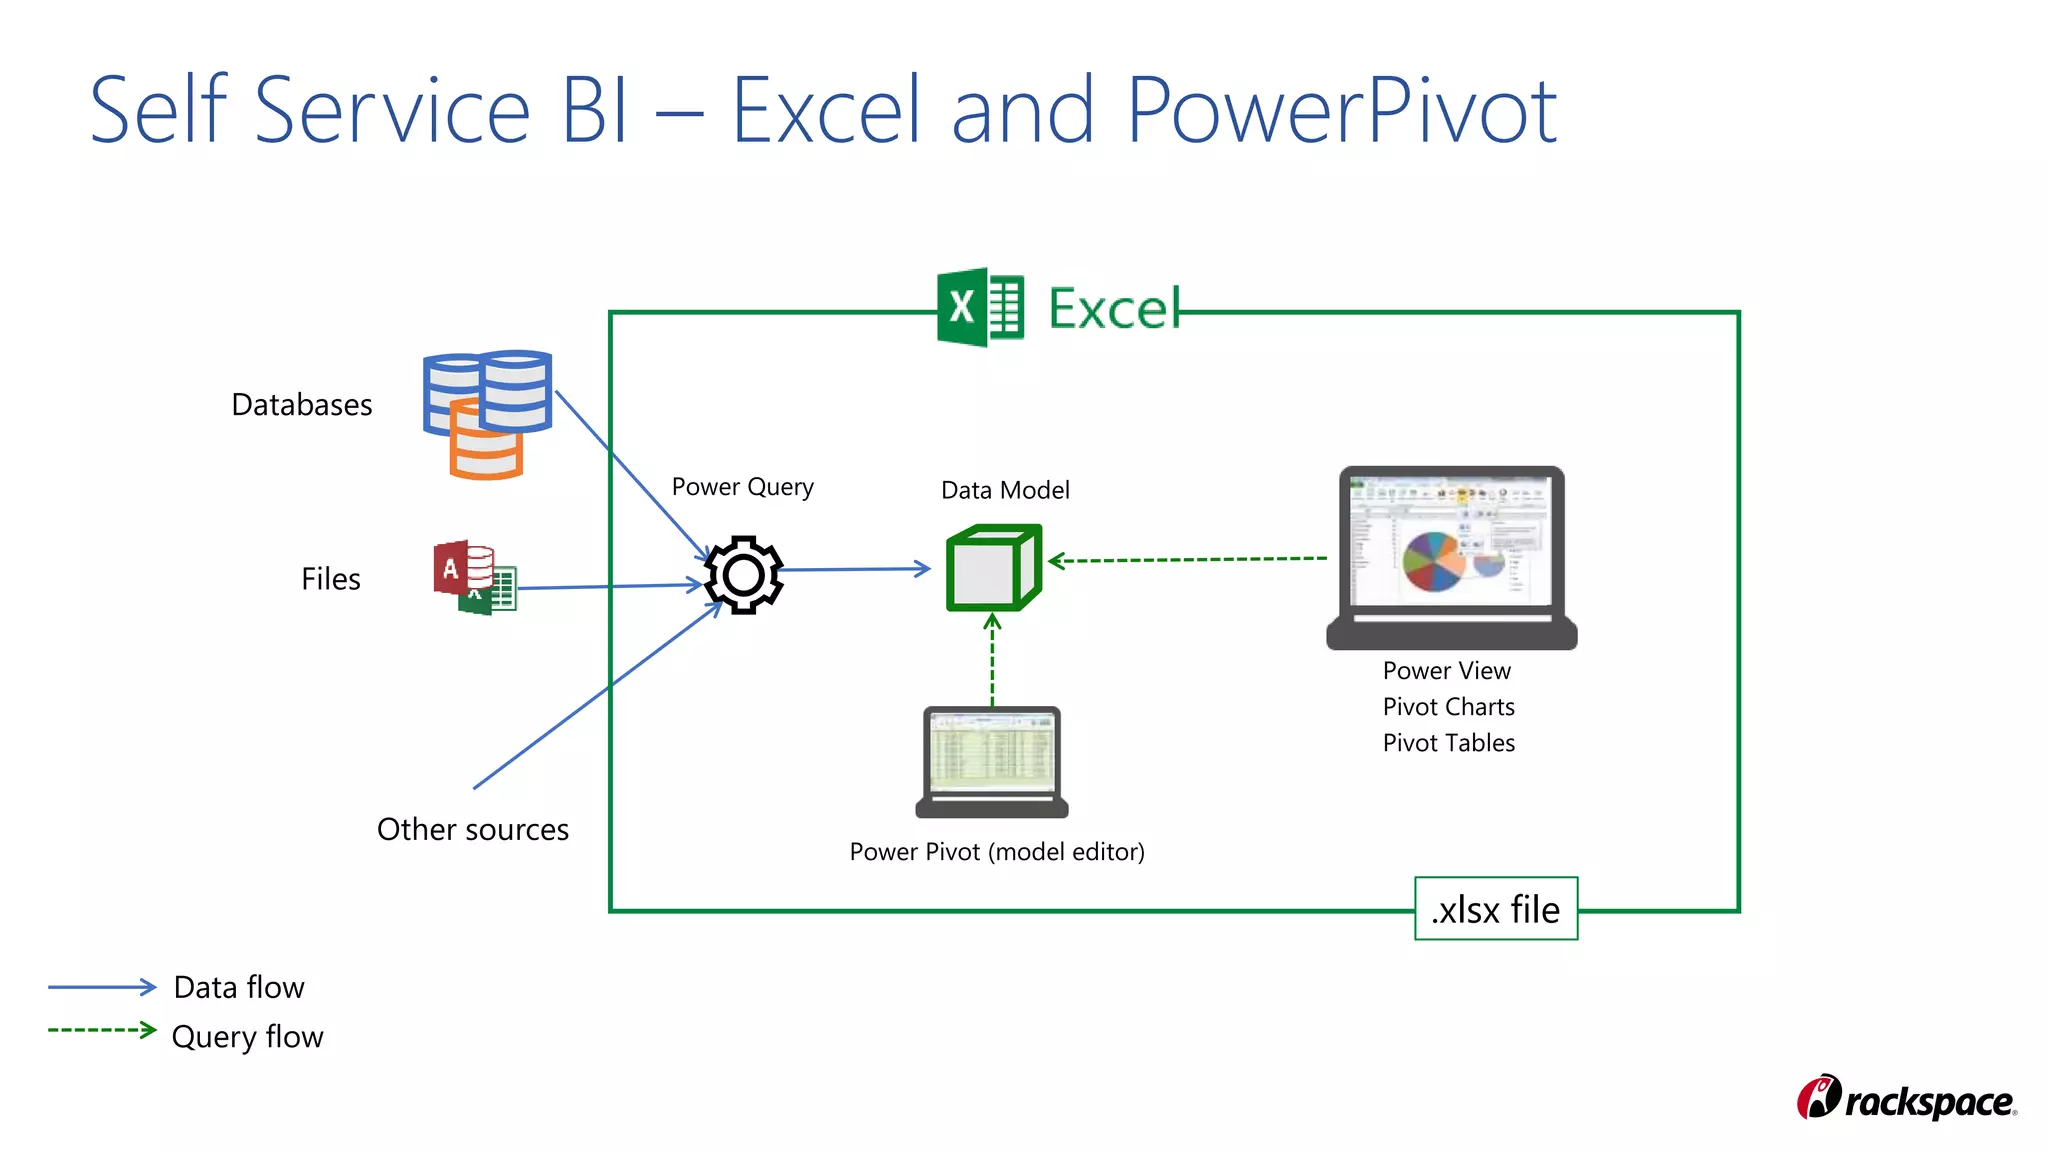
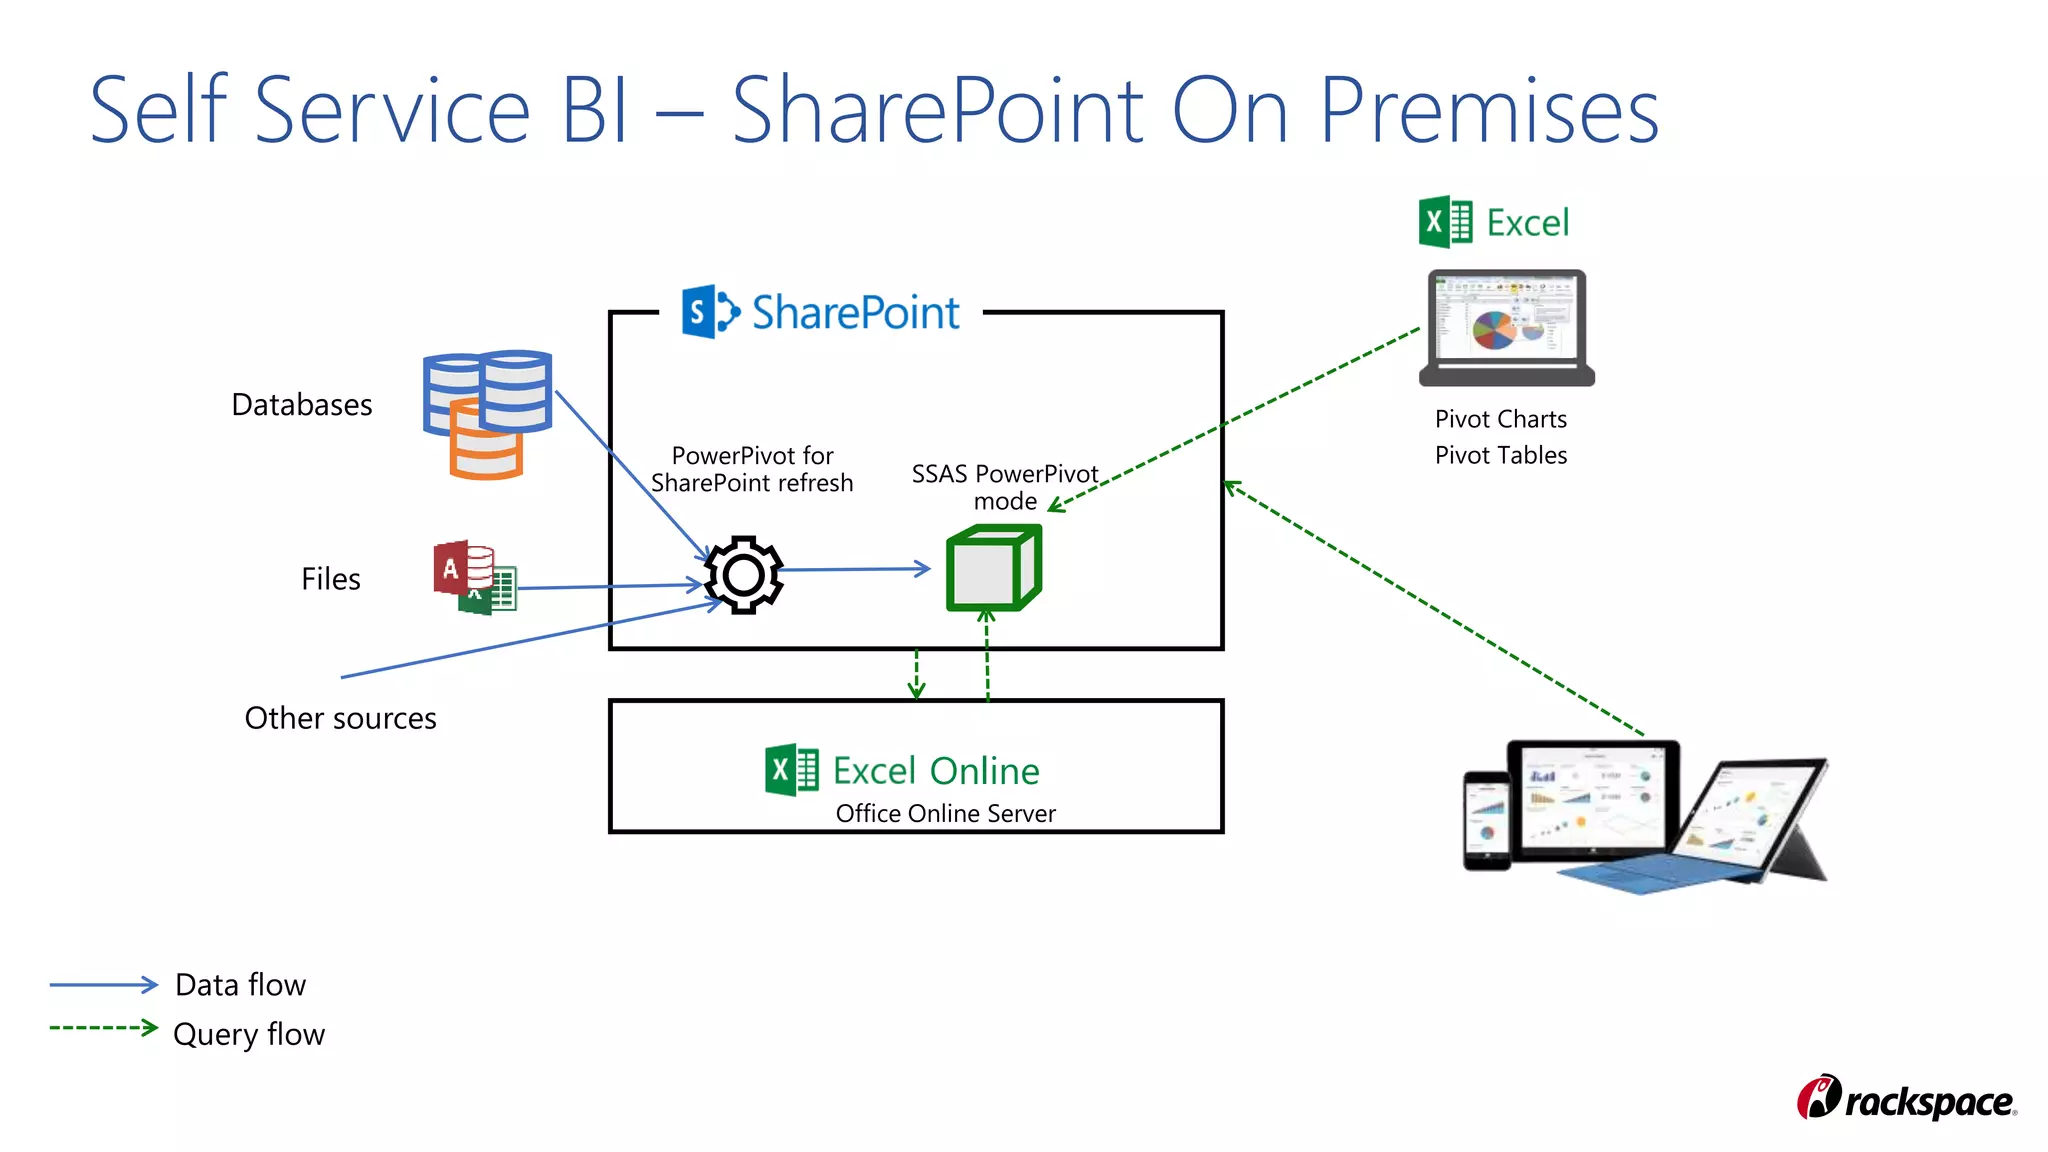


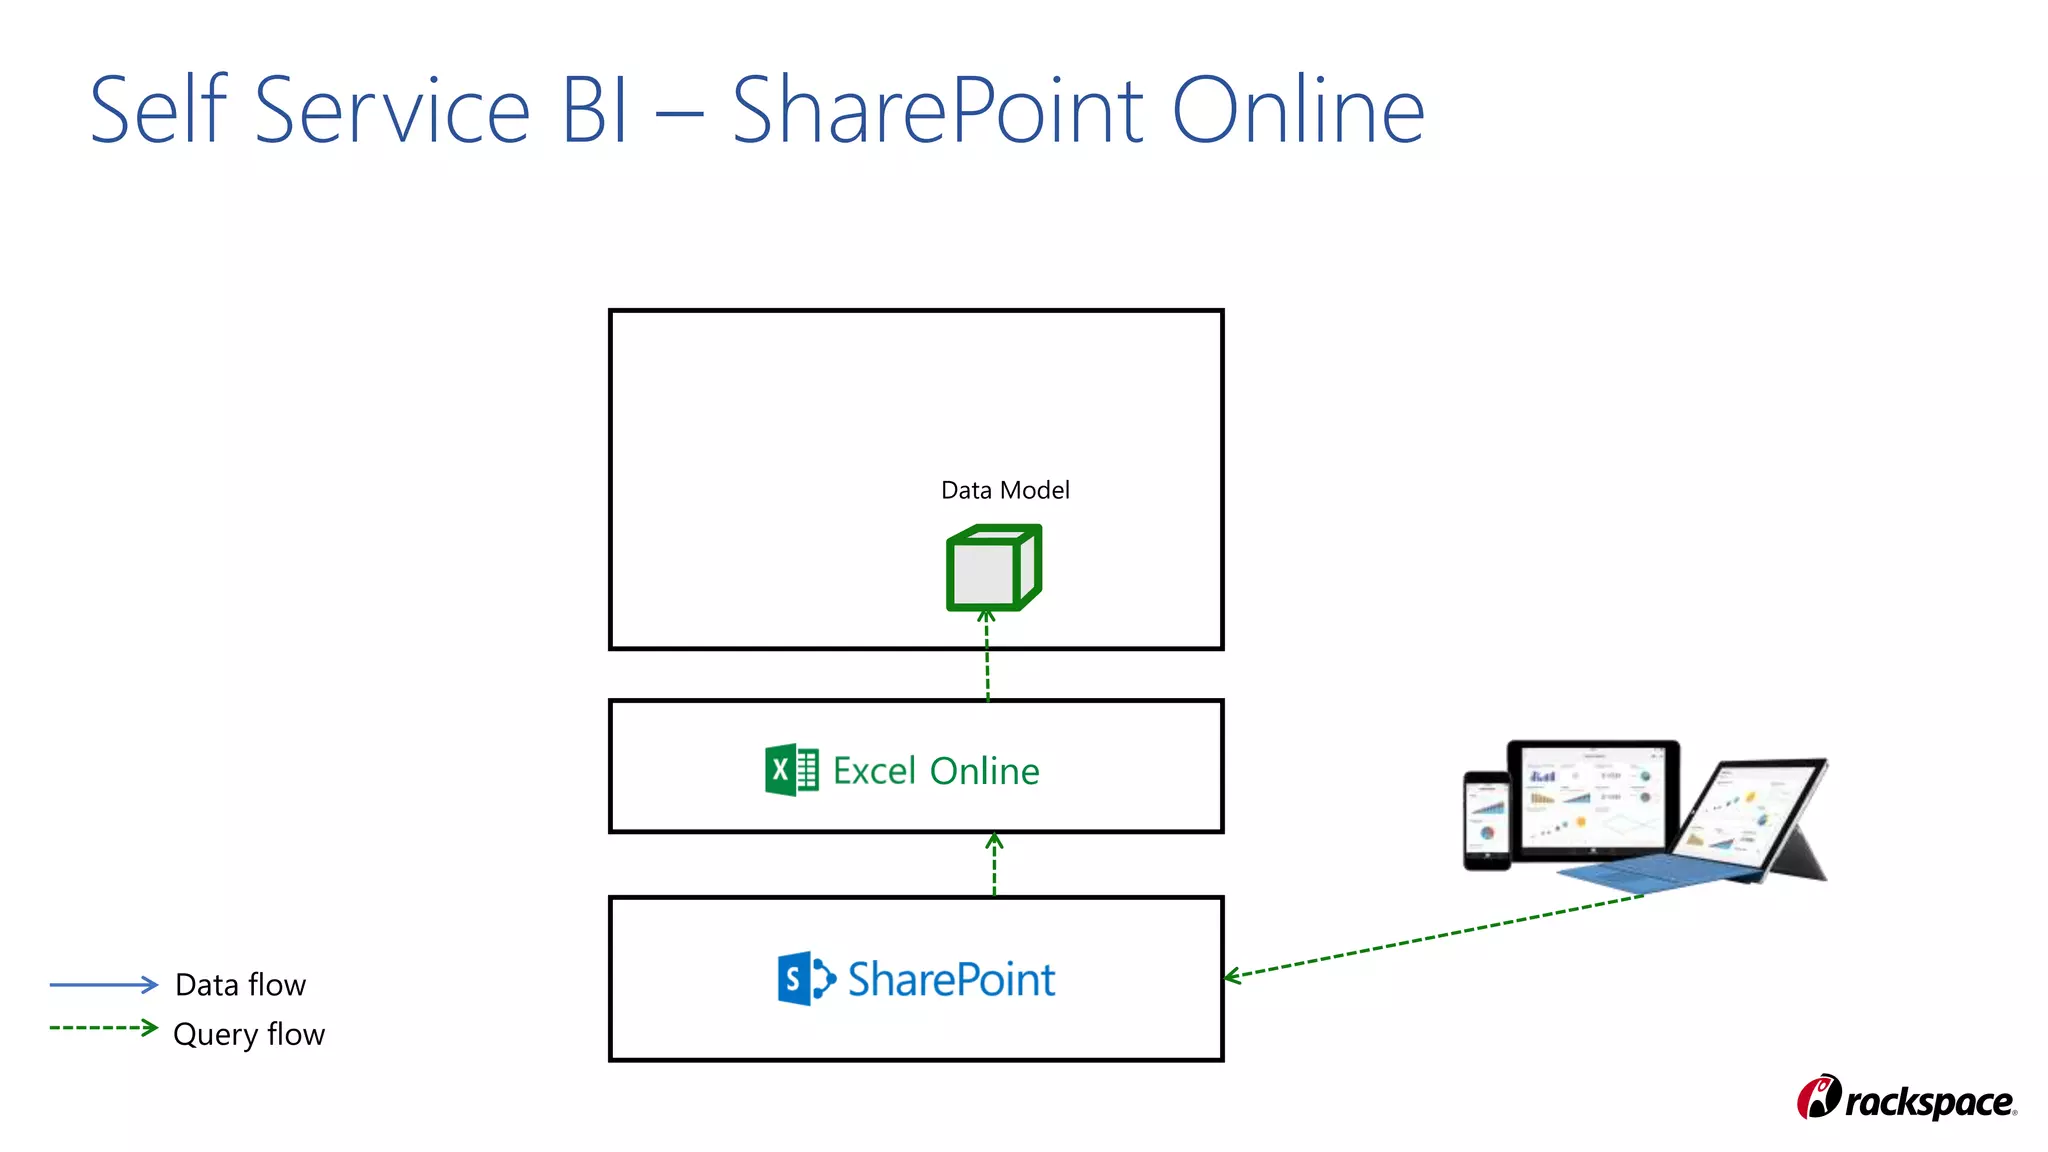
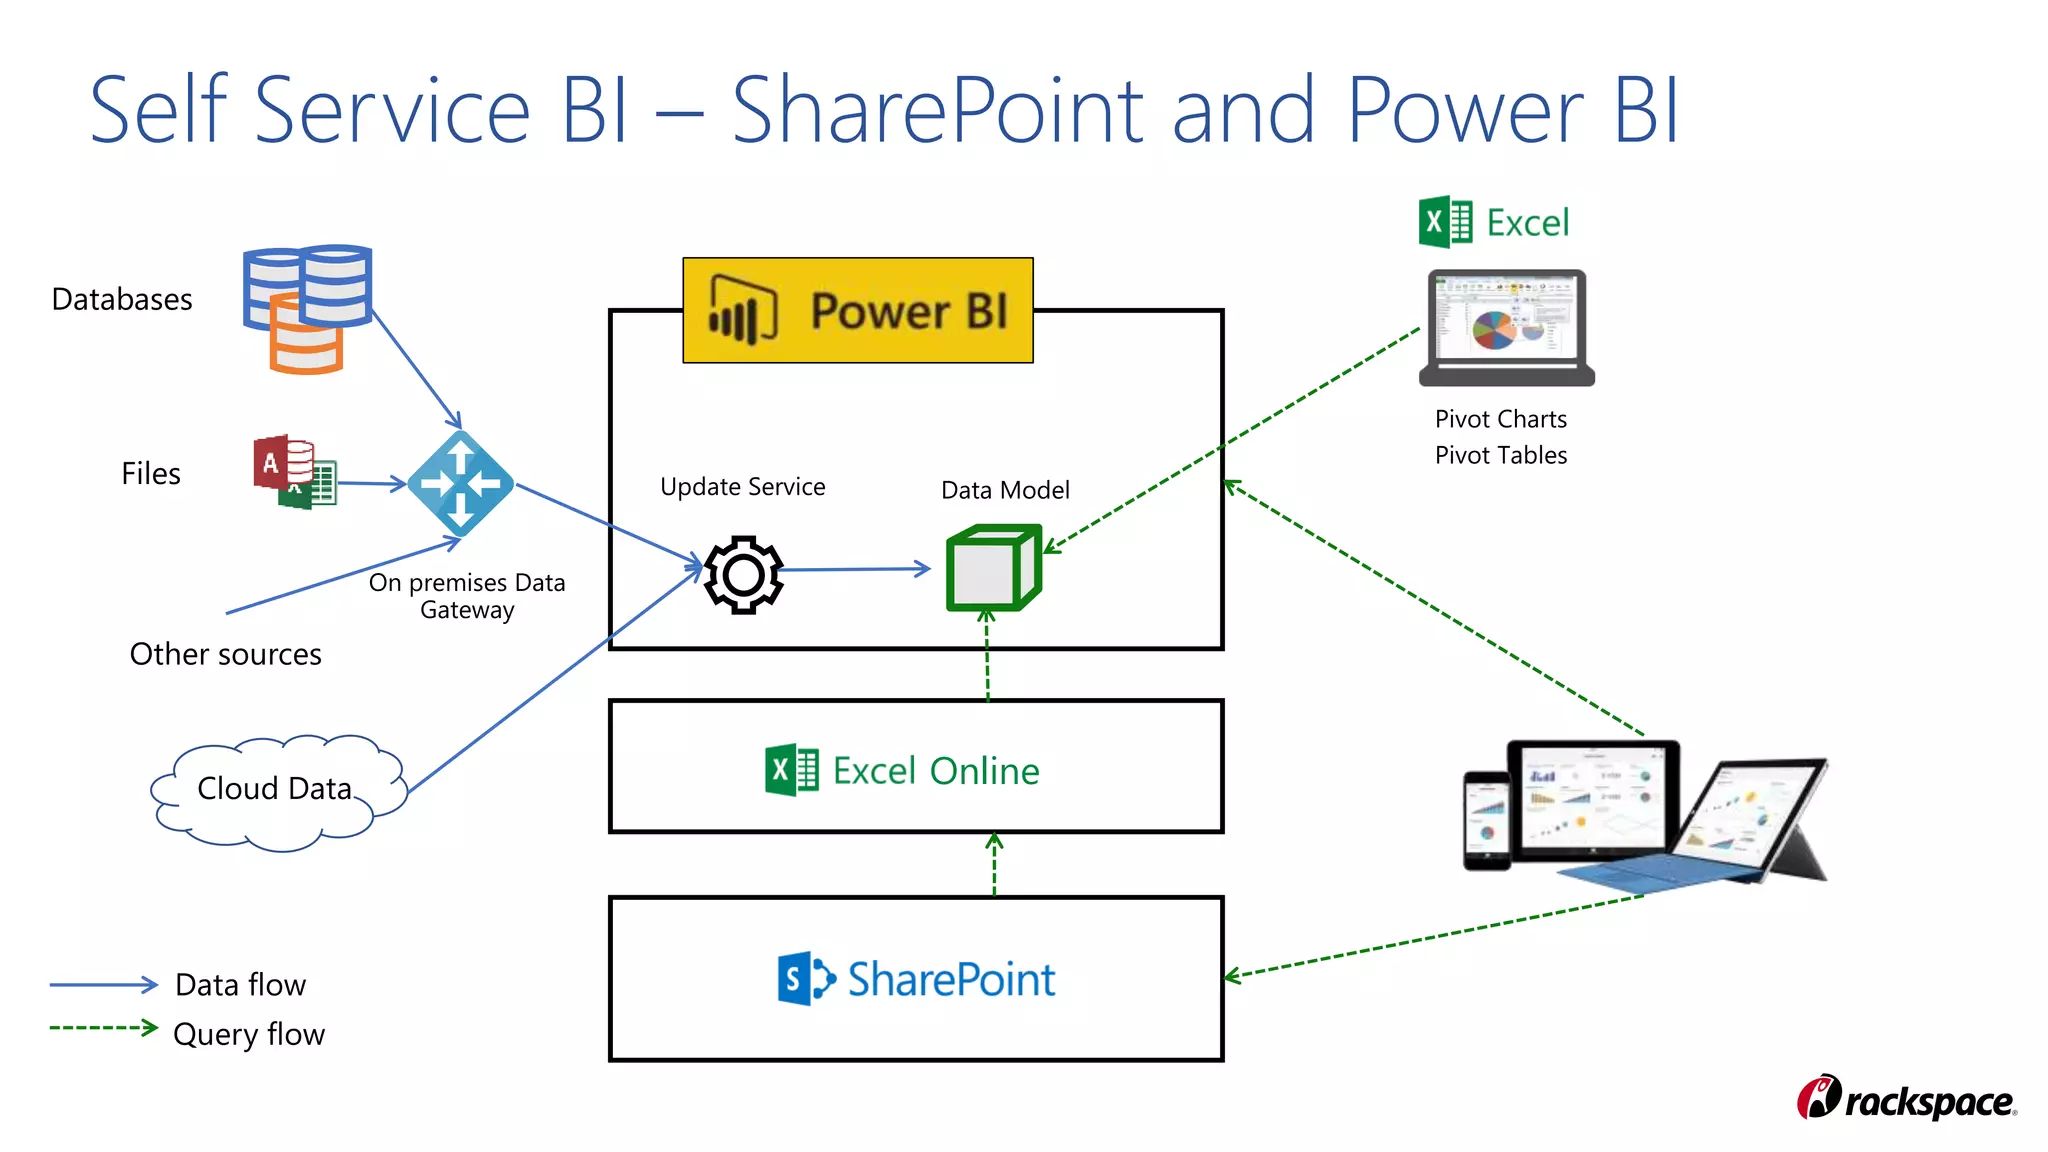
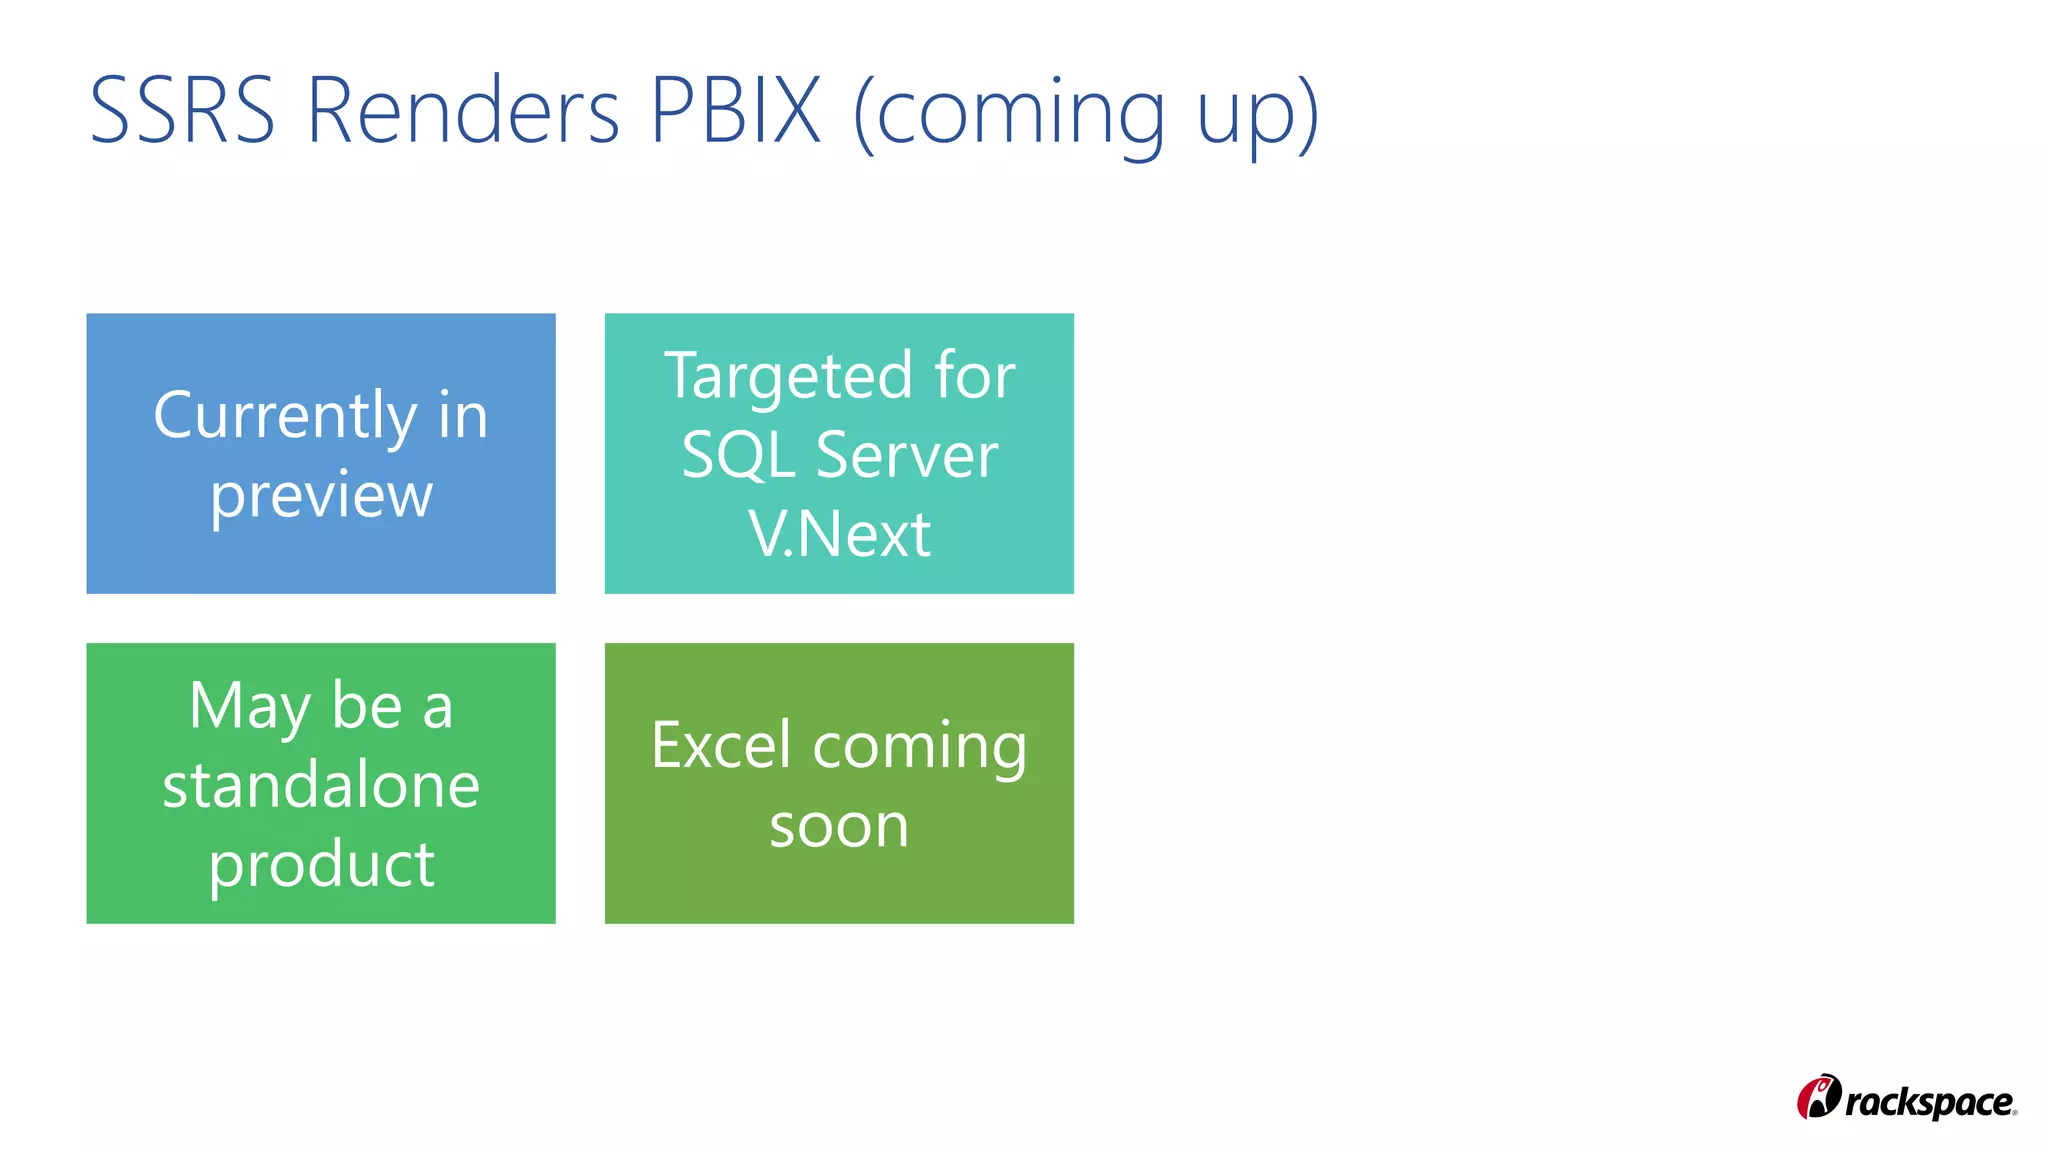


The document discusses the evolution of Microsoft’s business intelligence tools from SharePoint 2007 to SharePoint 2016 and their integration with SQL Server Reporting Services and Power BI. It highlights key features, report types, and the transition from on-premises solutions to cloud-based offerings for business intelligence delivery. Additionally, it touches on self-service BI capabilities and the importance of maintaining data models in online environments.


![Microsoft Power Stack 2019 [Power BI, Excel, Azure & Friends]](https://cdn.slidesharecdn.com/ss_thumbnails/cl5khvpdqxat1towwmgy-signature-ad54afc6bb6f90c90525c52bba803ad4bbc4540a1573646d15de668783fb664a-poli-170212213019-thumbnail.jpg?width=640&height=640&fit=bounds)


![[BDD 2025 - Mobile Development] Mobile Engineer and Software Engineer: Are we...](https://cdn.slidesharecdn.com/ss_thumbnails/md-mobileengineerandsoftwareengineerarewestillrelevantsidiqpermana-251127010650-55224ef1-thumbnail.jpg?width=640&height=640&fit=bounds)


![[BDD 2025 - Artificial Intelligence] Building AI Systems That Users (and Comp...](https://cdn.slidesharecdn.com/ss_thumbnails/ai-buildingaisystemsthatusersandcompanieslove-251124030845-038f7732-thumbnail.jpg?width=640&height=640&fit=bounds)
![[BDD 2025 - Artificial Intelligence] AI for the Underdogs: Innovation for Sma...](https://cdn.slidesharecdn.com/ss_thumbnails/ai-aifortheunderdogsinnovationforsmallbusinesses-251124030839-72a599a4-thumbnail.jpg?width=640&height=640&fit=bounds)
![[BDD 2025 - Mobile Development] Crafting Immersive UI with E2E and AGSL Shade...](https://cdn.slidesharecdn.com/ss_thumbnails/md-craftingimmersiveuiwithe2eandagslshaderveronicaputrianggraini-251124030840-0c677f44-thumbnail.jpg?width=640&height=640&fit=bounds)


