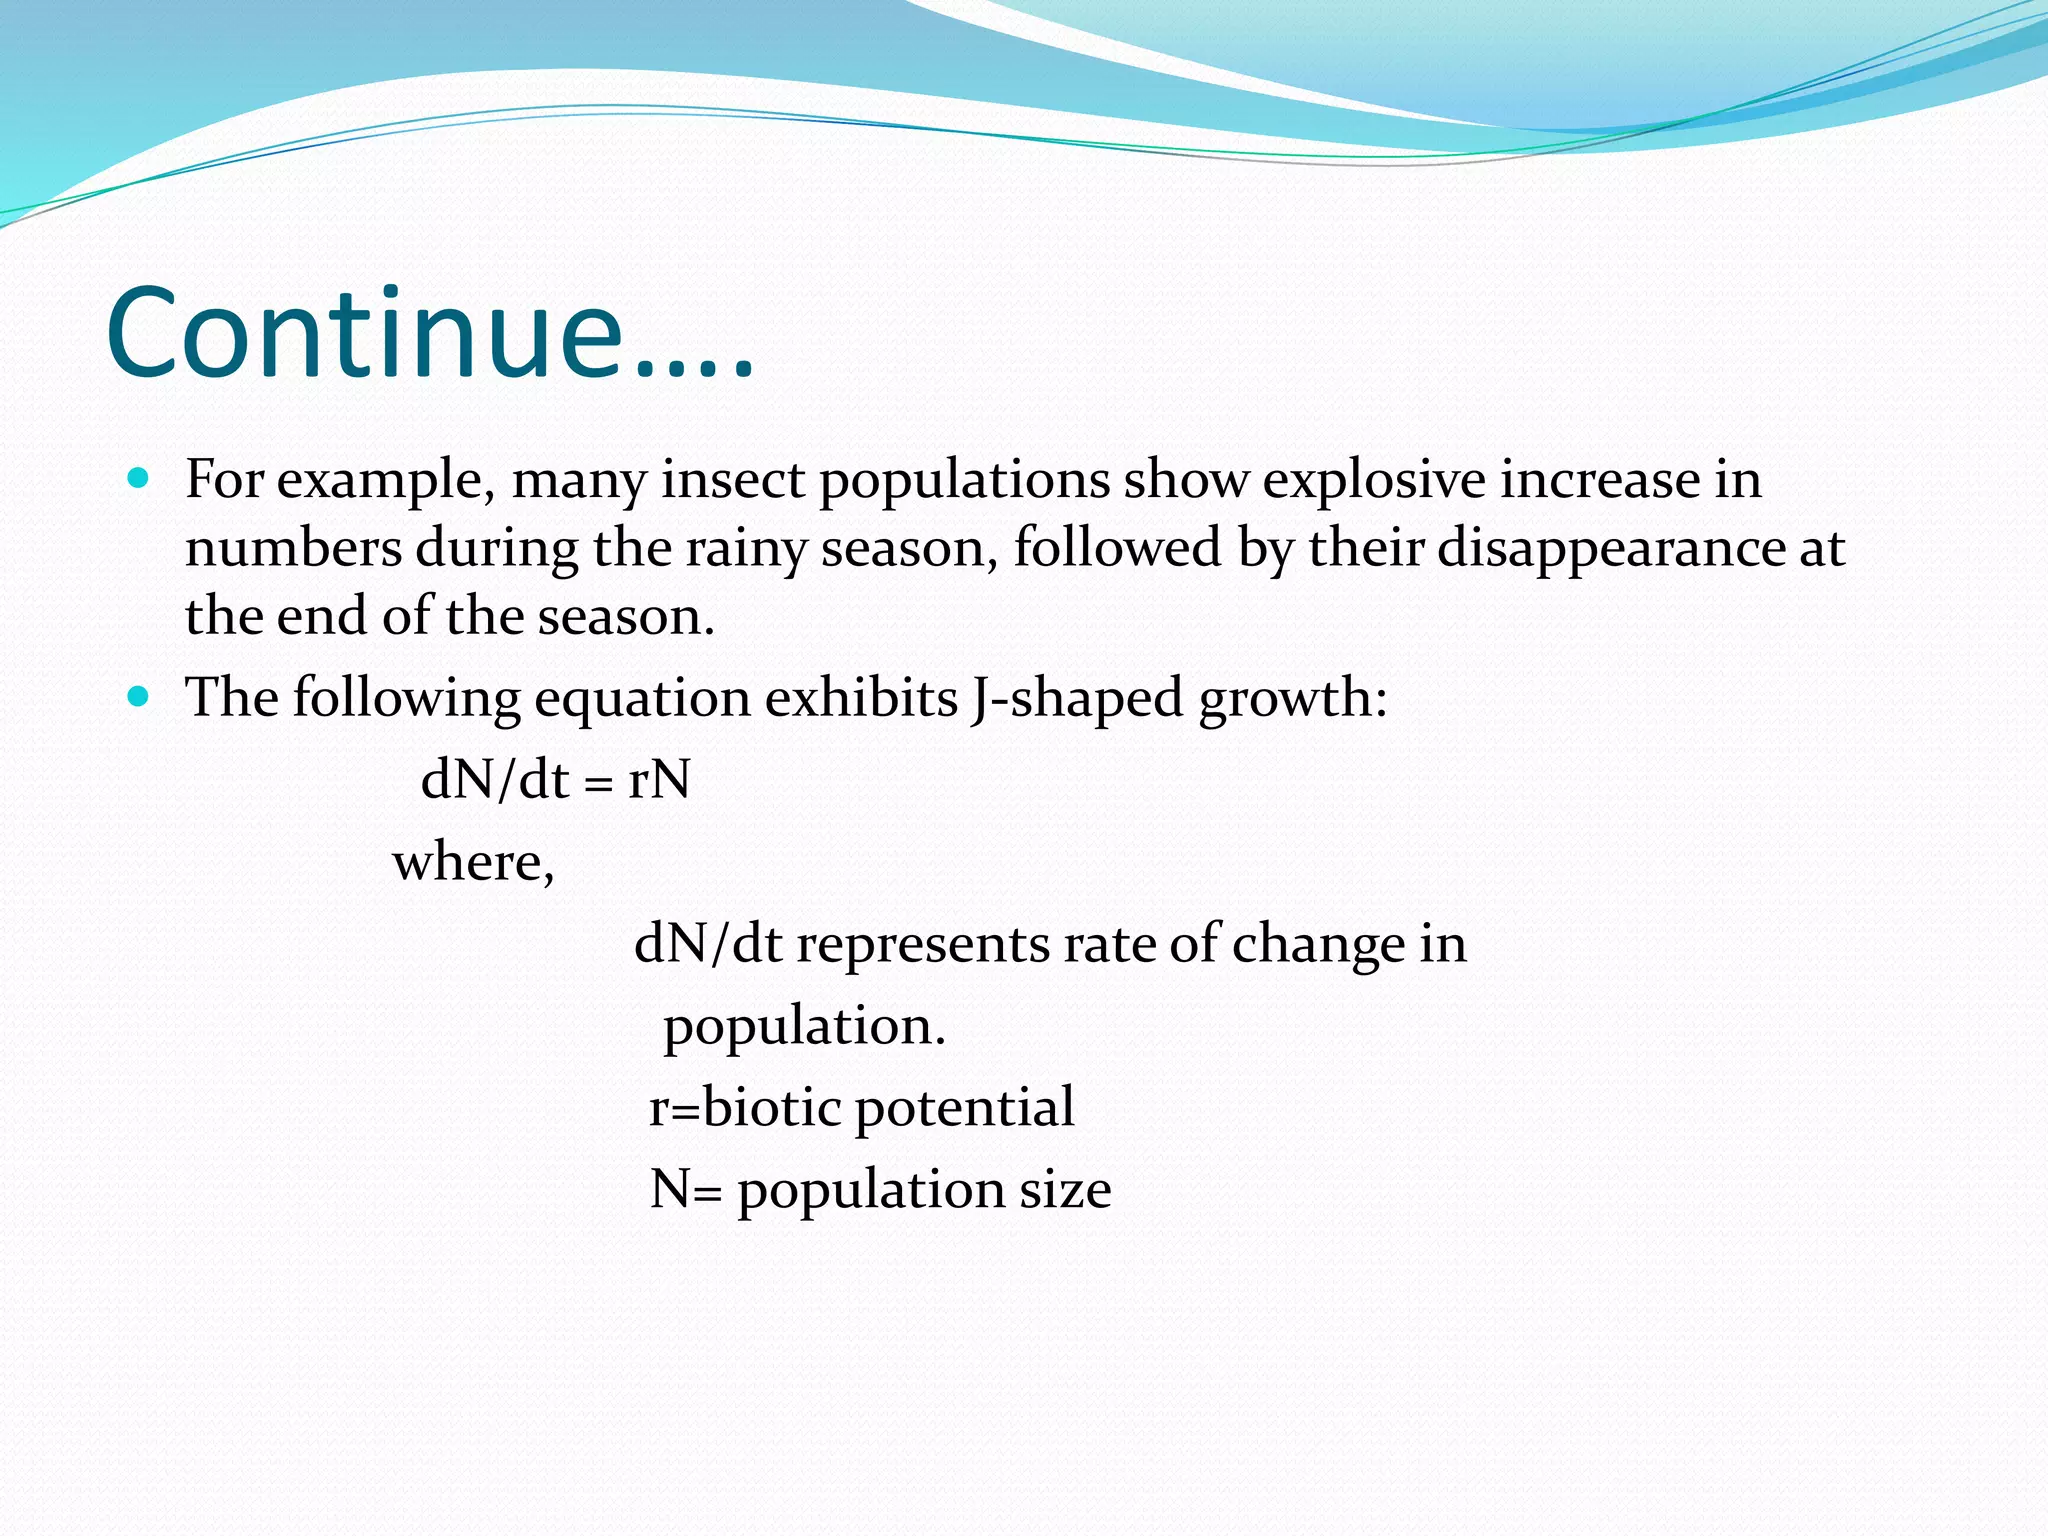
PRESENTED BY-
MD KADER MULLAH
M . Sc 4th semester
Roll No. 16/MSB/76
Department of Botany
USTM
INTRODUCTION
 Population growth curve is something that shows the pattern of
the growth of a population over time i.e., a growth curve is an
empirical model of the evolution of a quantity over time.
 Growth curves are widely used in biology for quantities such as
population size or biomass , individual body height or biomass.
Values for the measured property can be plotted on a graph as a
function of time.
 In theory , any kind of organism could take over the Earth just
by reproducing.
Continue…..
 But in practical, all living organisms need some
specific resources such as nutrients and proper
environmental conditions to survive and reproduce.
 The essential resources are not unlimited, and a
population can only reach a size that match the
availability of resources in its local environment.
TYPES OF POPULATION GROWTH CURVES
There are mainly two types of population growth curves-
1. Exponential growth curve( J-shaped)
&
2. Sigmoid growth curve(S-shaped)
EXPONENTIAL GROWTH CURVE
 In this type of growth form, the population grows
exponentially, and after attaining the peak value the
population may abruptly crash.
 This increase in population is continued till large amount
of food materials exist in the habitat.
 After sometime, due to increase in population size the food
supply in the habitat becomes limited which ultimately
results in decrease in population size.
Continue….
 For example, many insect populations show explosive increase in
numbers during the rainy season, followed by their disappearance at
the end of the season.
 The following equation exhibits J-shaped growth:
dN/dt = rN
where,
dN/dt represents rate of change in
population.
r=biotic potential
N= population size
Continue…….
Figure: J-shaped growth curve
SIGMOID GROWTH CURVE
 The sigmoid growth curve is also known as Logistics growth
curve which is S-shaped.
 When a few organisms are introduced in an area, the population
increase is very slow in the beginning i,e., the positive
acceleration phase or lag phase.
 In the middle phase the population increase becomes very rapid
which is known as logarithmic phase.
 Finally in the last phase the population increase is slowed down
i,e. negative acceleration phase.
Continue….
 The level beyond which no major increase can occur is
referred to as saturation level or carrying capacity
which is denoted by K.
 In the last phase the new organisms are almost equal
to the number of dying individuals and thus there is
no more increase in the population size.
Continue….
 The J-shaped (sigmoid) growth form is represented by
the following equation:
dN/dt = rN(K-N/K)
=rN(1-N/K)
Here,
dN/dt is the rate of change in population size.
r= biotic potential
N= population size
(K-N/K) is for environmental resistance.
S-shaped growth curve
CARRYING CAPACITY?
 The carrying capacity of a biological species in an environment is
the maximum population size of the species that the
environment can sustain indefinitely , given the food , habitat ,
water and other necessities available in the environment.
 In population ecology, the carrying capacity is defined as the
environment’s maximal load.
 Carrying capacity was originally used to determine the number
of animals that could graze on a segment of land without
destroying it. Later the idea has been expanded to more complex
populations.
THANK YOU

populationgrowthcurves-180429094152.pdf

  • 1.
    PRESENTED BY- MD KADERMULLAH M . Sc 4th semester Roll No. 16/MSB/76 Department of Botany USTM
  • 2.
    INTRODUCTION  Population growthcurve is something that shows the pattern of the growth of a population over time i.e., a growth curve is an empirical model of the evolution of a quantity over time.  Growth curves are widely used in biology for quantities such as population size or biomass , individual body height or biomass. Values for the measured property can be plotted on a graph as a function of time.  In theory , any kind of organism could take over the Earth just by reproducing.
  • 3.
    Continue…..  But inpractical, all living organisms need some specific resources such as nutrients and proper environmental conditions to survive and reproduce.  The essential resources are not unlimited, and a population can only reach a size that match the availability of resources in its local environment.
  • 4.
    TYPES OF POPULATIONGROWTH CURVES There are mainly two types of population growth curves- 1. Exponential growth curve( J-shaped) & 2. Sigmoid growth curve(S-shaped)
  • 5.
    EXPONENTIAL GROWTH CURVE In this type of growth form, the population grows exponentially, and after attaining the peak value the population may abruptly crash.  This increase in population is continued till large amount of food materials exist in the habitat.  After sometime, due to increase in population size the food supply in the habitat becomes limited which ultimately results in decrease in population size.
  • 6.
    Continue….  For example,many insect populations show explosive increase in numbers during the rainy season, followed by their disappearance at the end of the season.  The following equation exhibits J-shaped growth: dN/dt = rN where, dN/dt represents rate of change in population. r=biotic potential N= population size
  • 7.
  • 8.
    SIGMOID GROWTH CURVE The sigmoid growth curve is also known as Logistics growth curve which is S-shaped.  When a few organisms are introduced in an area, the population increase is very slow in the beginning i,e., the positive acceleration phase or lag phase.  In the middle phase the population increase becomes very rapid which is known as logarithmic phase.  Finally in the last phase the population increase is slowed down i,e. negative acceleration phase.
  • 9.
    Continue….  The levelbeyond which no major increase can occur is referred to as saturation level or carrying capacity which is denoted by K.  In the last phase the new organisms are almost equal to the number of dying individuals and thus there is no more increase in the population size.
  • 10.
    Continue….  The J-shaped(sigmoid) growth form is represented by the following equation: dN/dt = rN(K-N/K) =rN(1-N/K) Here, dN/dt is the rate of change in population size. r= biotic potential N= population size (K-N/K) is for environmental resistance.
  • 11.
  • 12.
    CARRYING CAPACITY?  Thecarrying capacity of a biological species in an environment is the maximum population size of the species that the environment can sustain indefinitely , given the food , habitat , water and other necessities available in the environment.  In population ecology, the carrying capacity is defined as the environment’s maximal load.  Carrying capacity was originally used to determine the number of animals that could graze on a segment of land without destroying it. Later the idea has been expanded to more complex populations.
  • 15.