Download to read offline

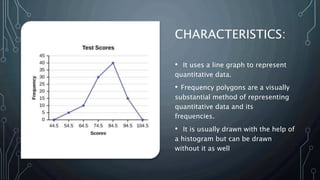

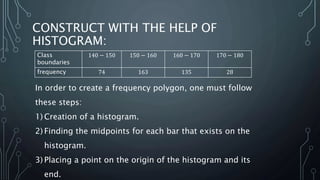
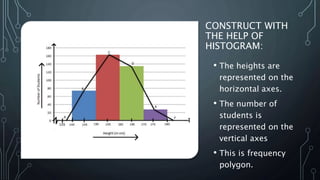
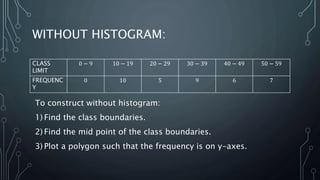
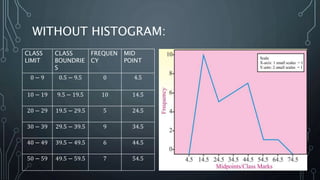
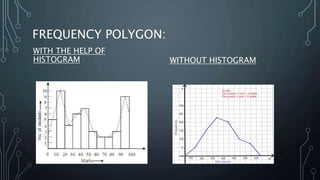
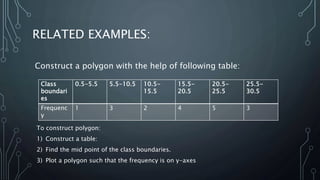
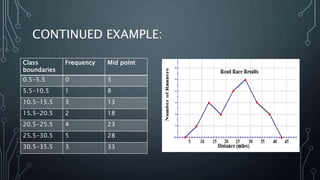
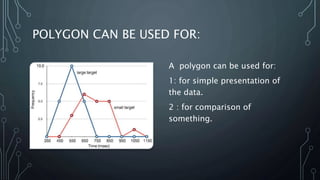


A frequency polygon is a graphical representation of quantitative data using line segments to connect data points plotted on a coordinate plane. It can be constructed using either a histogram or the raw data values. To construct using a histogram, the midpoints of each histogram bar are plotted on the x-axis and the frequencies on the y-axis, connecting the points with line segments. Alternatively, constructing without a histogram involves plotting the class boundaries, midpoints, and frequencies. Frequency polygons are useful for presenting and comparing distributions of data.


