The document focuses on teaching frequency polygons, covering key terms and learning objectives for different levels of learners. It includes various examples, exercises, and solutions related to creating frequency tables and interpreting frequency polygons from different datasets. The content is structured to enhance understanding of data representation and analysis through frequency polygons.
![We are learning to: Draw and interpret frequency polygons.
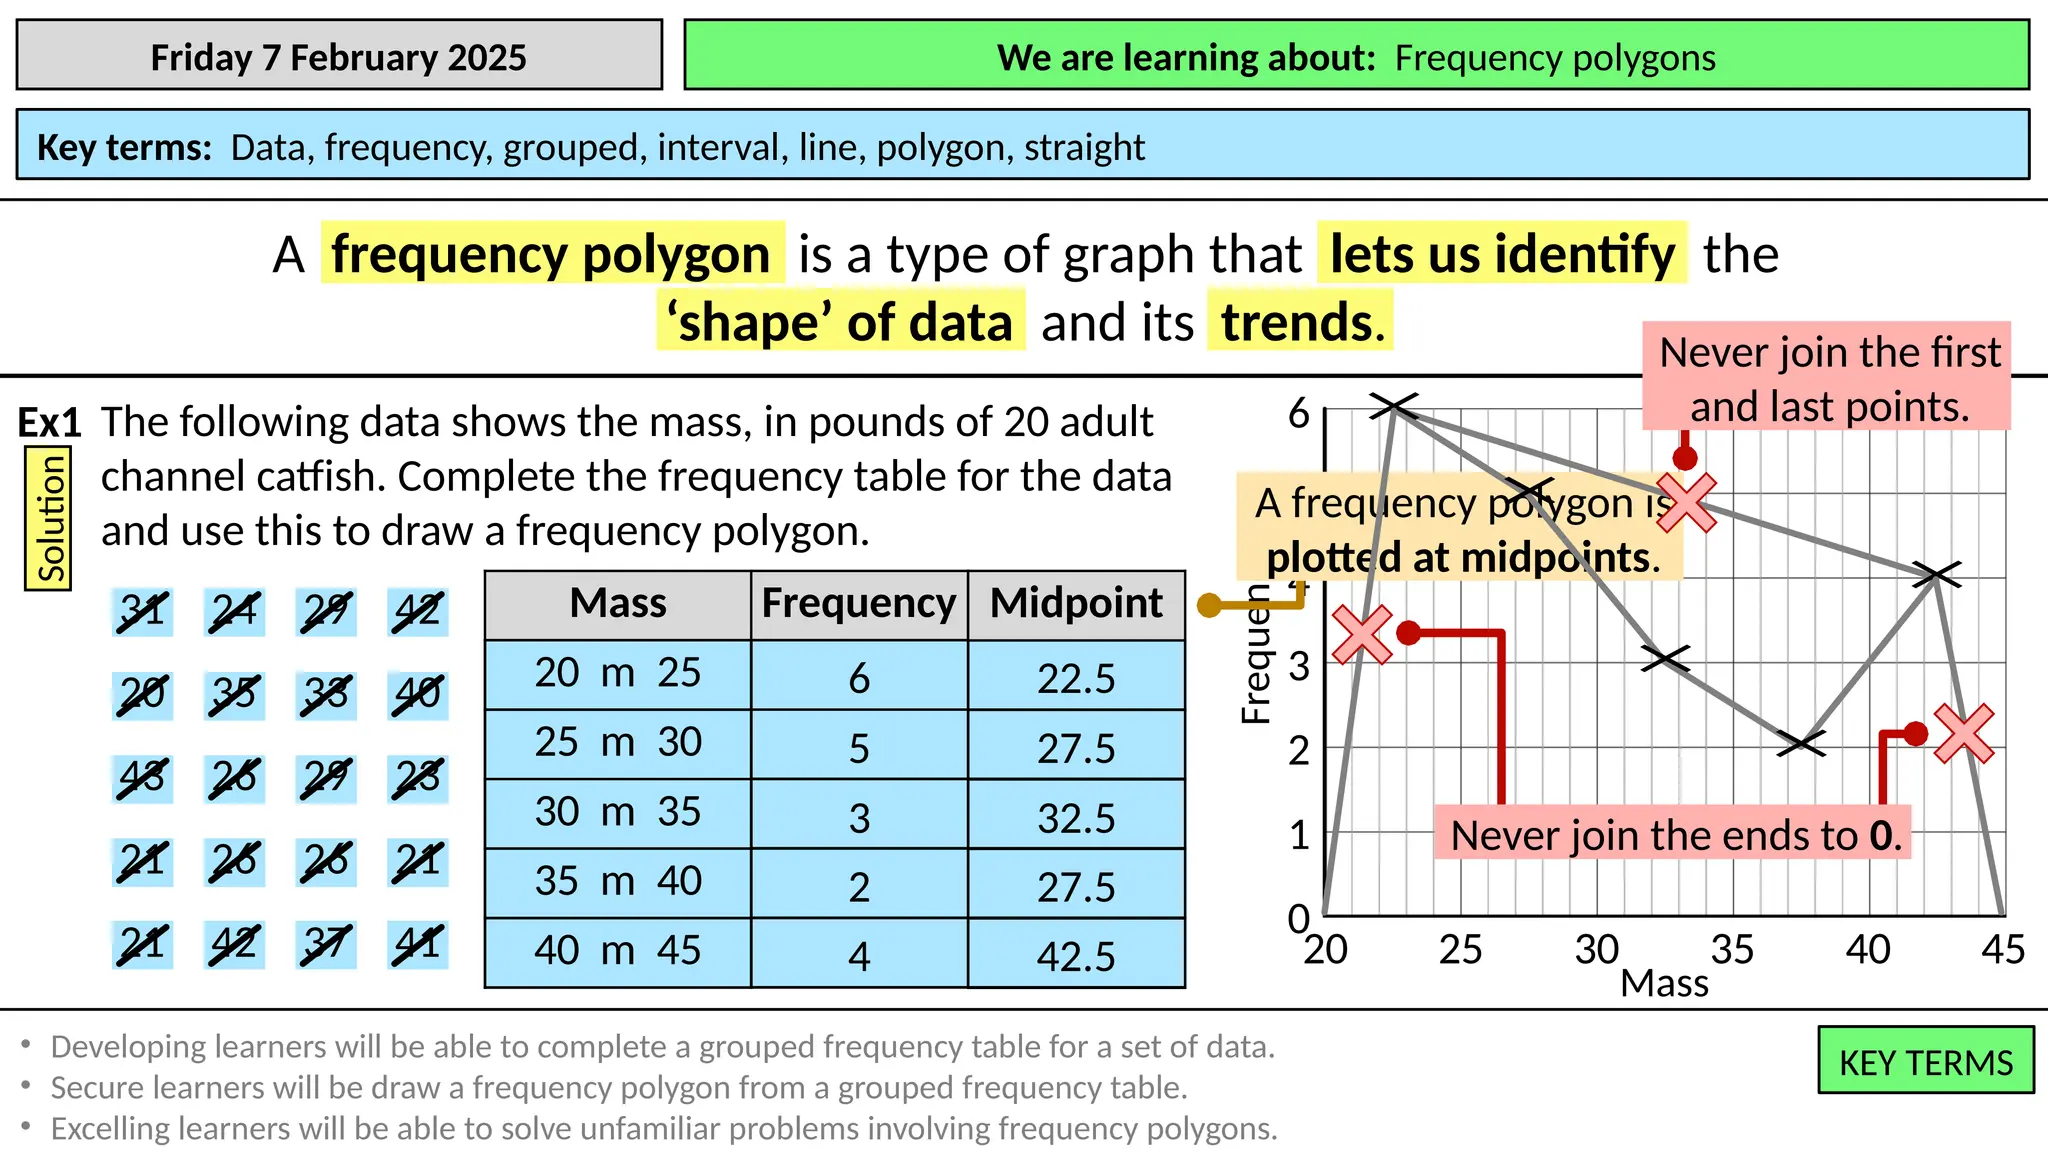
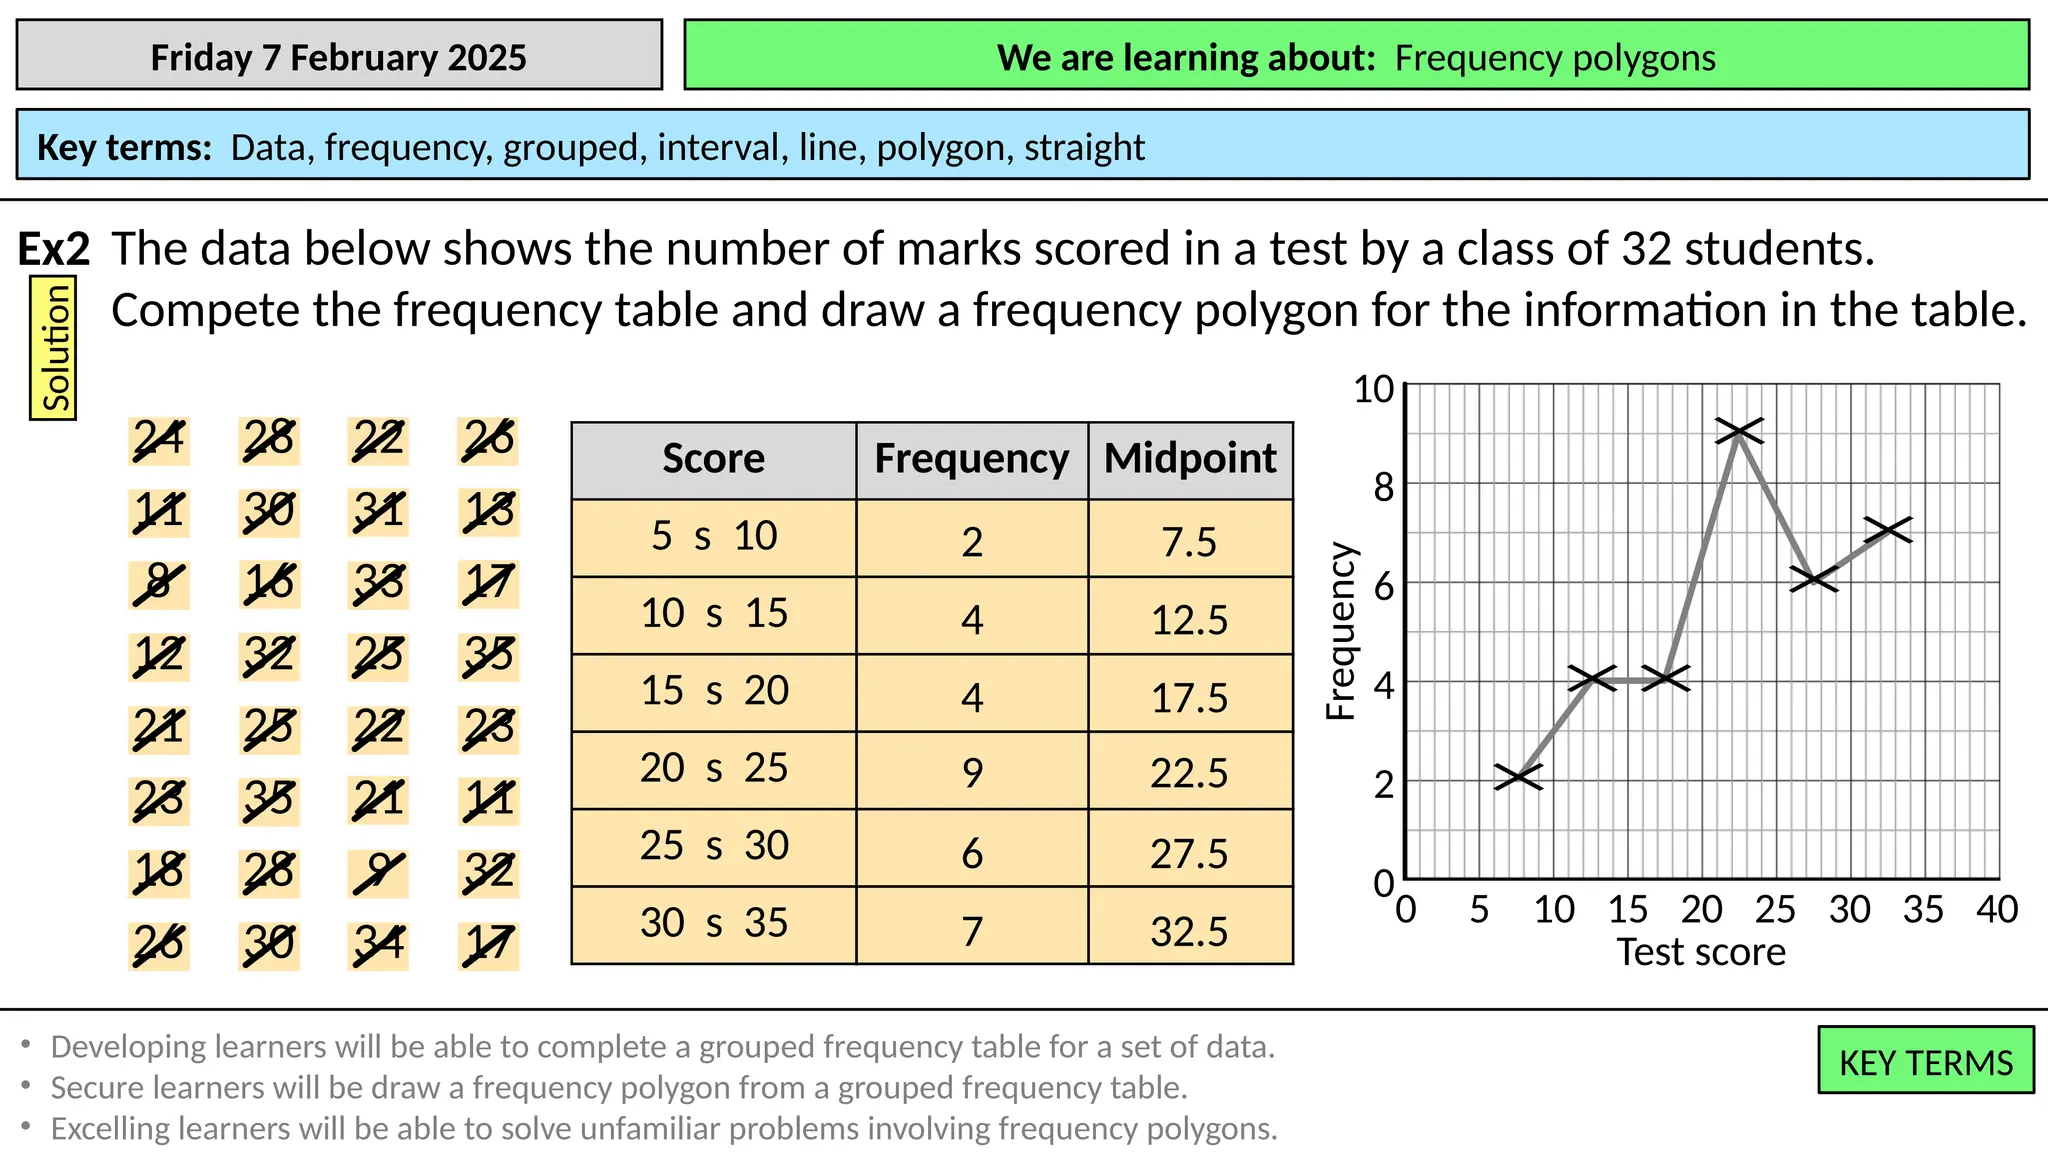
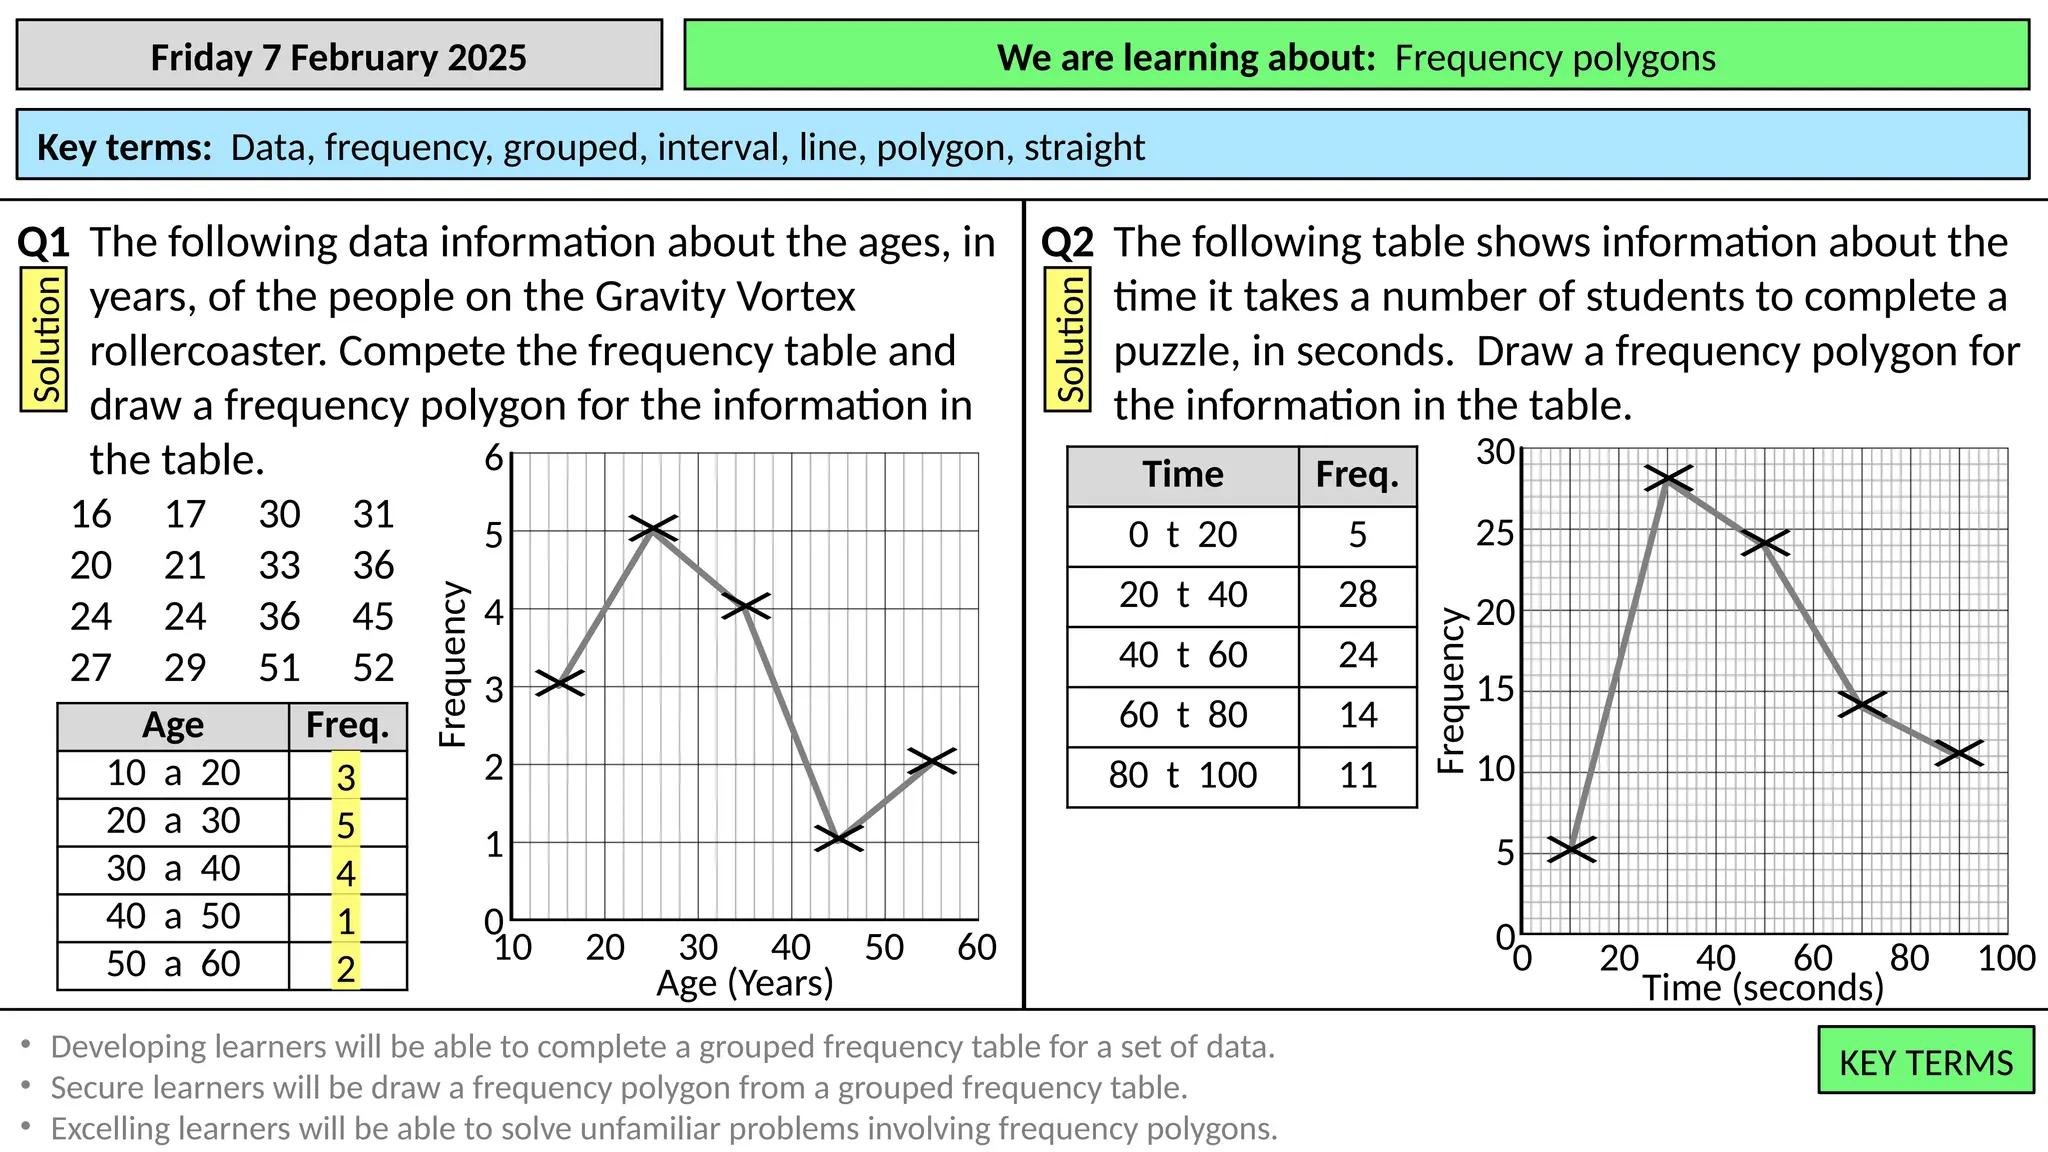
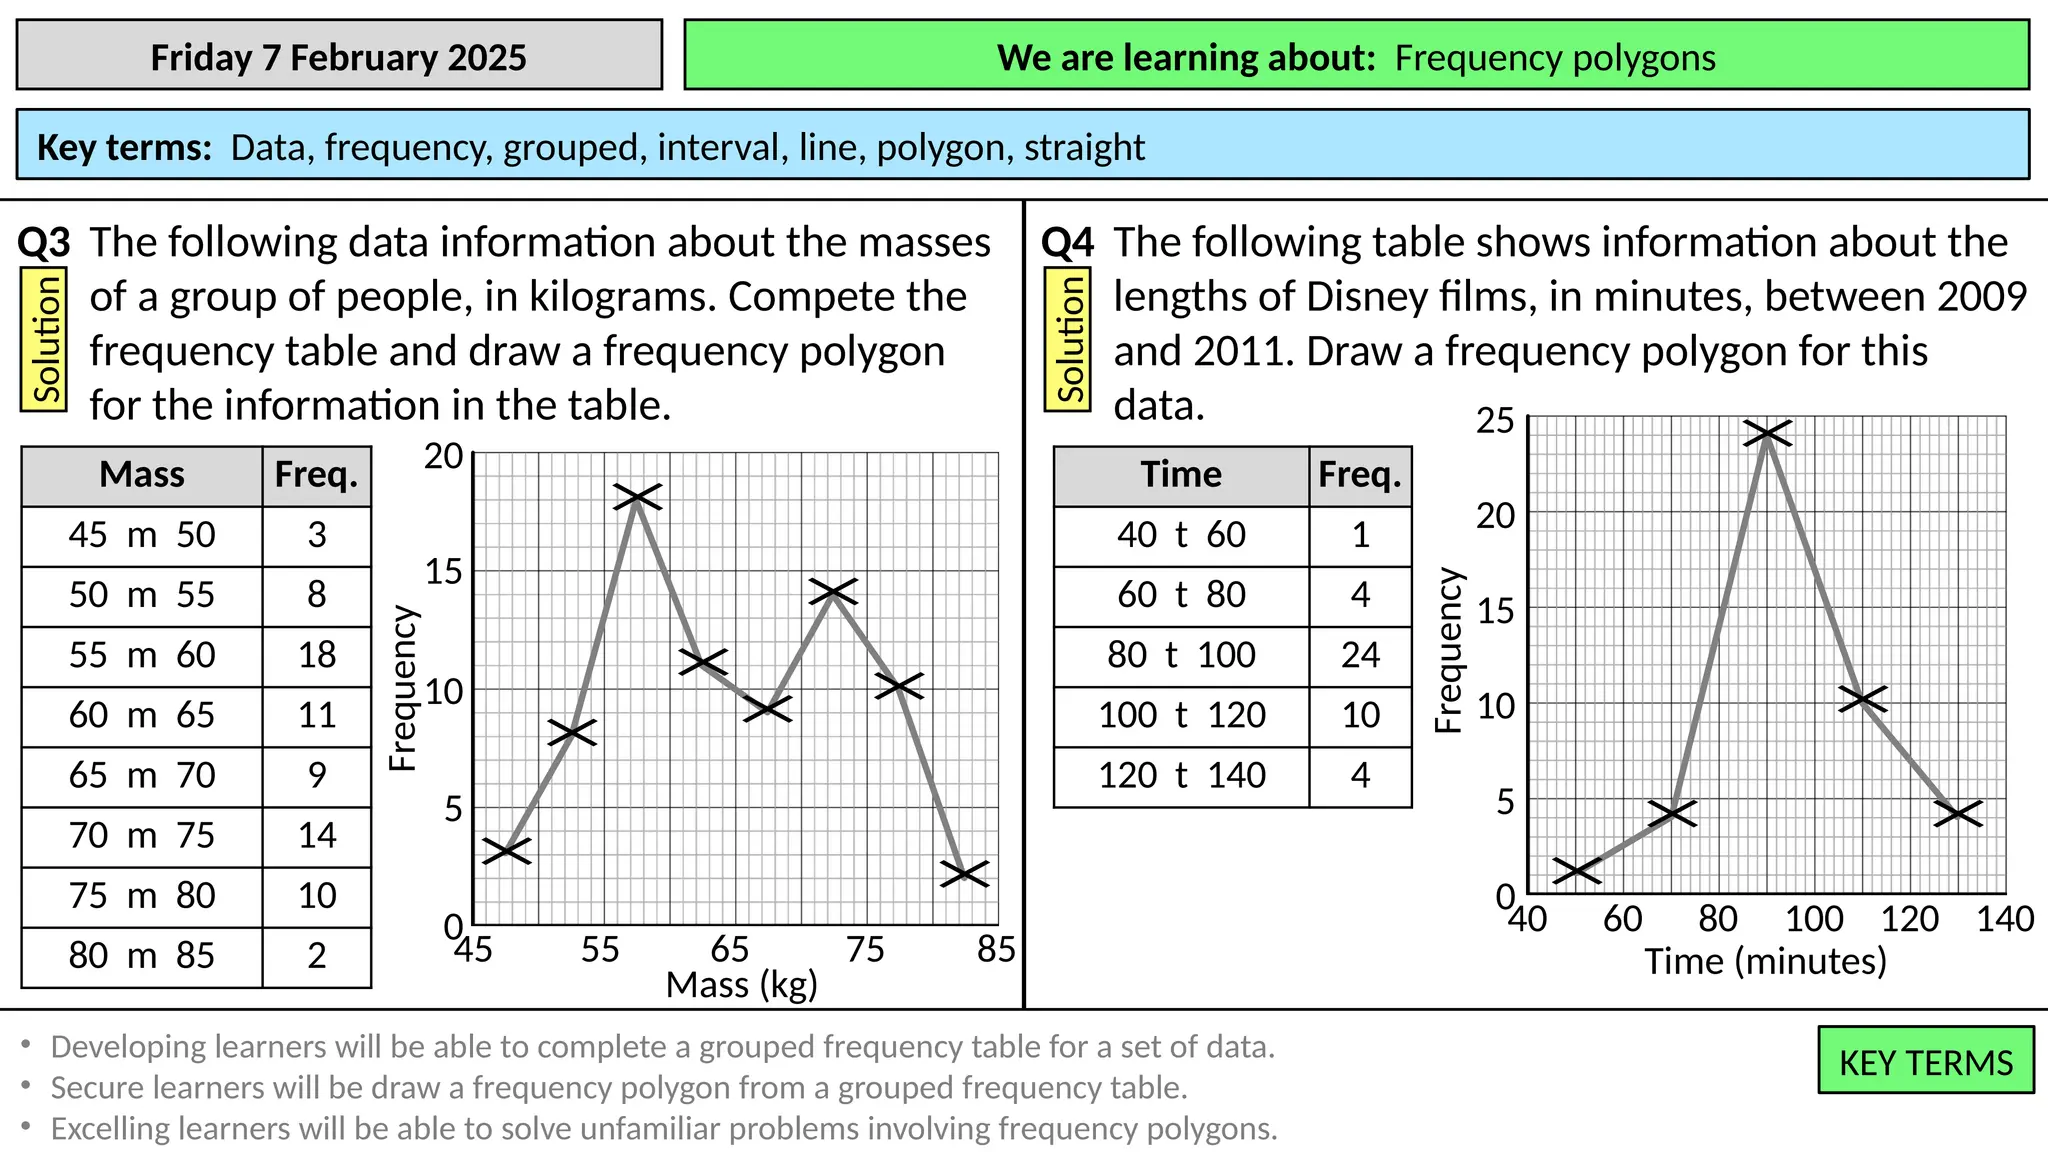
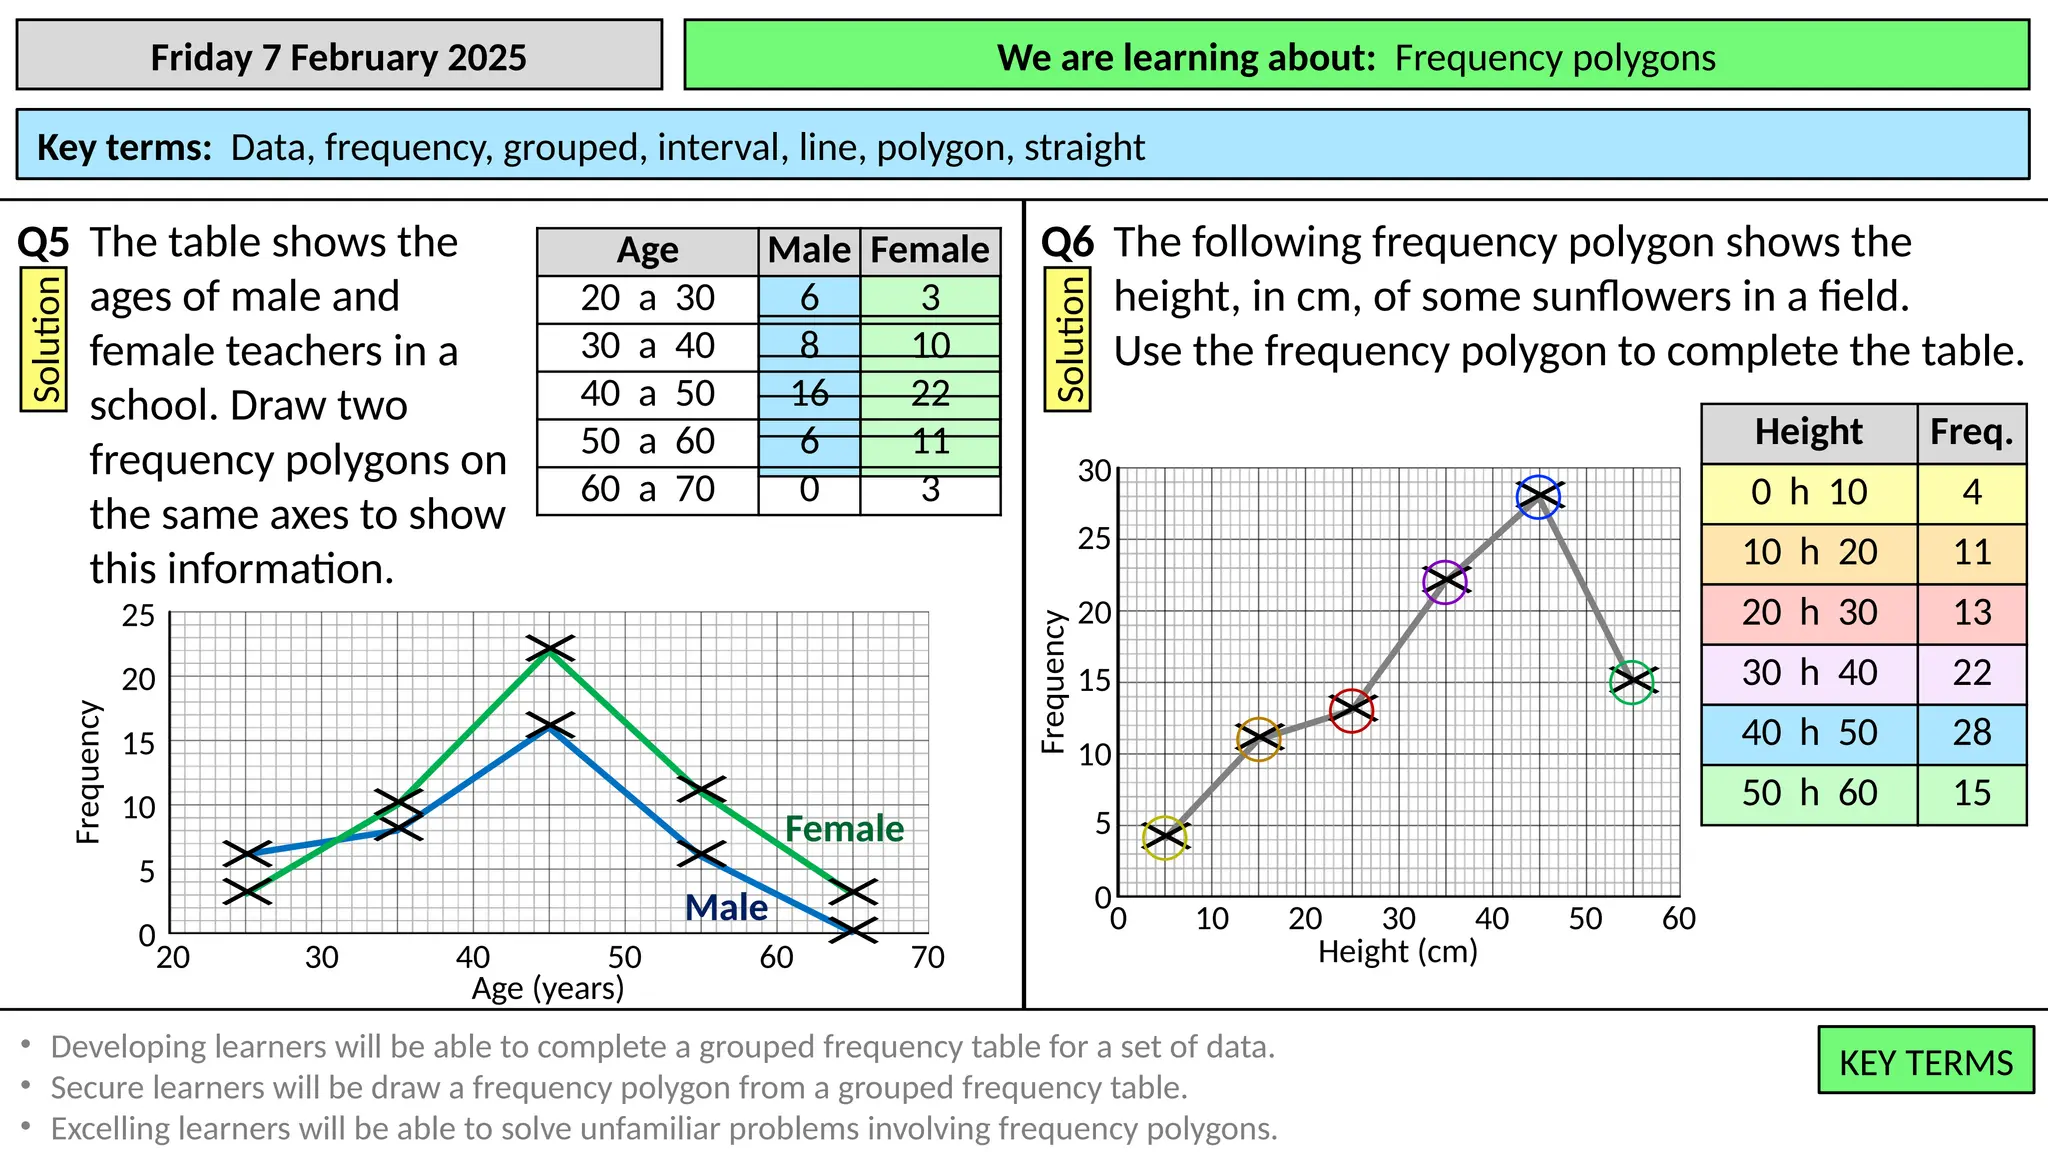
Friday 7 February 2025 We are learning about: Frequency polygons
Key terms: Data, frequency, grouped, interval, line, polygon, straight
KEY TERMS
KEY TERMS
• Developing learners will be able to complete a grouped frequency table for a set of data.
• Secure learners will be draw a frequency polygon from a grouped frequency table.
• Excelling learners will be able to solve unfamiliar problems involving frequency polygons.
Time (mins)
0 10 20 30 40 50 60 70 80
0
10
5
15
20
Frequency
×
×
×
×
×
× ×
×
Ex3 The frequency polygon shows the information
about amount of time spent by people in the
supermarket.
Solution
[a] What is the modal class interval?
[b] Explain why we can’t say how many people
spent exactly 44 minutes in the supermarket.
10 t 20
We only have groups of times. Not
the individual times for each person.
Ex4 The frequency polygon shows information on
how long people spend in a gym. Calculate an
estimate of the mean time spent in the gym.
Solution
Time (mins)
120
100
80
60
40
20
0
0
5
10
15
20
25
30
Frequency
×
×
×
×
×
×
Total minutes
10 1
30 18
50 29
70 20
90 16
110 6
5500
Total people
1 18 29 20 16 6
90
Mean 5500 90
Mean 61.1 minutes(1dp)](https://image.slidesharecdn.com/7f-frequency-polygons-250207065500-04ad8114/75/7f-Frequency-polygons-pptxpptpptpptpptppt-6-2048.jpg)
![We are learning to: Draw and interpret frequency polygons.
Friday 7 February 2025 We are learning about: Frequency polygons
Key terms: Data, frequency, grouped, interval, line, polygon, straight
KEY TERMS
KEY TERMS
• Developing learners will be able to complete a grouped frequency table for a set of data.
• Secure learners will be draw a frequency polygon from a grouped frequency table.
• Excelling learners will be able to solve unfamiliar problems involving frequency polygons.
Q1 Simon has drawn a frequency polygon showing
information about amount of time a random
sample of people spend in the swimming pool.
Solution
[a] How many people were in the sample?
[b] What is the modal class interval?
Time (mins)
0 10 20 30 40 50
0
10
5
15
20
Frequency
25
×
×
×
×
×
Q2 The frequency polygon shows the lengths, in cm,
of a random sample of saltwater crocodiles.
Solution
[a] How many crocodiles were sampled?
[b] What is the modal class?
[c] Calculate an estimate for the mean length of
a saltwater crocodile.
Length (cm)
440 450 460 490 500 520
0
10
5
15
Frequency
20
470 480 510
× ×
×
×
× ×
×
×
20 t 30
62
93
470 t 480
484.7cm](https://image.slidesharecdn.com/7f-frequency-polygons-250207065500-04ad8114/75/7f-Frequency-polygons-pptxpptpptpptpptppt-7-2048.jpg)
![We are learning to: Draw and interpret frequency polygons.
Friday 7 February 2025 We are learning about: Frequency polygons
Key terms: Data, frequency, grouped, interval, line, polygon, straight
KEY TERMS
KEY TERMS
• Developing learners will be able to complete a grouped frequency table for a set of data.
• Secure learners will be draw a frequency polygon from a grouped frequency table.
• Excelling learners will be able to solve unfamiliar problems involving frequency polygons.
Q3 The frequency polygon shows the masses, in
grams, of a random sample of bananas.
Solution
Q4 The frequency polygon shows difference in scores
between the winning and losing teams in a
random sample of rugby games.
Solution
[a] How many games were sampled?
[b] What is the modal class interval?
[c] Calculate an estimate for the mean
difference in score.
[a] How many people were in the sample?
[b] What is the modal class interval?
[c] Calculate an estimate for the mean mass of a
banana.
×
Mass (grams)
80 110 120
0
3
1
5
Frequency
6
90 100 130
2
4
×
×
×
×
Score difference
0 10 30 50
0
10
5
15
Frequency
20 40
×
×
×
×
×
110 t 110
18
108.3g
10 t 20
30
16.3](https://image.slidesharecdn.com/7f-frequency-polygons-250207065500-04ad8114/75/7f-Frequency-polygons-pptxpptpptpptpptppt-8-2048.jpg)
![We are learning to: Draw and interpret frequency polygons.
Friday 7 February 2025 We are learning about: Frequency polygons
Key terms: Data, frequency, grouped, interval, line, polygon, straight
KEY TERMS
KEY TERMS
• Developing learners will be able to complete a grouped frequency table for a set of data.
• Secure learners will be draw a frequency polygon from a grouped frequency table.
• Excelling learners will be able to solve unfamiliar problems involving frequency polygons.
Q5 The frequency polygon shows ages of a random
sample of women having multiple-delivery births.
Solution
[a] How many women between the ages of 25
and 40 had multiple-delivery births?
[b] Calculate an estimate for the mean age of a
woman having a multiple-delivery birth.
Q6 The frequency polygon shows the resting heart
rates in a sample of men and women. Which
gender has the highest mean heart rate?
Solution
Age (years)
15 20 25 30 40 45
0
10
5
15
20
Frequency
25
35
30
×
×
×
×
×
×
67
Heart rate (bpm)
55 60 65 80 85
0
10
5
15
Frequency
20
70 75 90
25
50 95
×
×
× ×
×
×
×
×
×××
×
×
×
Men Women
33
Men’s mean HR 72.8 bpm
Women’s mean HR 73.7 bpm
Women have the
highest mean HR.](https://image.slidesharecdn.com/7f-frequency-polygons-250207065500-04ad8114/75/7f-Frequency-polygons-pptxpptpptpptpptppt-9-2048.jpg)


