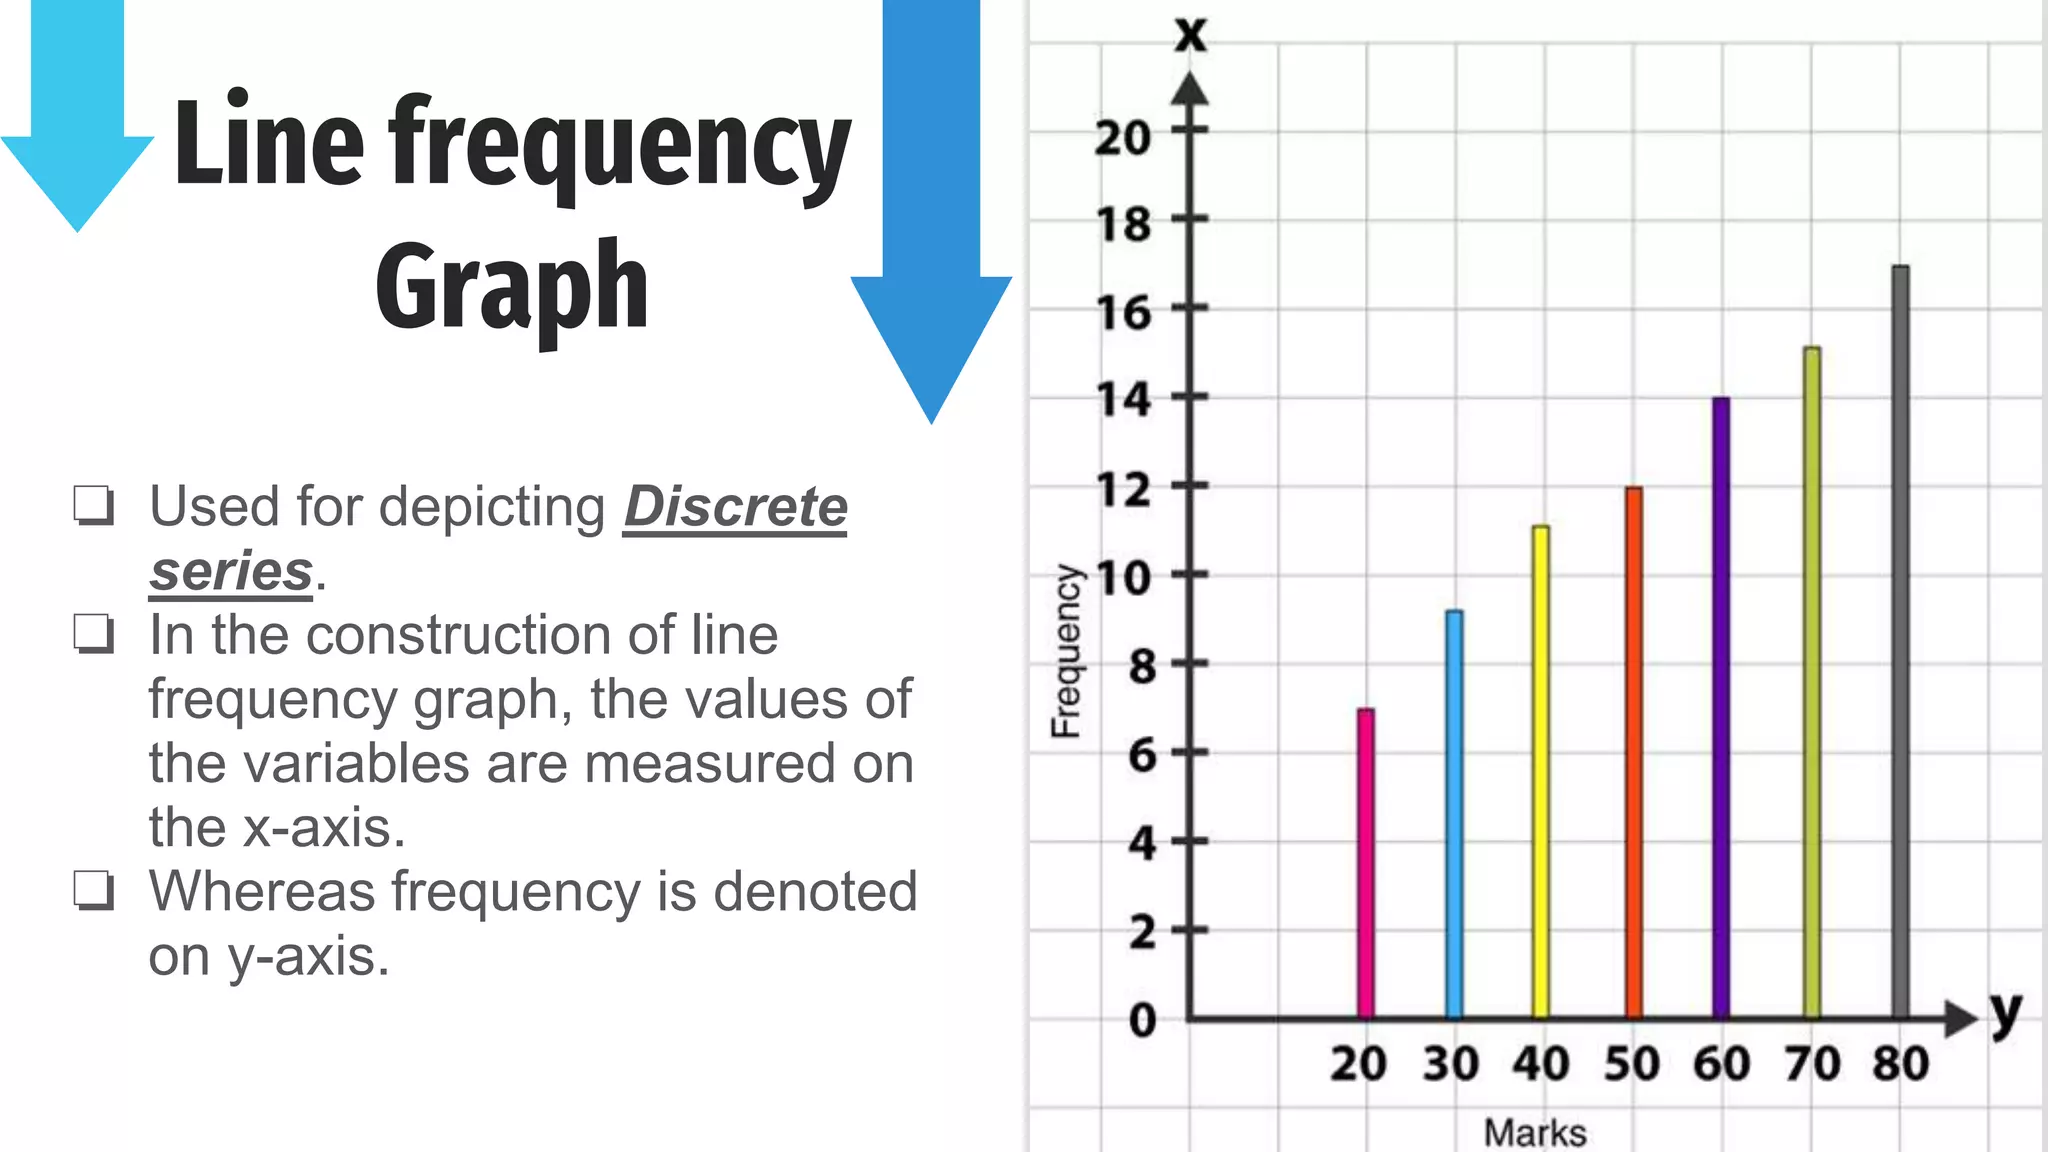
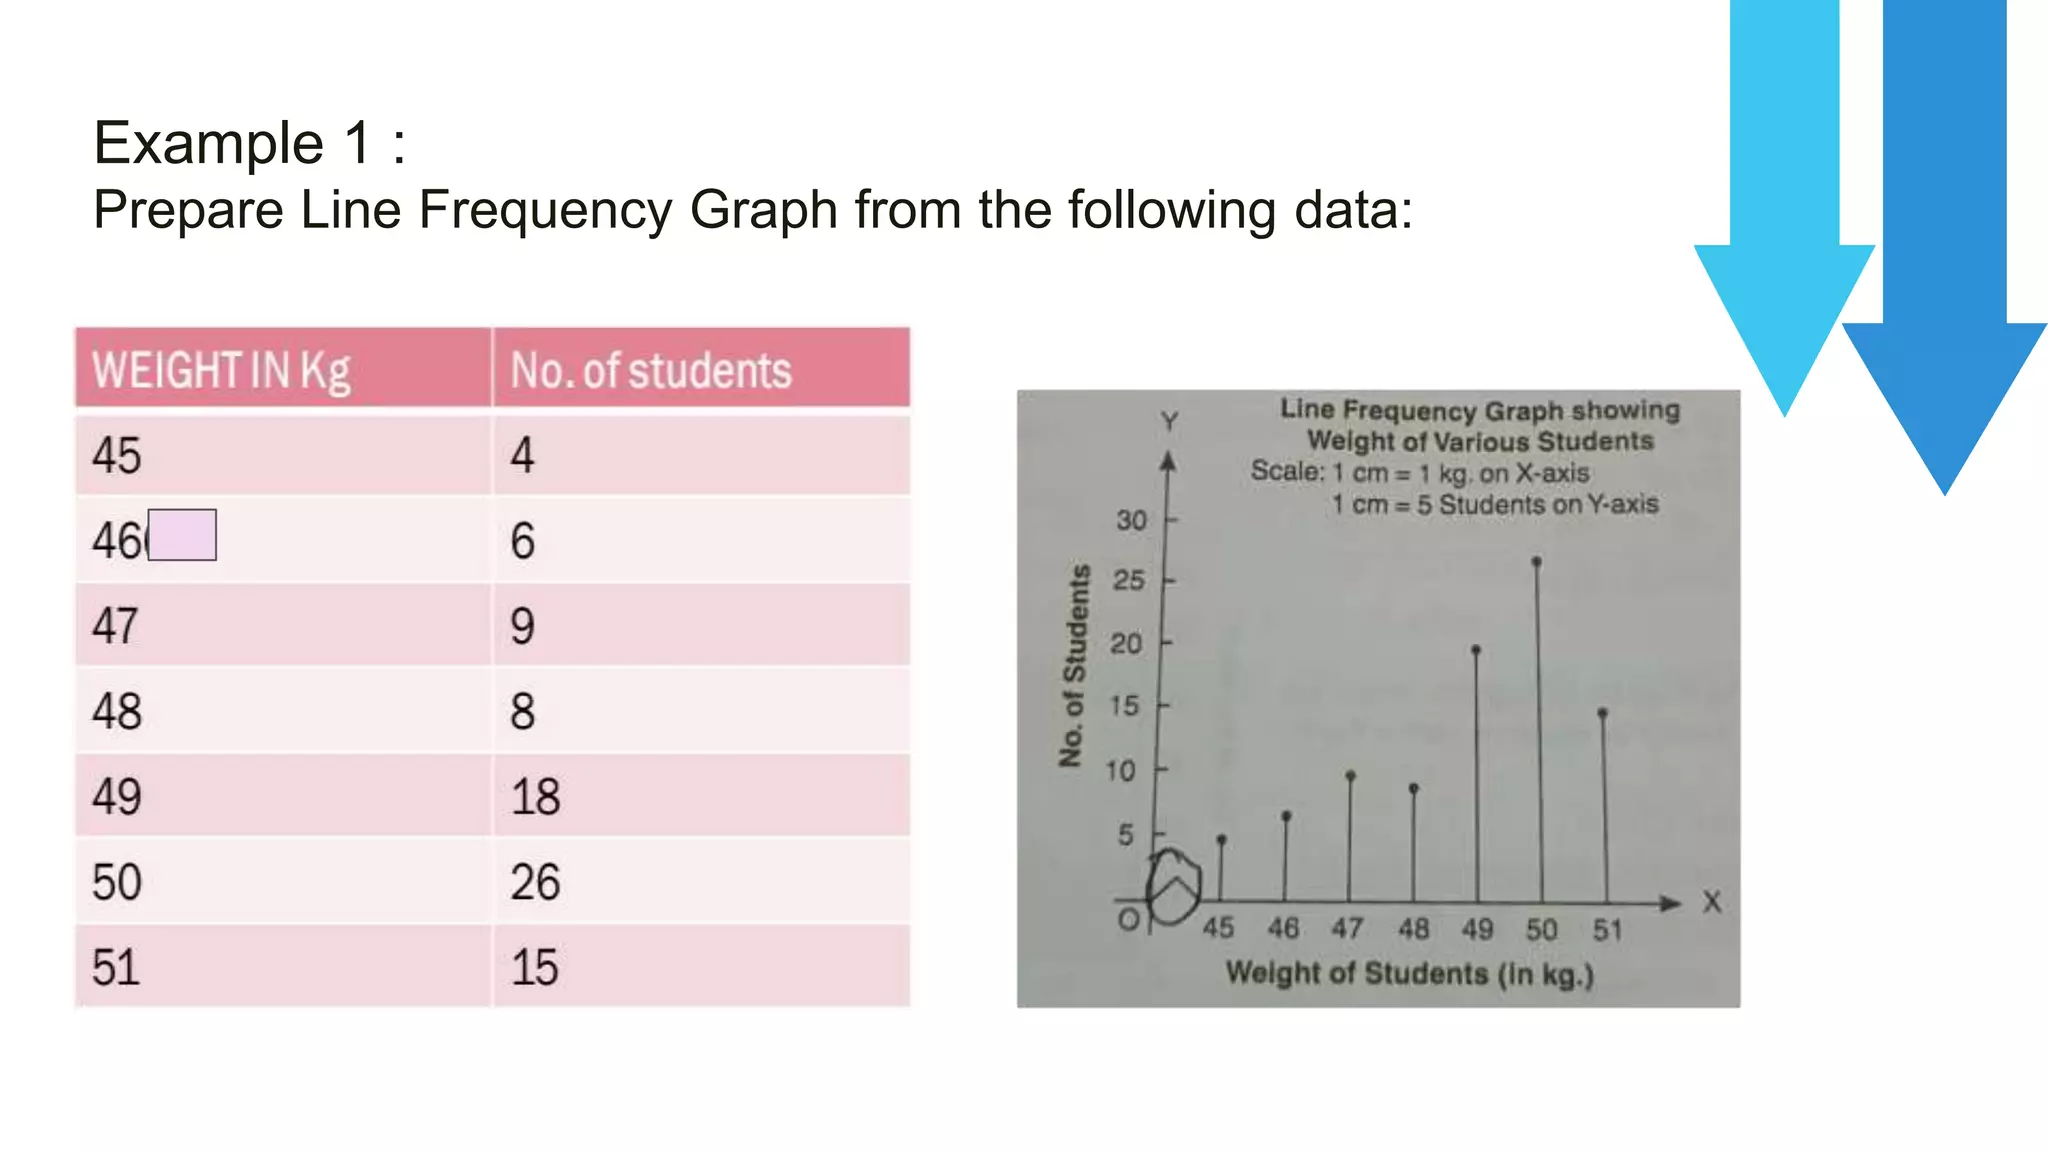
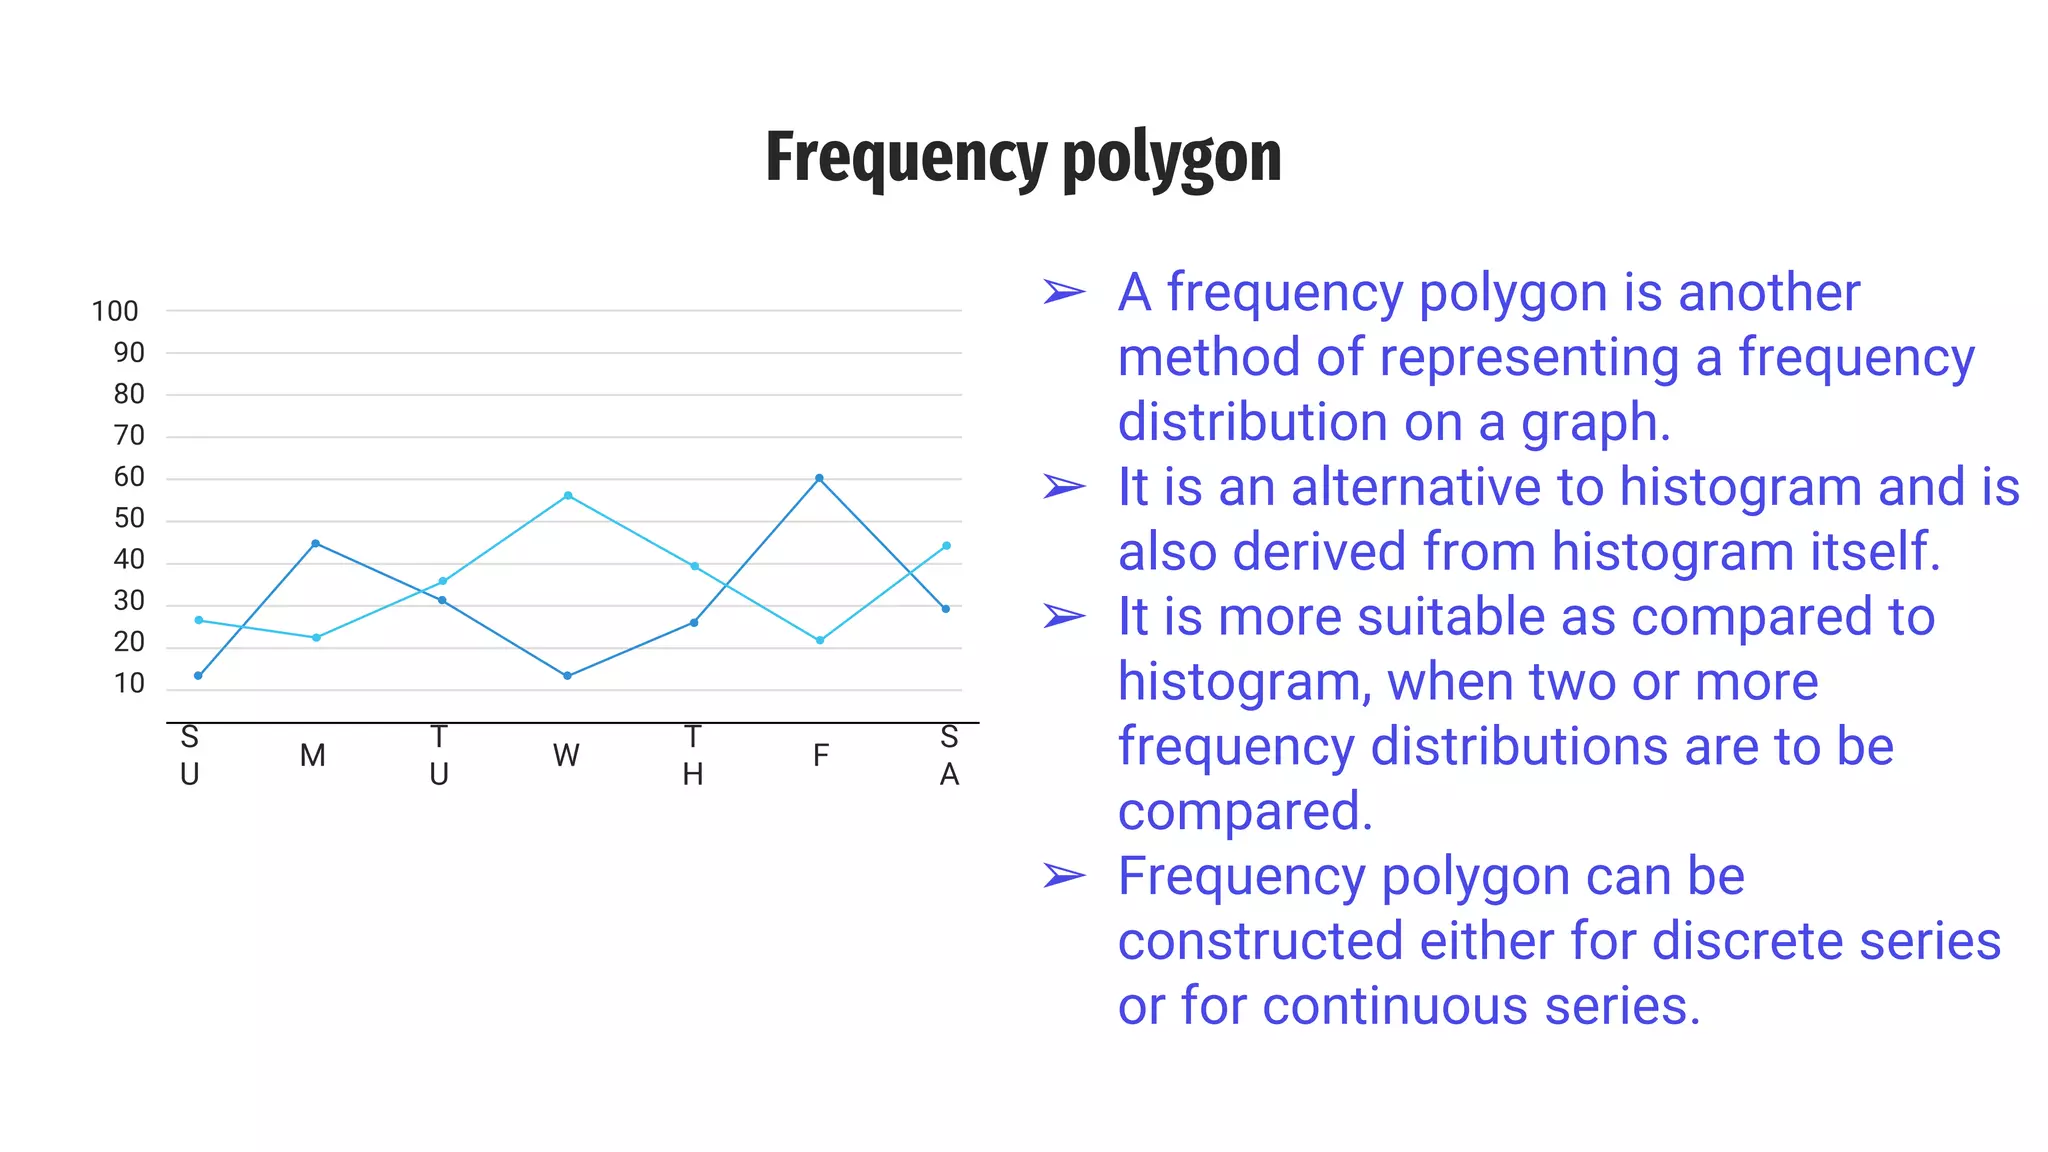
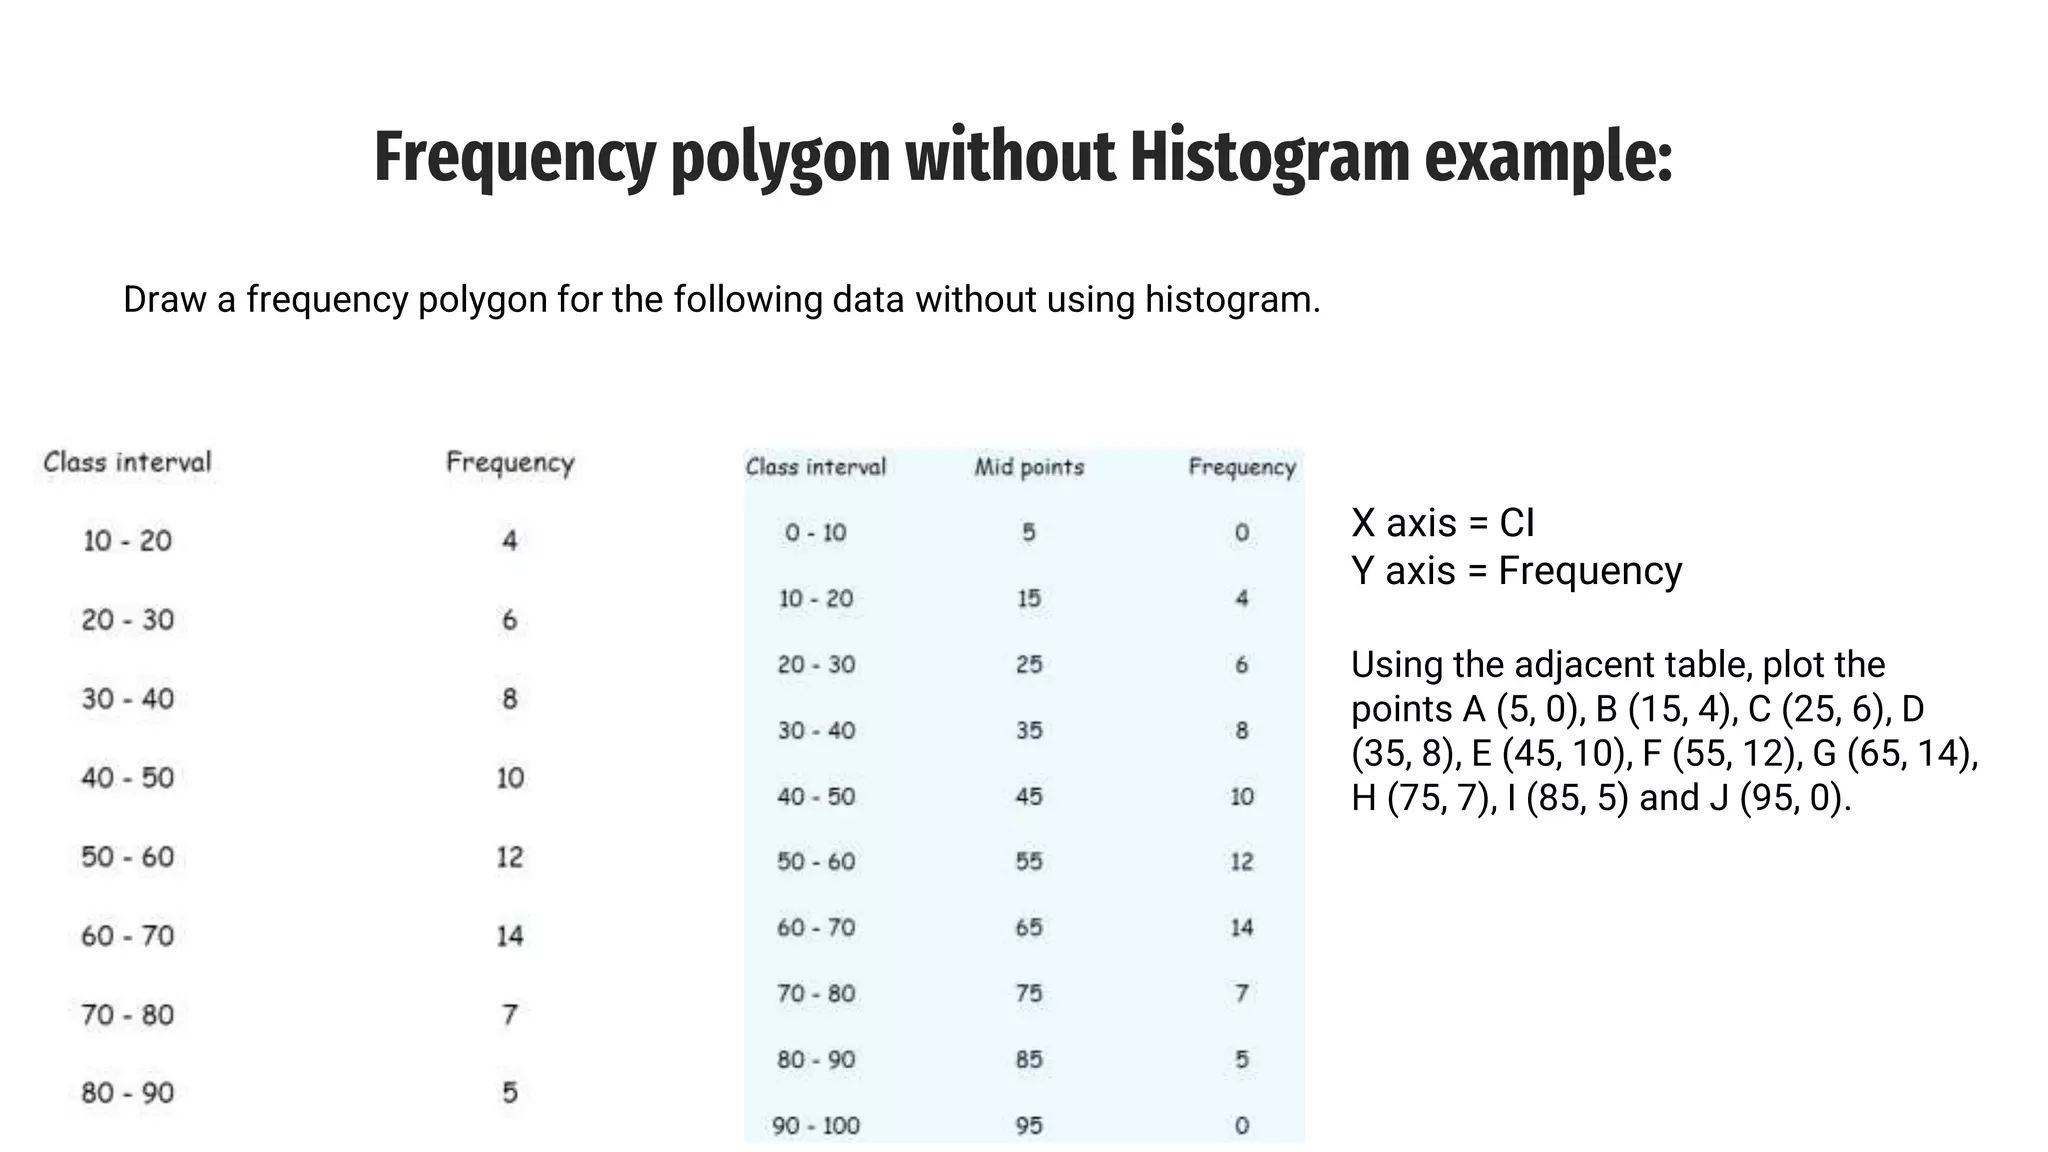
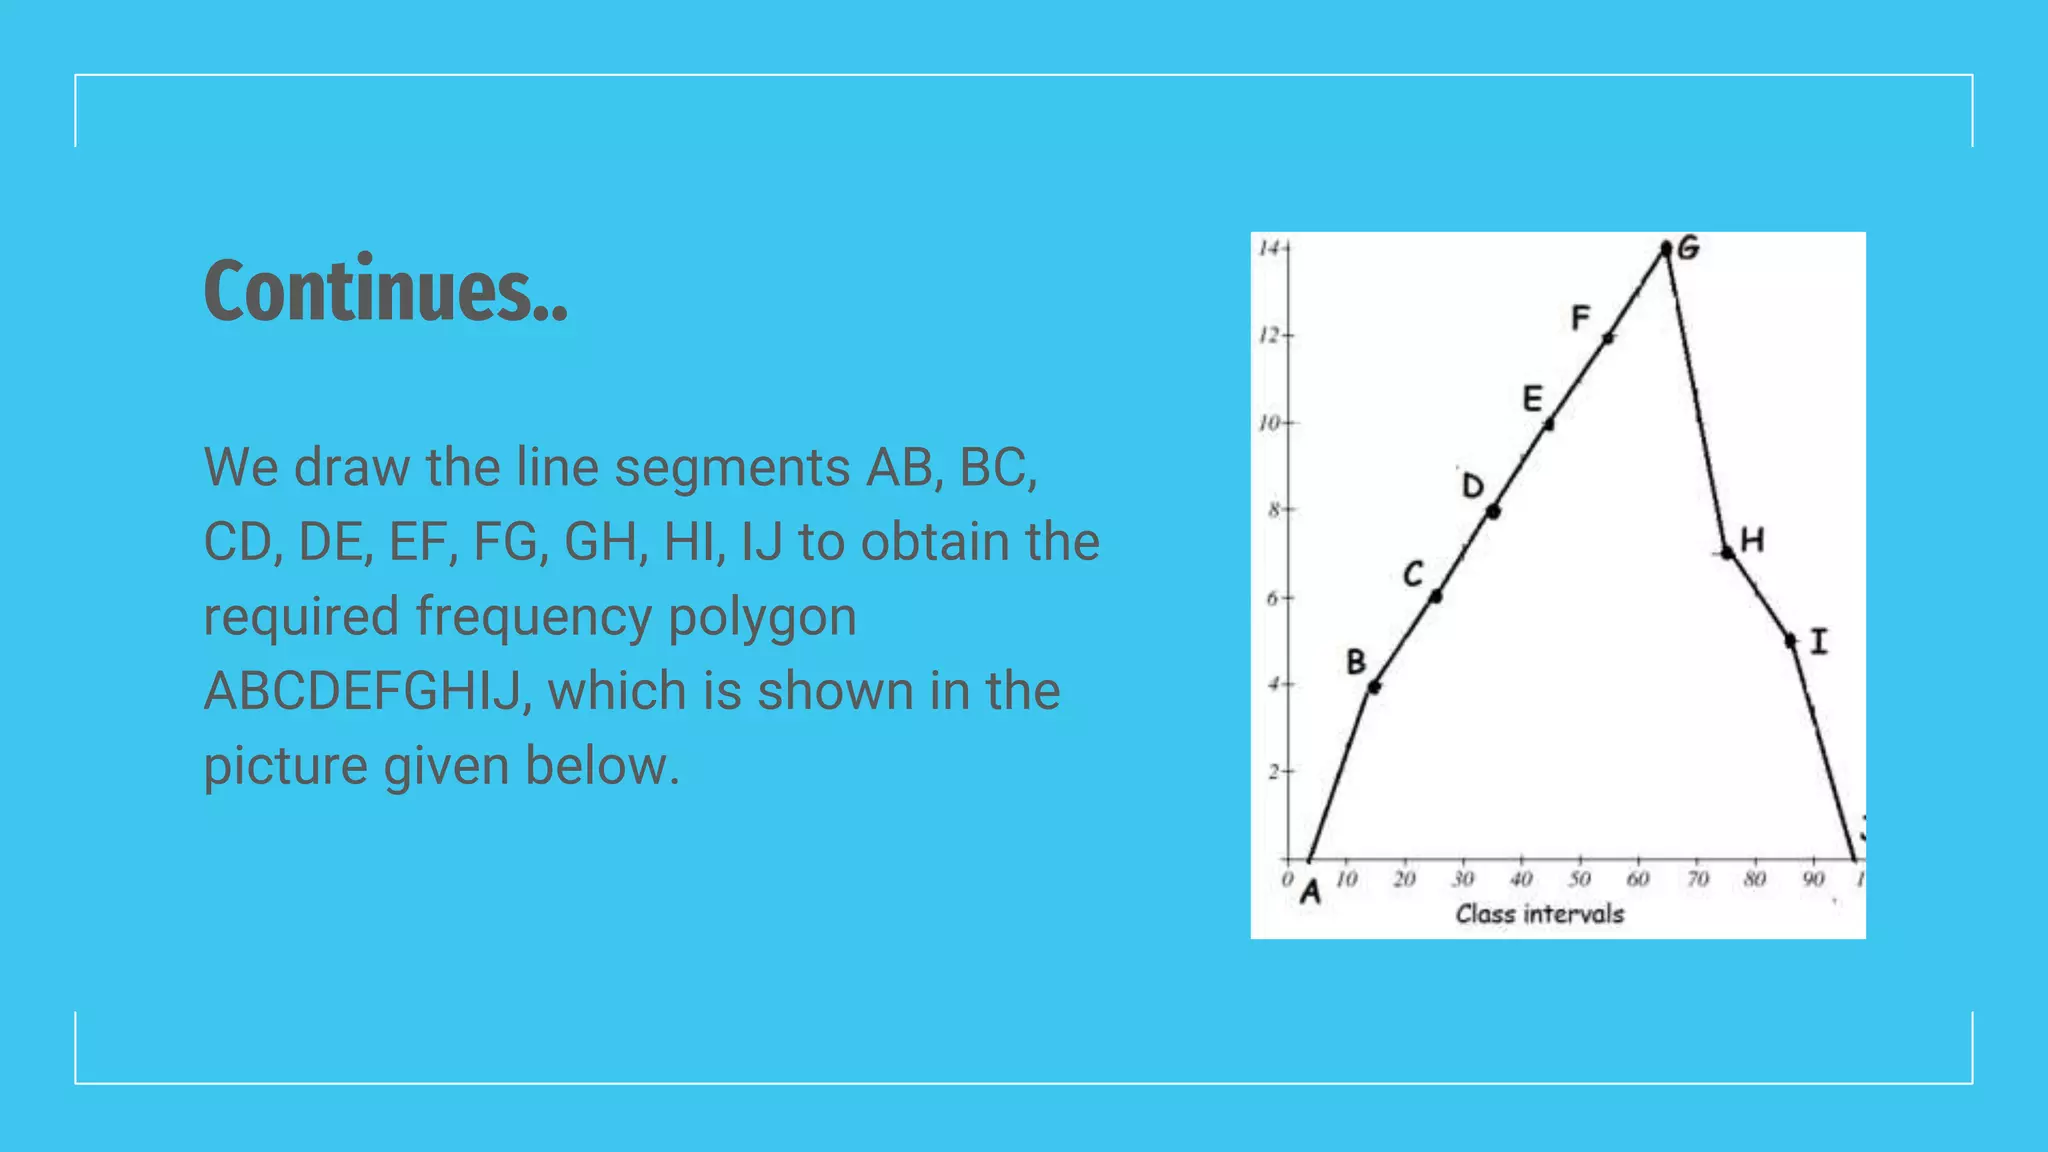
Line frequency
Graph
❏ Used for depicting Discrete
series.
❏ In the construction of line
frequency graph, the values of
the variables are measured on
the x-axis.
❏ Whereas frequency is denoted
on y-axis.
Example 1 :
Prepare Line Frequency Graph from the following data:
FREQUENCY POLYGON
10
20
30
40
50
60
70
80
90
100
SU M TU W
T
H
F SA
40%
What is a
polygon ?
Frequency polygon
10
20
30
40
50
60
70
80
90
100
S
U
M
T
U
W
T
H
F
S
A
➢ A frequency polygon is another
method of representing a frequency
distribution on a graph.
➢ It is an alternative to histogram and is
also derived from histogram itself.
➢ It is more suitable as compared to
histogram, when two or more
frequency distributions are to be
compared.
➢ Frequency polygon can be
constructed either for discrete series
or for continuous series.
Frequency polygon in discrete series :
In case of discrete frequency distribution, the following
steps are followed :
● Take the values of variable on X - axis and the
corresponding frequencies on the y- axis.
● Plot the various frequencies and the points are joined by
a straight line.
● The figure so obtained is extended to base (base line)at
both ends by joining the extreme points (first and last
points)to the two hypothetical values of the
variable(before the first value of the variable and after
the last value of the variable), assumed to have zero
frequencies.
EXAMPLES OF DISCRETE FREQUENCY POLYGON
The following data shows no. of rooms in 64 houses of a colony. Construct a
frequency polygon.
No. of rooms No. of houses
1 10
2 15
3 20
4 10
5 5
Frequency polygon in continuous series
In case of a continuous frequency distribution, they are two ways of making
frequency polygon :
● With the help of histogram
● Without the help of histogram
With the help of
histogram
The frequency polygon through histogram requires the following steps:
● Draw the histogram of the frequency distribution
● Join the midpoints of the tops of the adjacent rectangles of the graph
by straight lines.
● Close the figure by extending the base lines.
With the help of histogram….
Height (in cm) Number of
students(Frequency)
140-150 74
150-160 163
160-170 135
170-180 28
Total 400
Without the help of
histogram…
The frequency polygon without
histogram requires the following steps:
● Take mid-points of class-intervals
on the X-axis and frequency on the
Y-axis.
● Plot them and join by a straight
line.
● Close the figure by extending the
base lines.
Frequency
distribution
without
histogram :
The following steps will be useful to draw frequency polygon
without histogram :
● Obtain the frequency distribution and compute the mid
points of each class interval.
● Represent the mid points along the X-axis and the
frequencies along the Y-axis.
● Plot the points corresponding to the frequency at each
mid point.
● Join these points, by straight lines in order.
● To complete the polygon join the point at each end
immediately to the lower or higher class marks (as the
case may be at zero frequency) on the X-axis.
Frequency polygon without Histogram example:
Draw a frequency polygon for the following data without using histogram.
X axis = CI
Y axis = Frequency
Using the adjacent table, plot the
points A (5, 0), B (15, 4), C (25, 6), D
(35, 8), E (45, 10), F (55, 12), G (65, 14),
H (75, 7), I (85, 5) and J (95, 0).
Continues..
We draw the line segments AB, BC,
CD, DE, EF, FG, GH, HI, IJ to obtain the
required frequency polygon
ABCDEFGHIJ, which is shown in the
picture given below.
Difference
between
Frequency polygon
and histogram :
Don’t worry
nothing more !
Presented by :
~ Amrutha

Frequency polygons and line graphs

  • 3.
    Line frequency Graph ❏ Usedfor depicting Discrete series. ❏ In the construction of line frequency graph, the values of the variables are measured on the x-axis. ❏ Whereas frequency is denoted on y-axis.
  • 4.
    Example 1 : PrepareLine Frequency Graph from the following data:
  • 5.
    FREQUENCY POLYGON 10 20 30 40 50 60 70 80 90 100 SU MTU W T H F SA 40% What is a polygon ?
  • 6.
    Frequency polygon 10 20 30 40 50 60 70 80 90 100 S U M T U W T H F S A ➢ Afrequency polygon is another method of representing a frequency distribution on a graph. ➢ It is an alternative to histogram and is also derived from histogram itself. ➢ It is more suitable as compared to histogram, when two or more frequency distributions are to be compared. ➢ Frequency polygon can be constructed either for discrete series or for continuous series.
  • 8.
    Frequency polygon indiscrete series : In case of discrete frequency distribution, the following steps are followed : ● Take the values of variable on X - axis and the corresponding frequencies on the y- axis. ● Plot the various frequencies and the points are joined by a straight line. ● The figure so obtained is extended to base (base line)at both ends by joining the extreme points (first and last points)to the two hypothetical values of the variable(before the first value of the variable and after the last value of the variable), assumed to have zero frequencies.
  • 9.
    EXAMPLES OF DISCRETEFREQUENCY POLYGON The following data shows no. of rooms in 64 houses of a colony. Construct a frequency polygon. No. of rooms No. of houses 1 10 2 15 3 20 4 10 5 5
  • 10.
    Frequency polygon incontinuous series In case of a continuous frequency distribution, they are two ways of making frequency polygon : ● With the help of histogram ● Without the help of histogram
  • 11.
    With the helpof histogram The frequency polygon through histogram requires the following steps: ● Draw the histogram of the frequency distribution ● Join the midpoints of the tops of the adjacent rectangles of the graph by straight lines. ● Close the figure by extending the base lines.
  • 12.
    With the helpof histogram…. Height (in cm) Number of students(Frequency) 140-150 74 150-160 163 160-170 135 170-180 28 Total 400
  • 13.
    Without the helpof histogram… The frequency polygon without histogram requires the following steps: ● Take mid-points of class-intervals on the X-axis and frequency on the Y-axis. ● Plot them and join by a straight line. ● Close the figure by extending the base lines.
  • 14.
    Frequency distribution without histogram : The followingsteps will be useful to draw frequency polygon without histogram : ● Obtain the frequency distribution and compute the mid points of each class interval. ● Represent the mid points along the X-axis and the frequencies along the Y-axis. ● Plot the points corresponding to the frequency at each mid point. ● Join these points, by straight lines in order. ● To complete the polygon join the point at each end immediately to the lower or higher class marks (as the case may be at zero frequency) on the X-axis.
  • 15.
    Frequency polygon withoutHistogram example: Draw a frequency polygon for the following data without using histogram. X axis = CI Y axis = Frequency Using the adjacent table, plot the points A (5, 0), B (15, 4), C (25, 6), D (35, 8), E (45, 10), F (55, 12), G (65, 14), H (75, 7), I (85, 5) and J (95, 0).
  • 16.
    Continues.. We draw theline segments AB, BC, CD, DE, EF, FG, GH, HI, IJ to obtain the required frequency polygon ABCDEFGHIJ, which is shown in the picture given below.
  • 17.
  • 18.
    Don’t worry nothing more! Presented by : ~ Amrutha