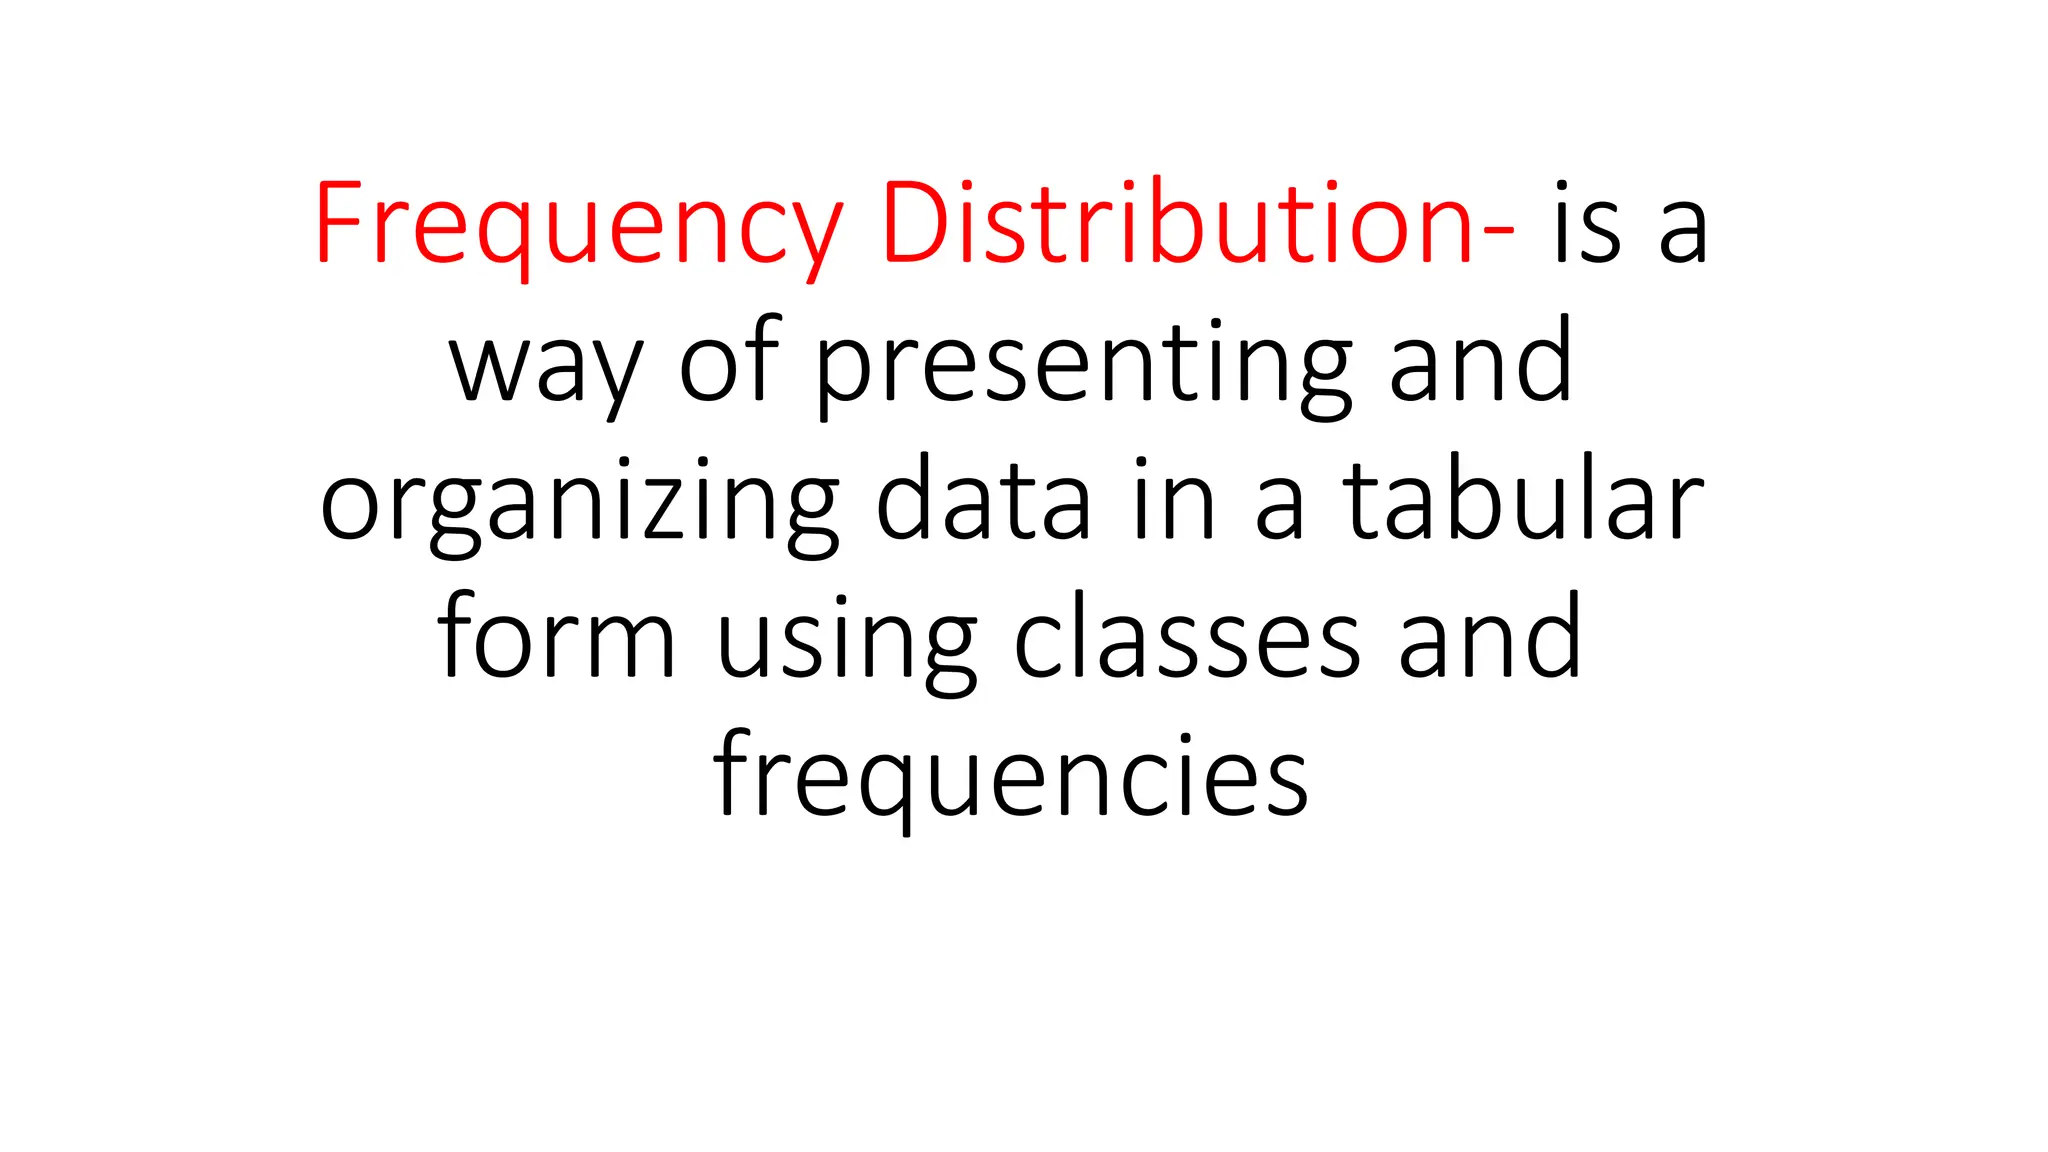
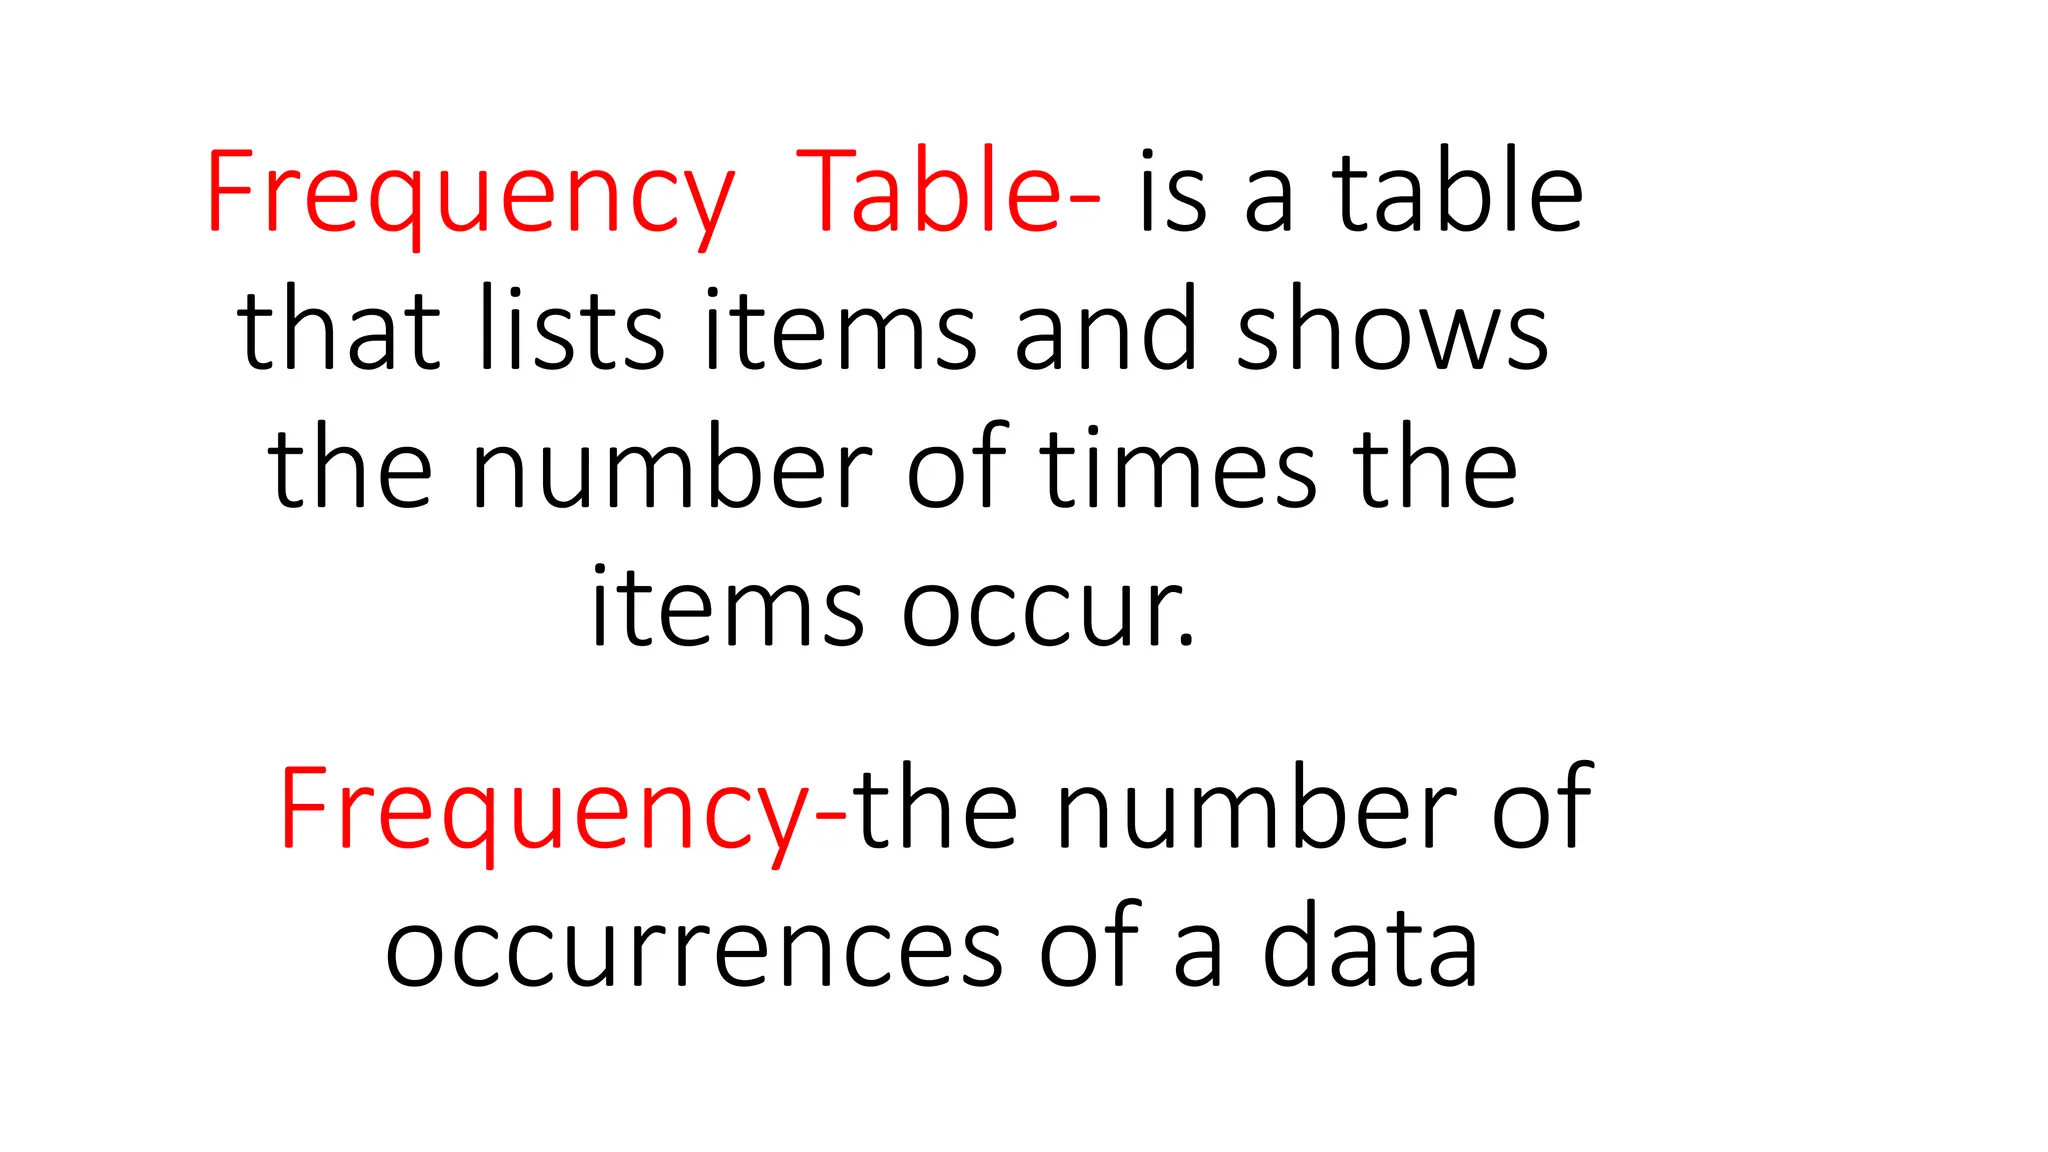
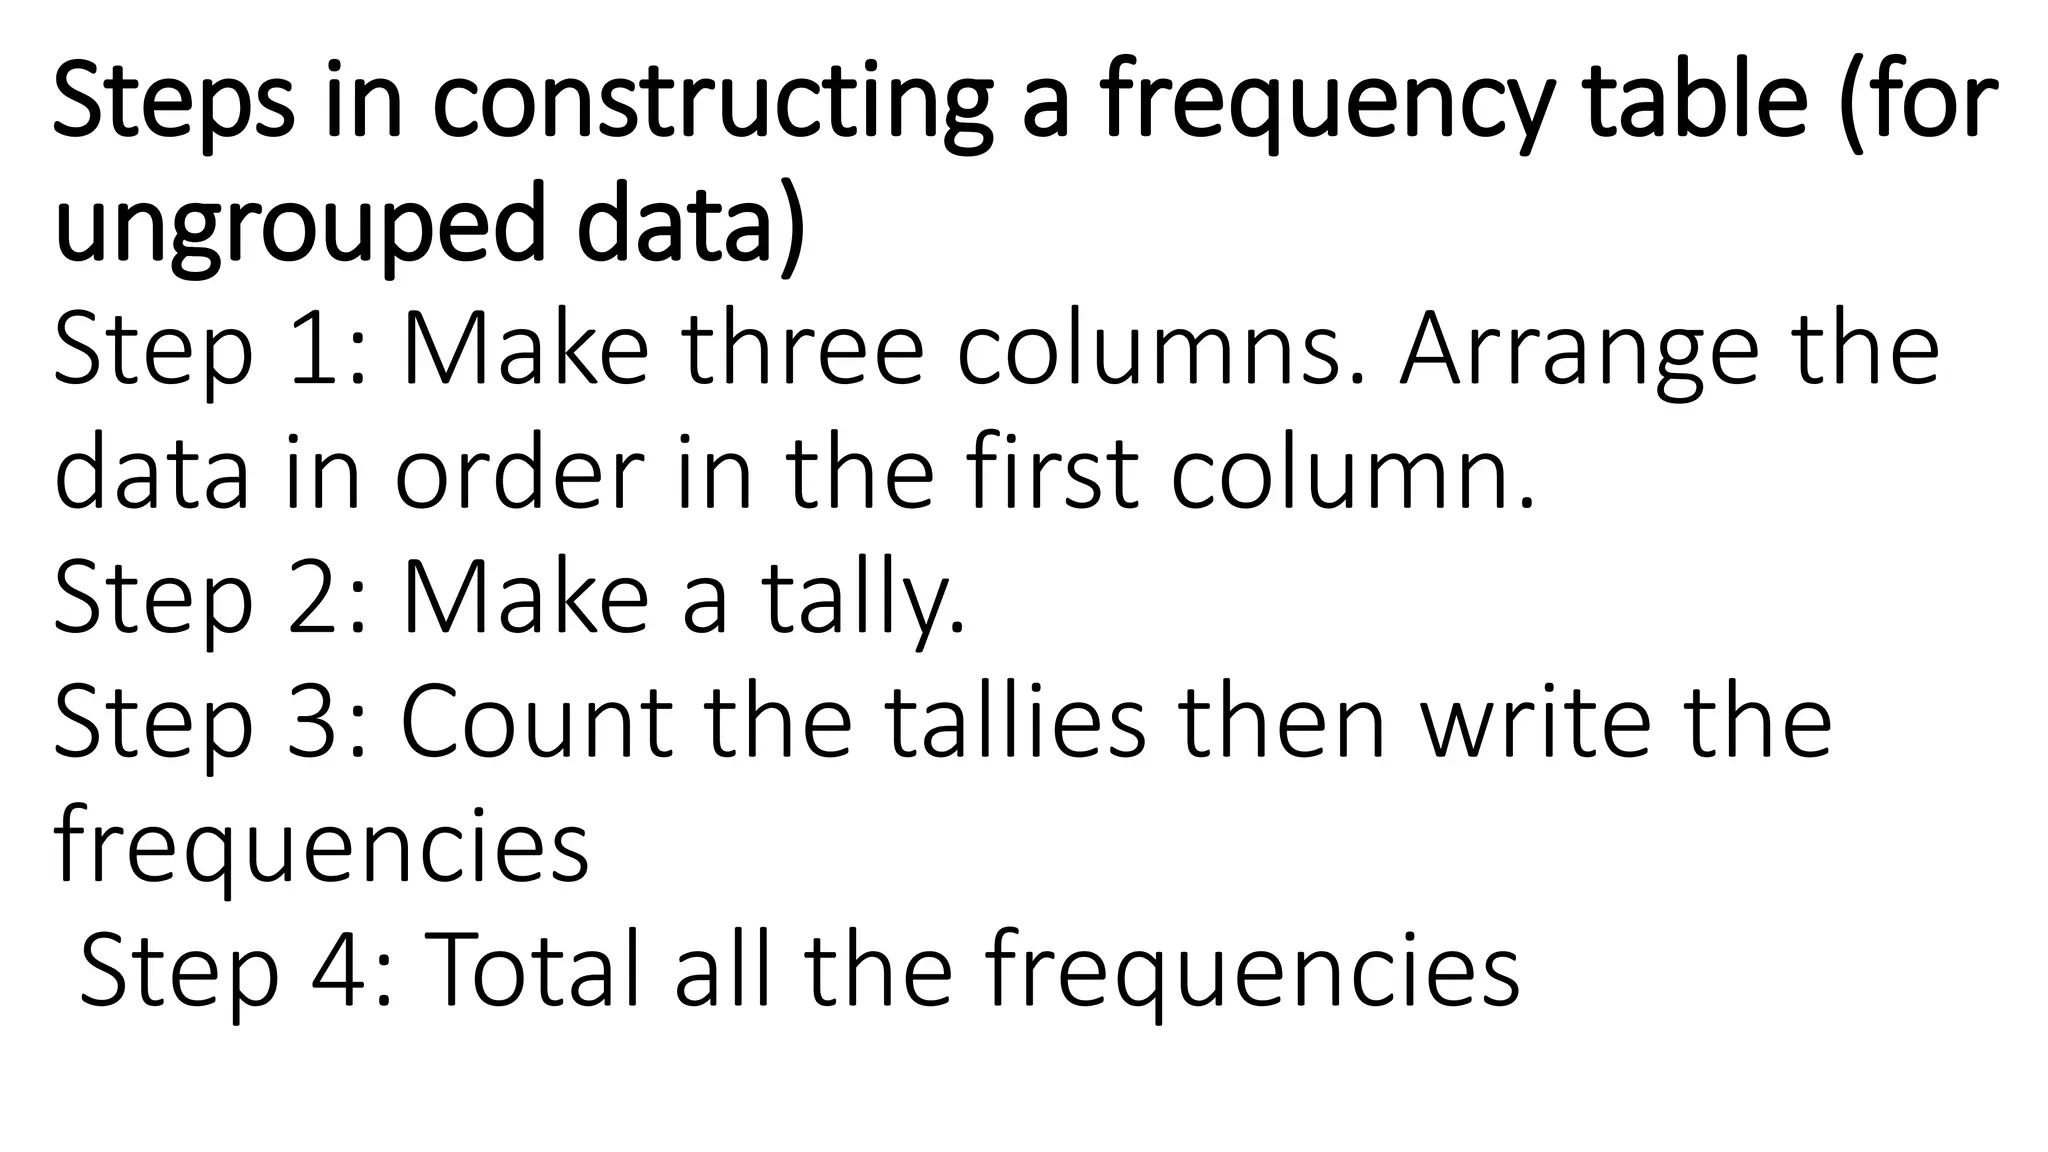
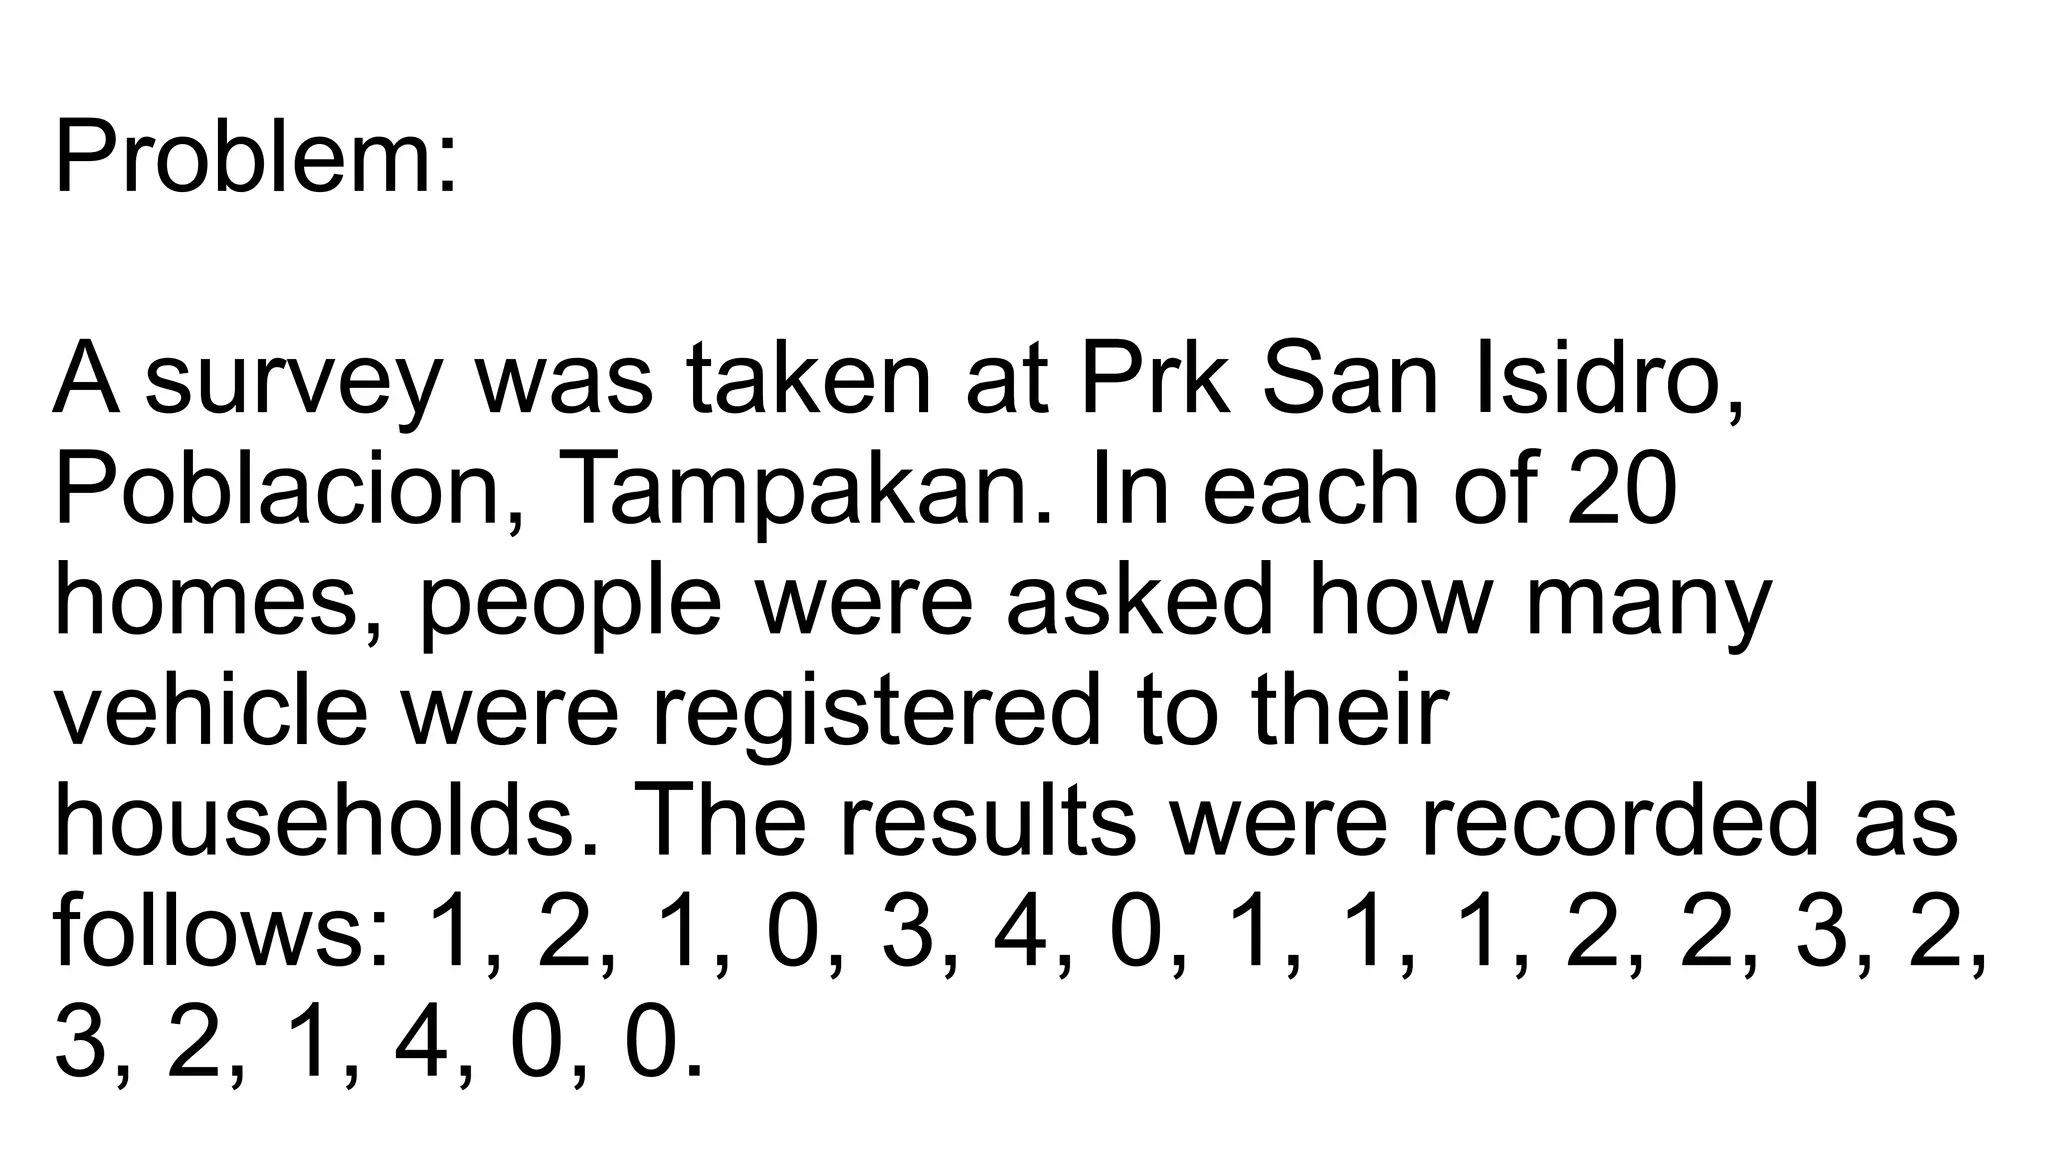
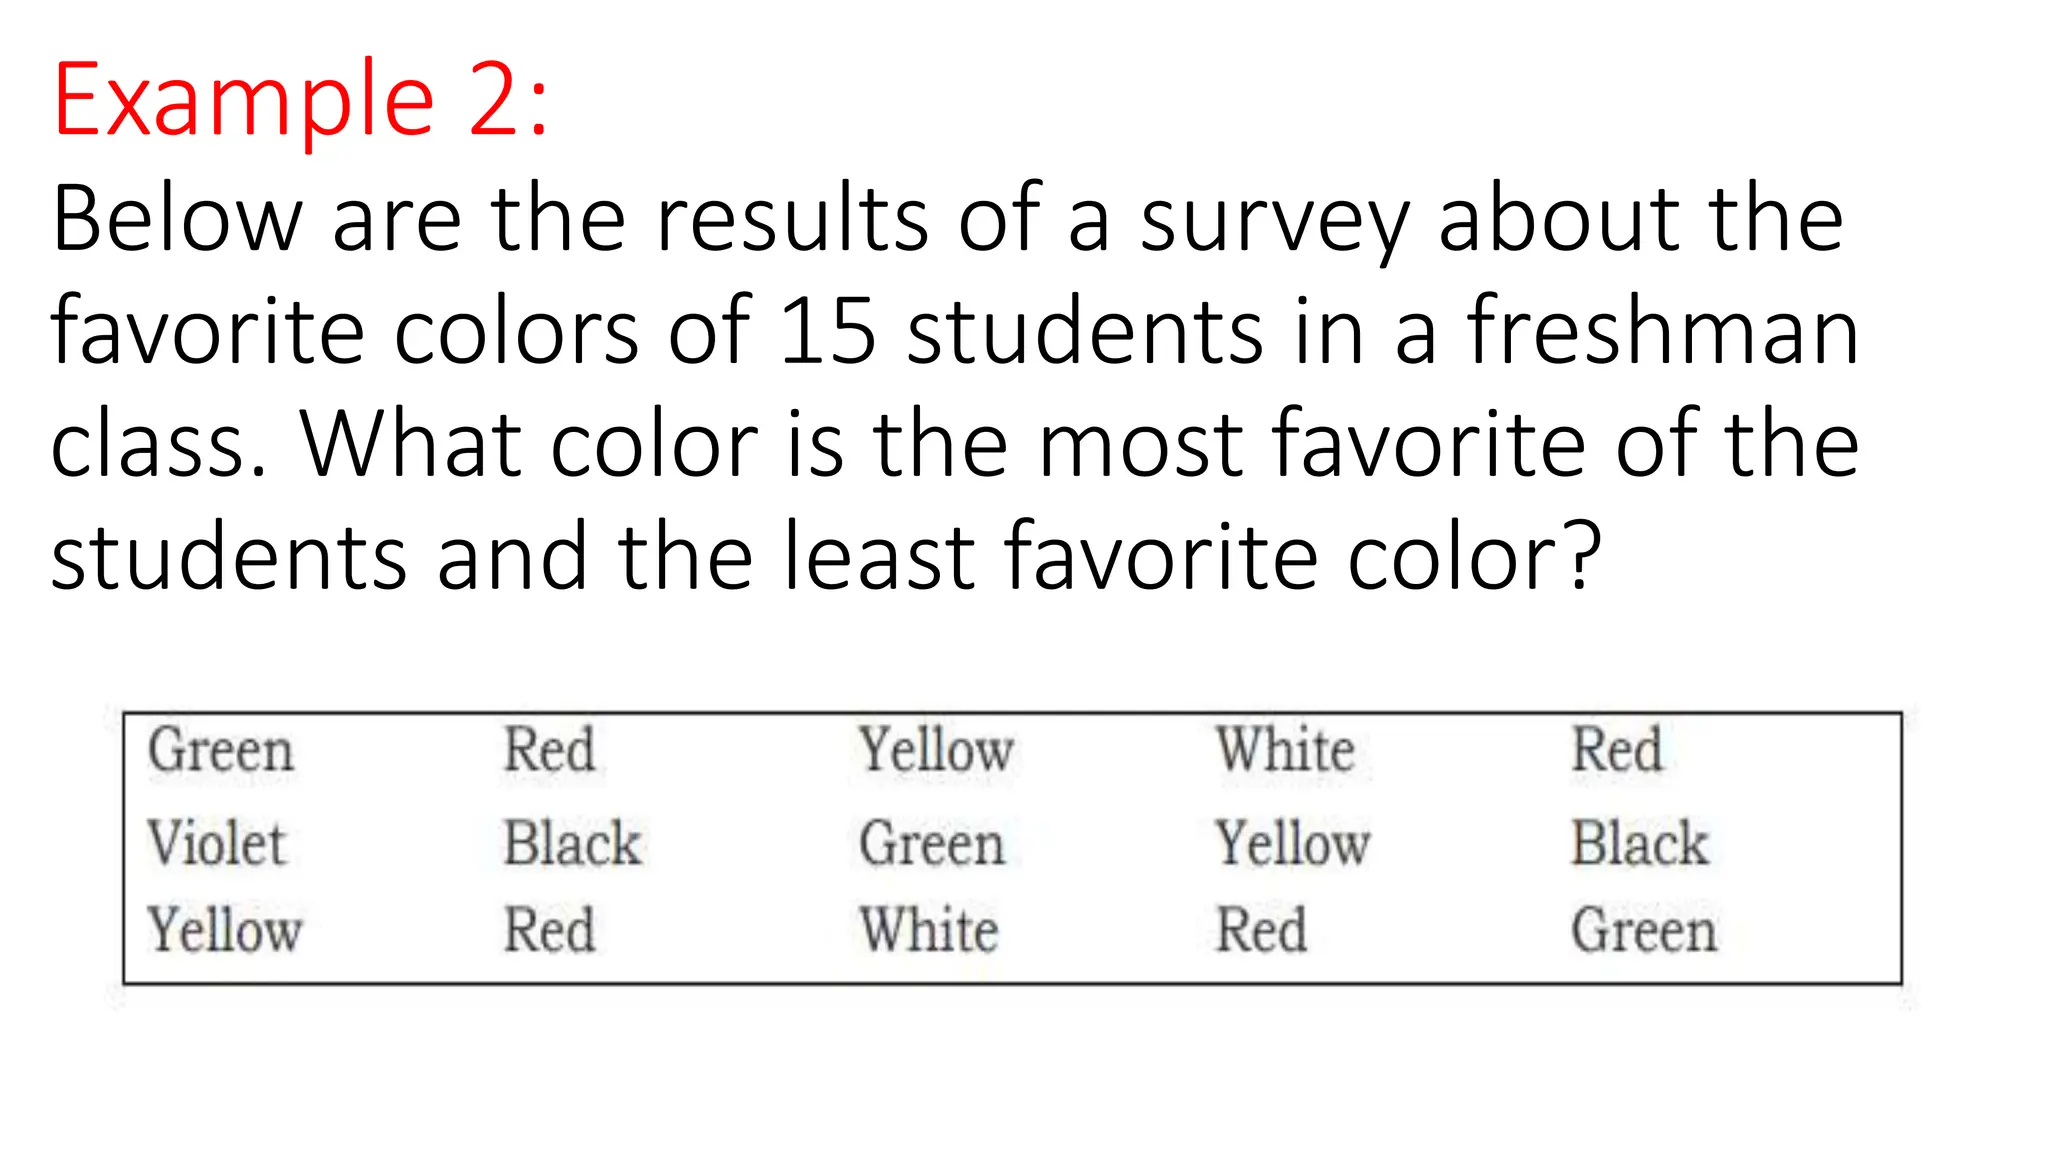
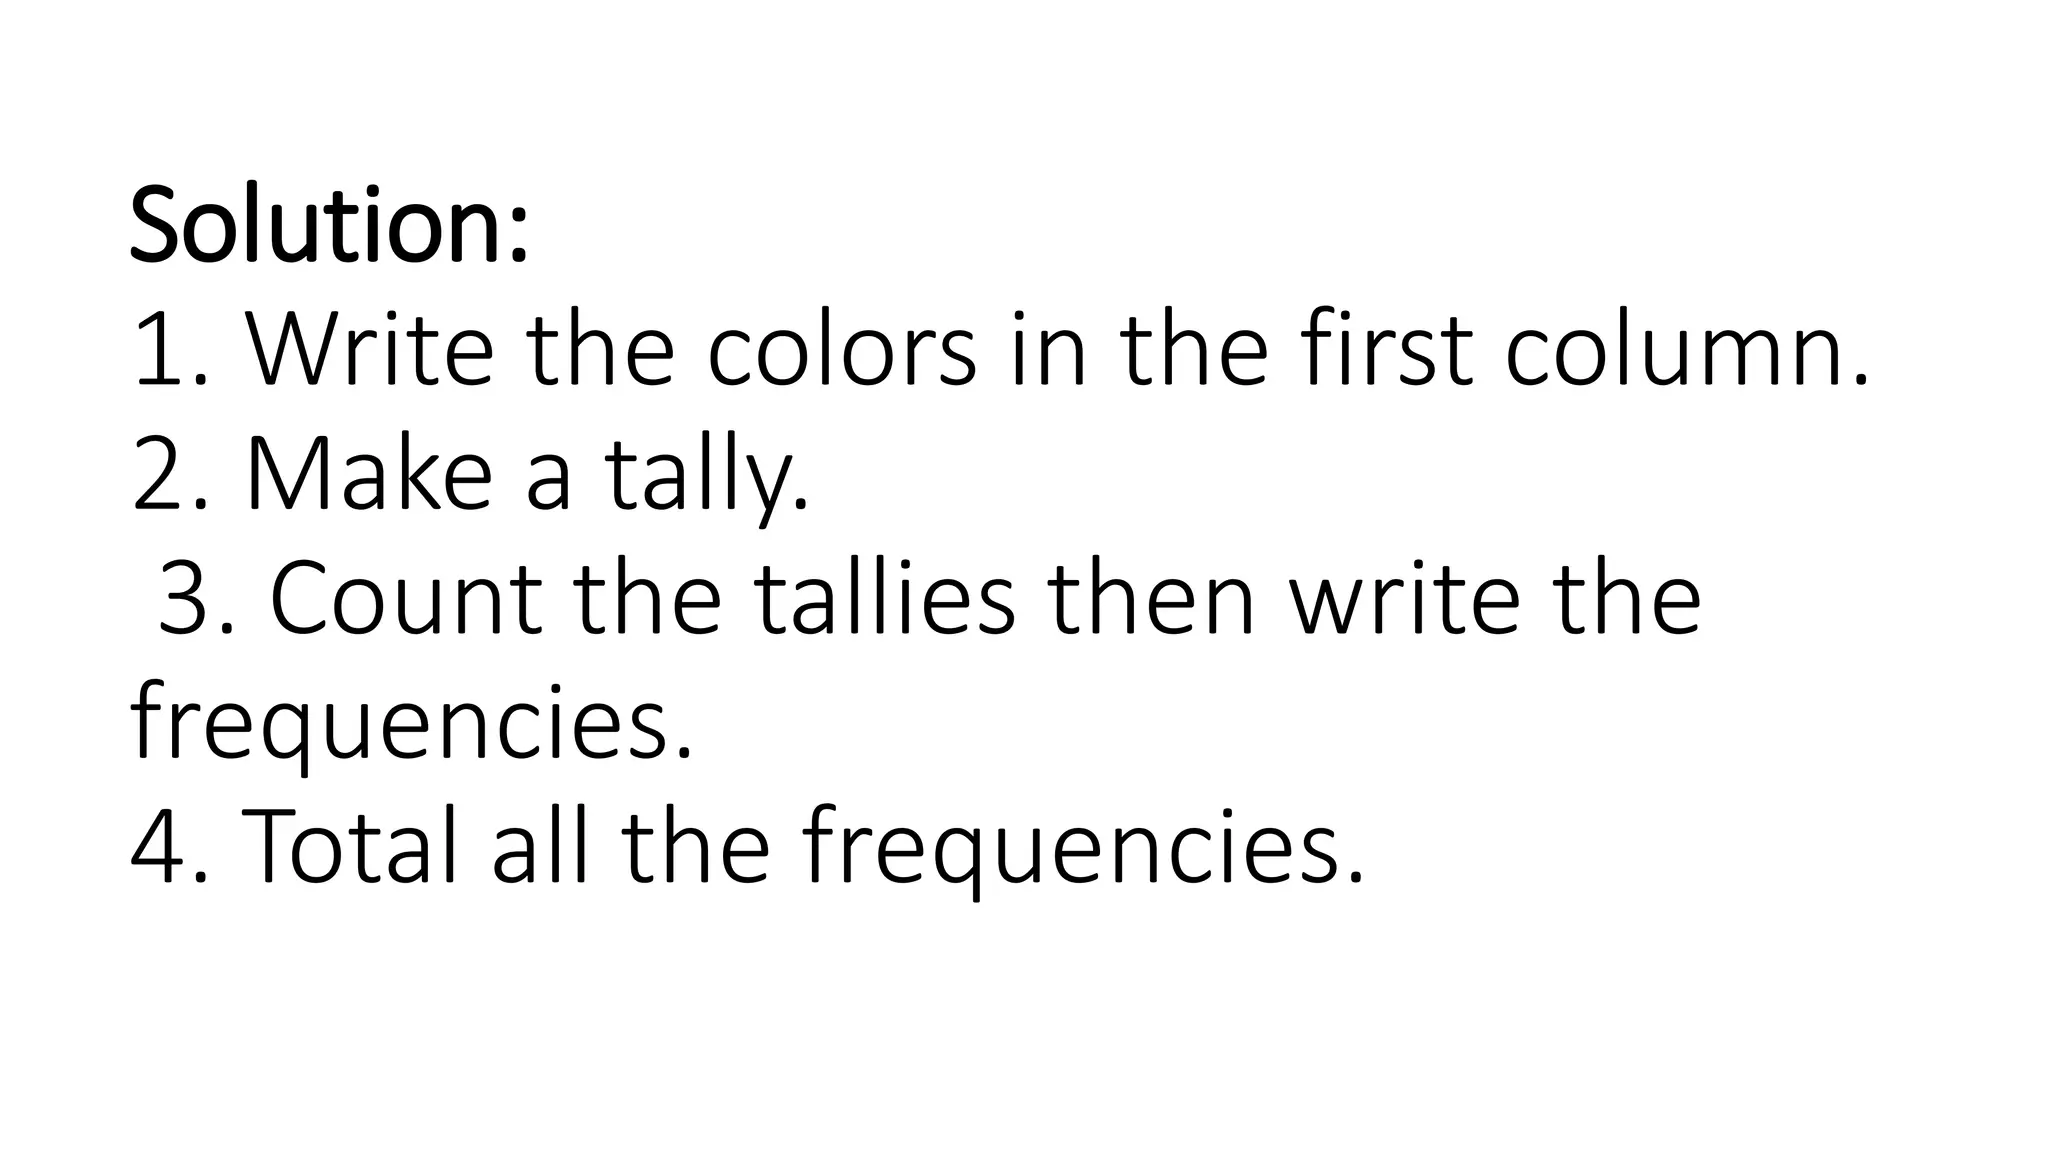
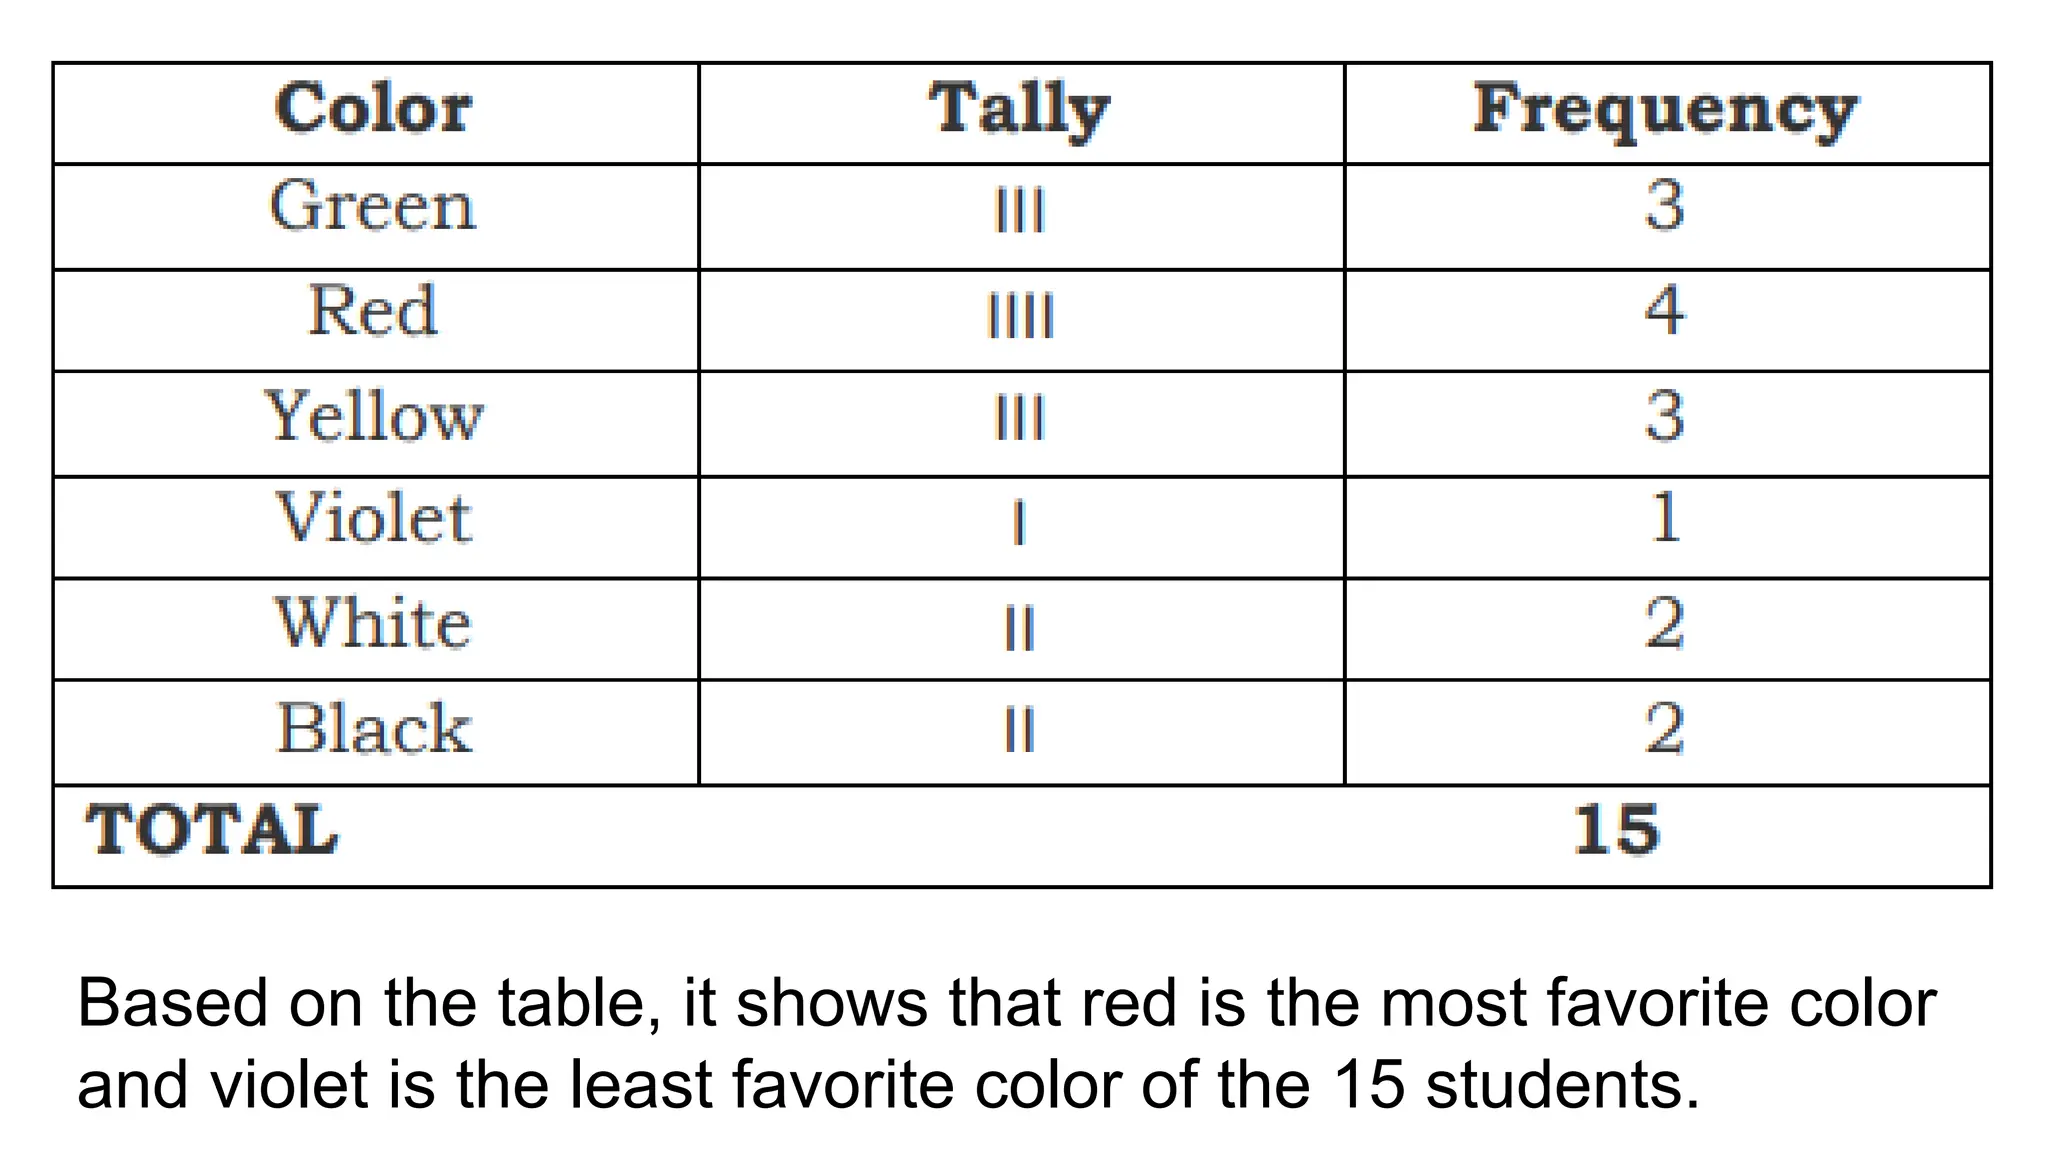
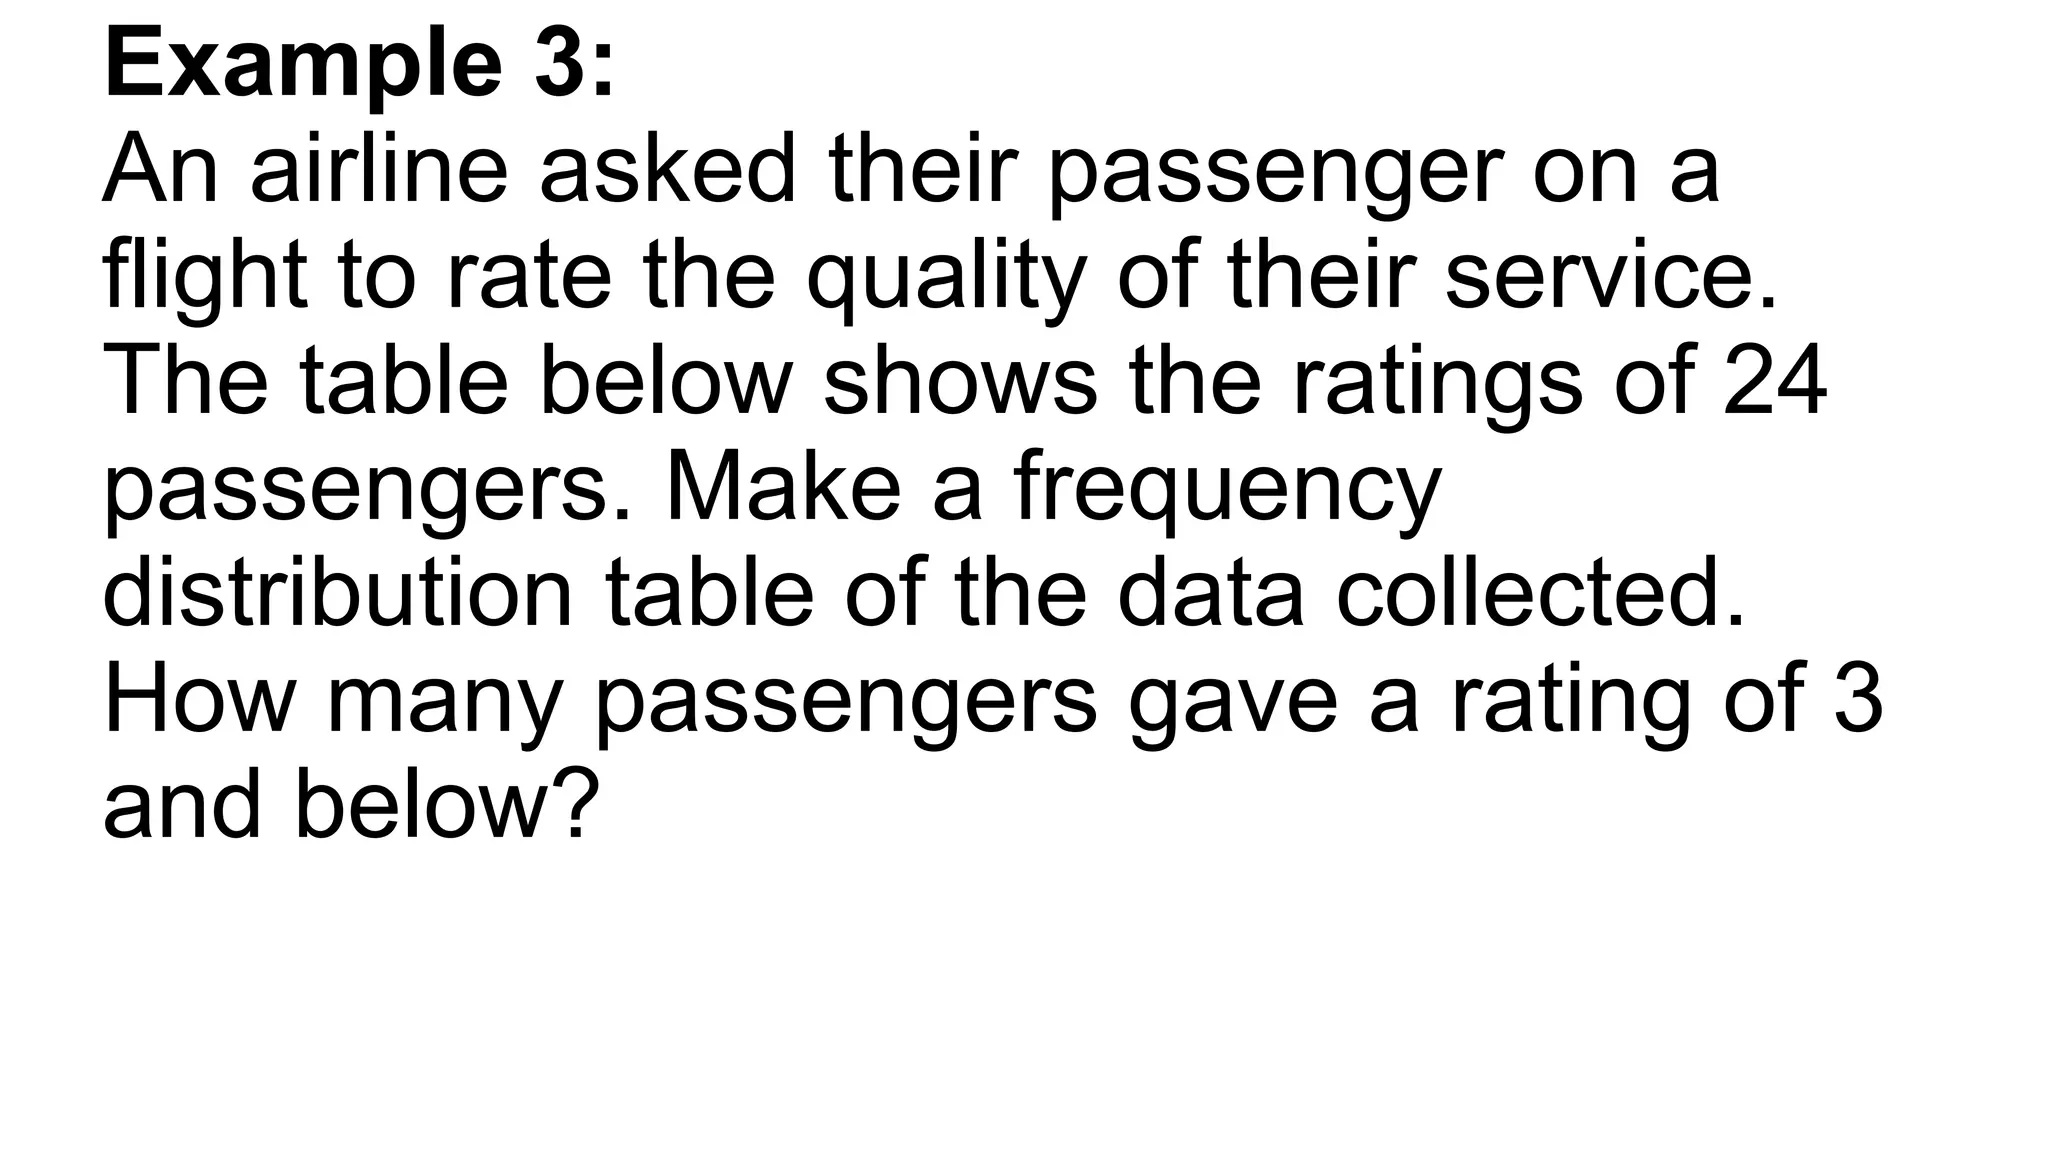
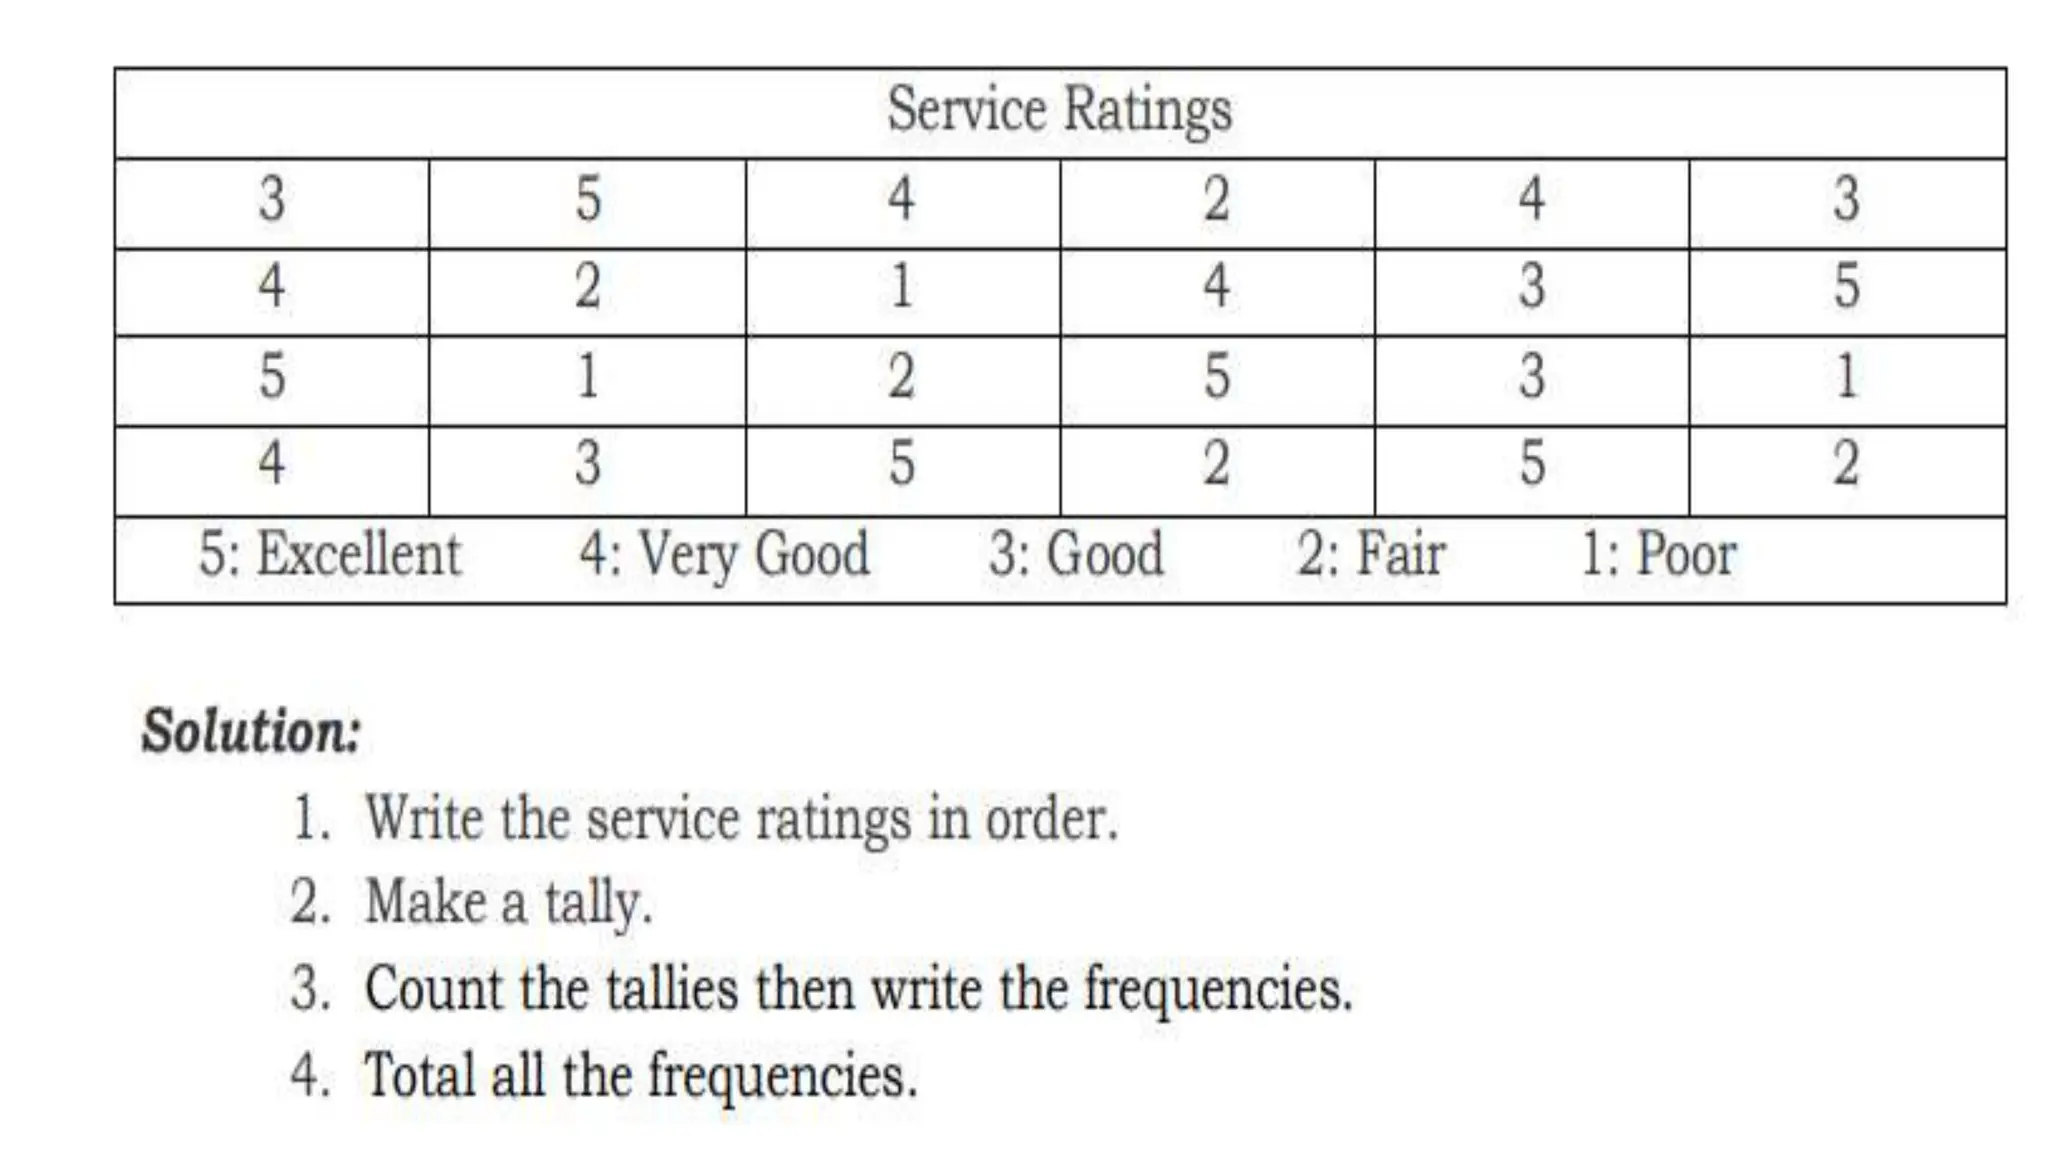
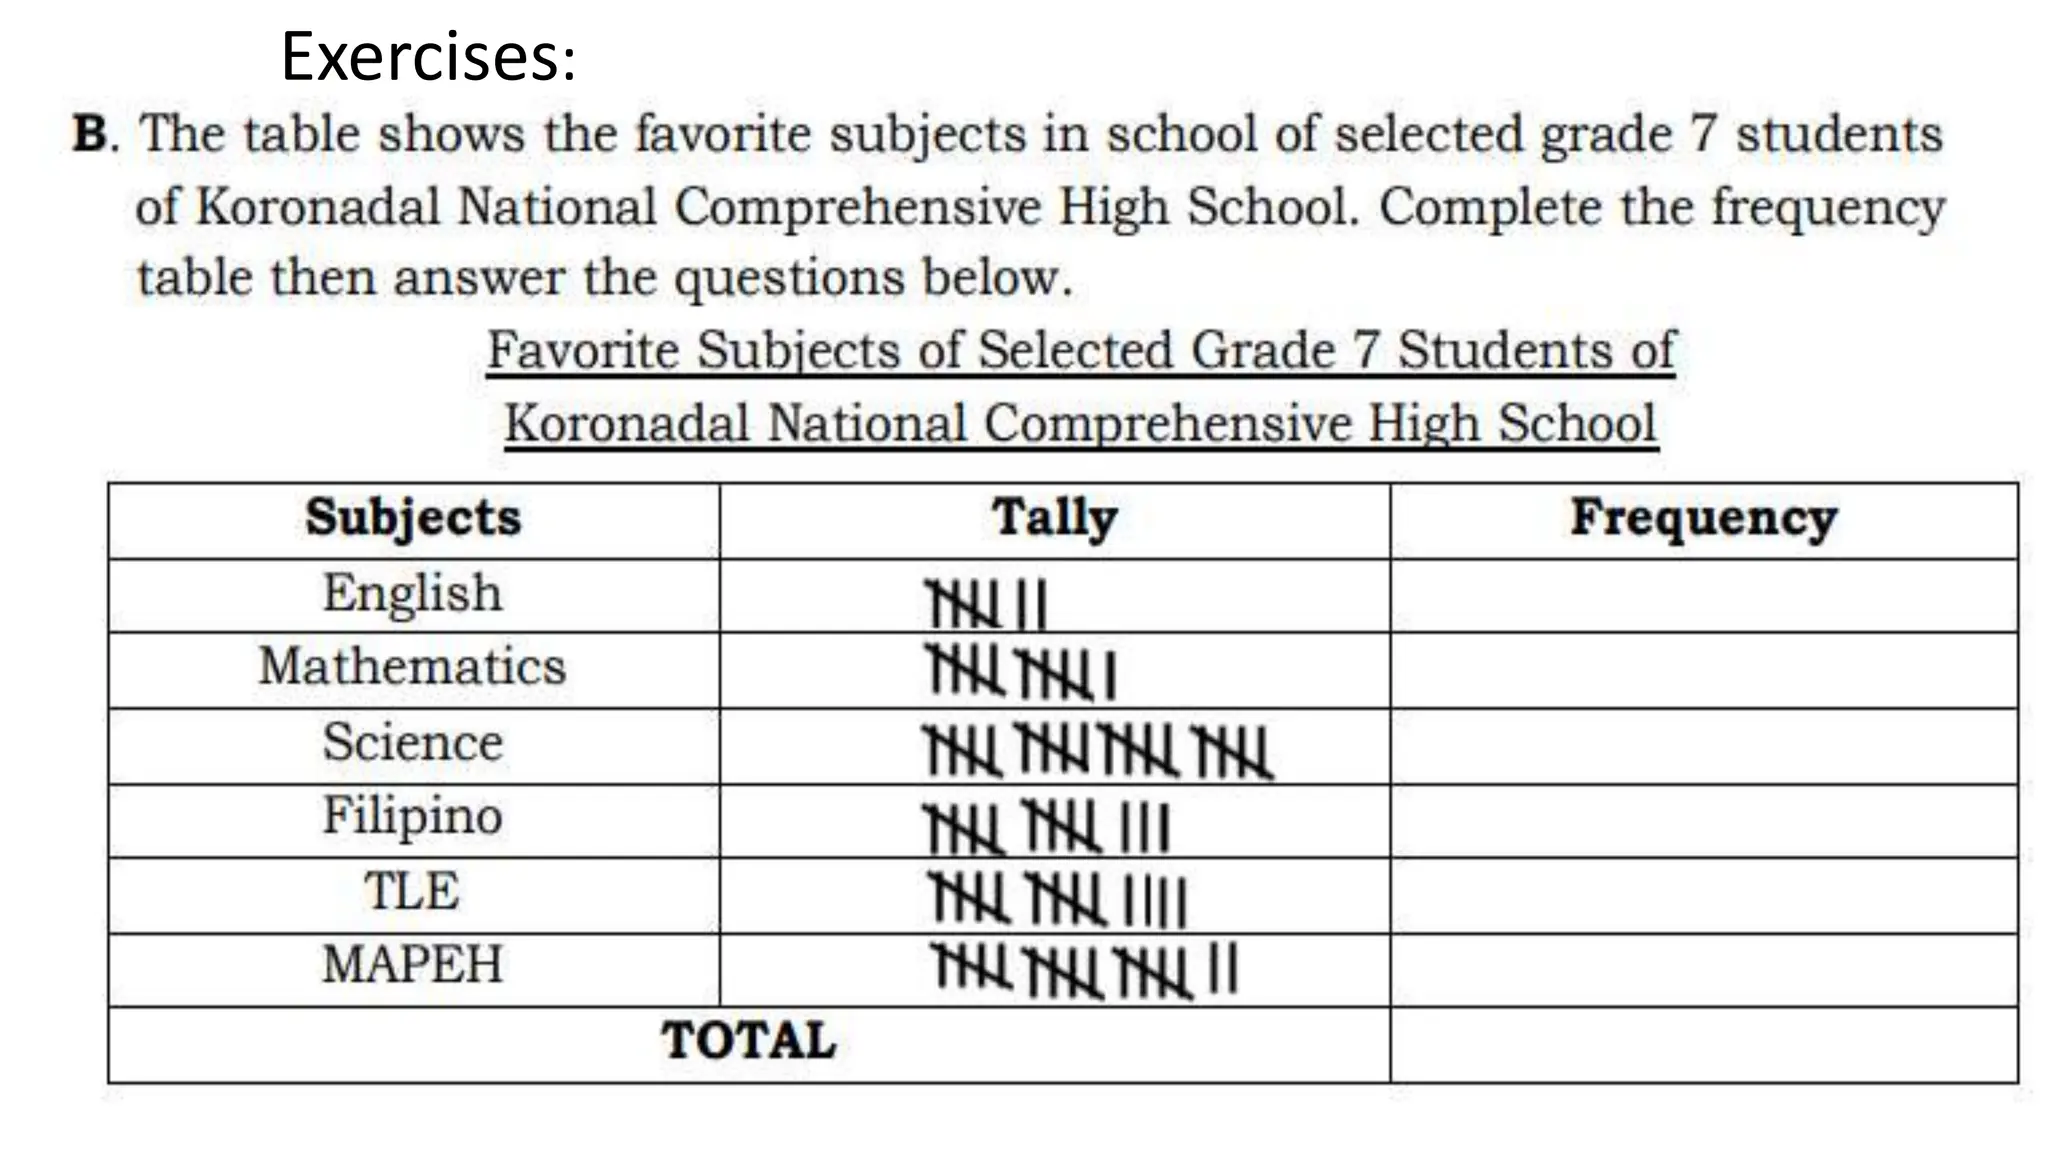
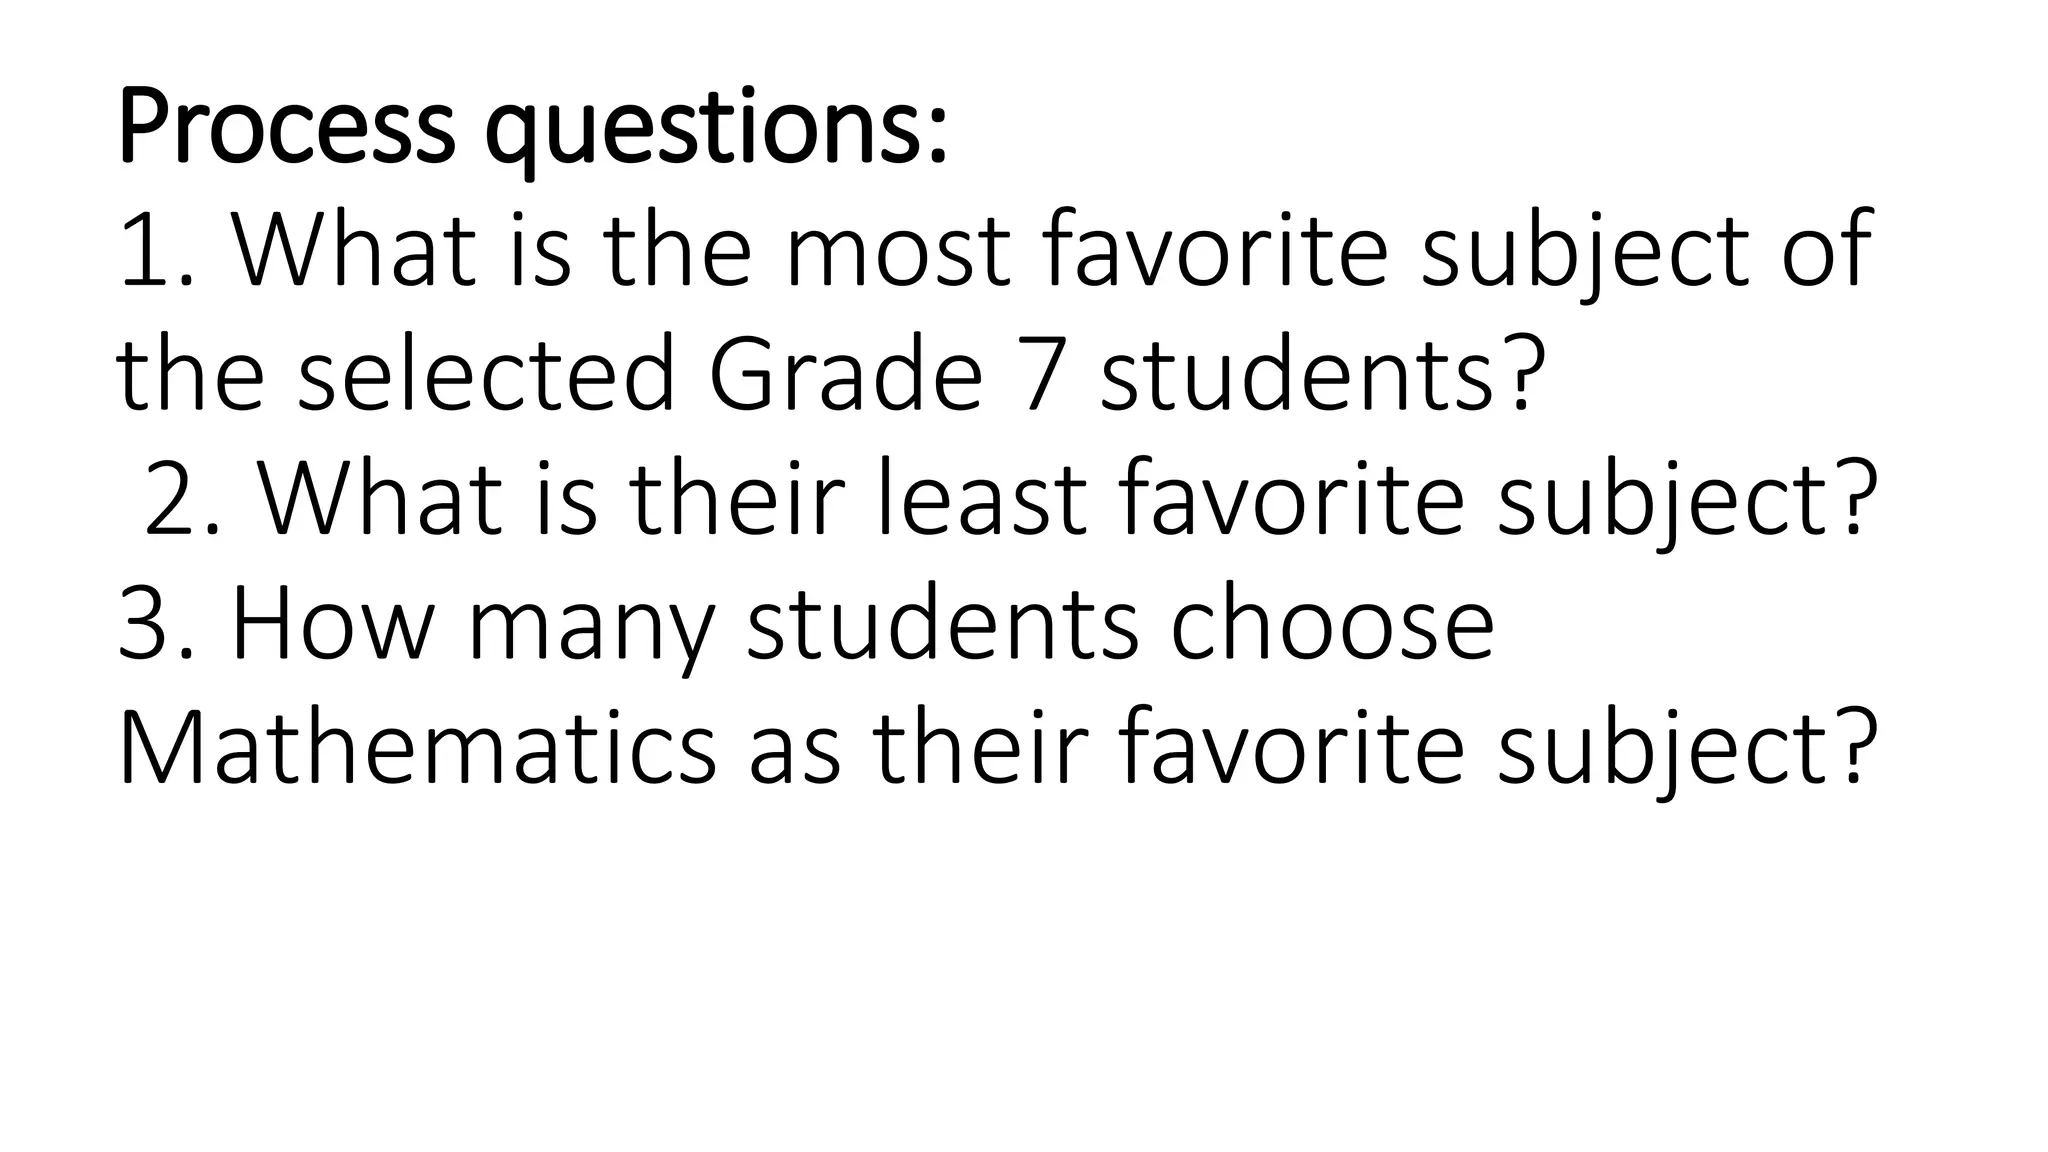
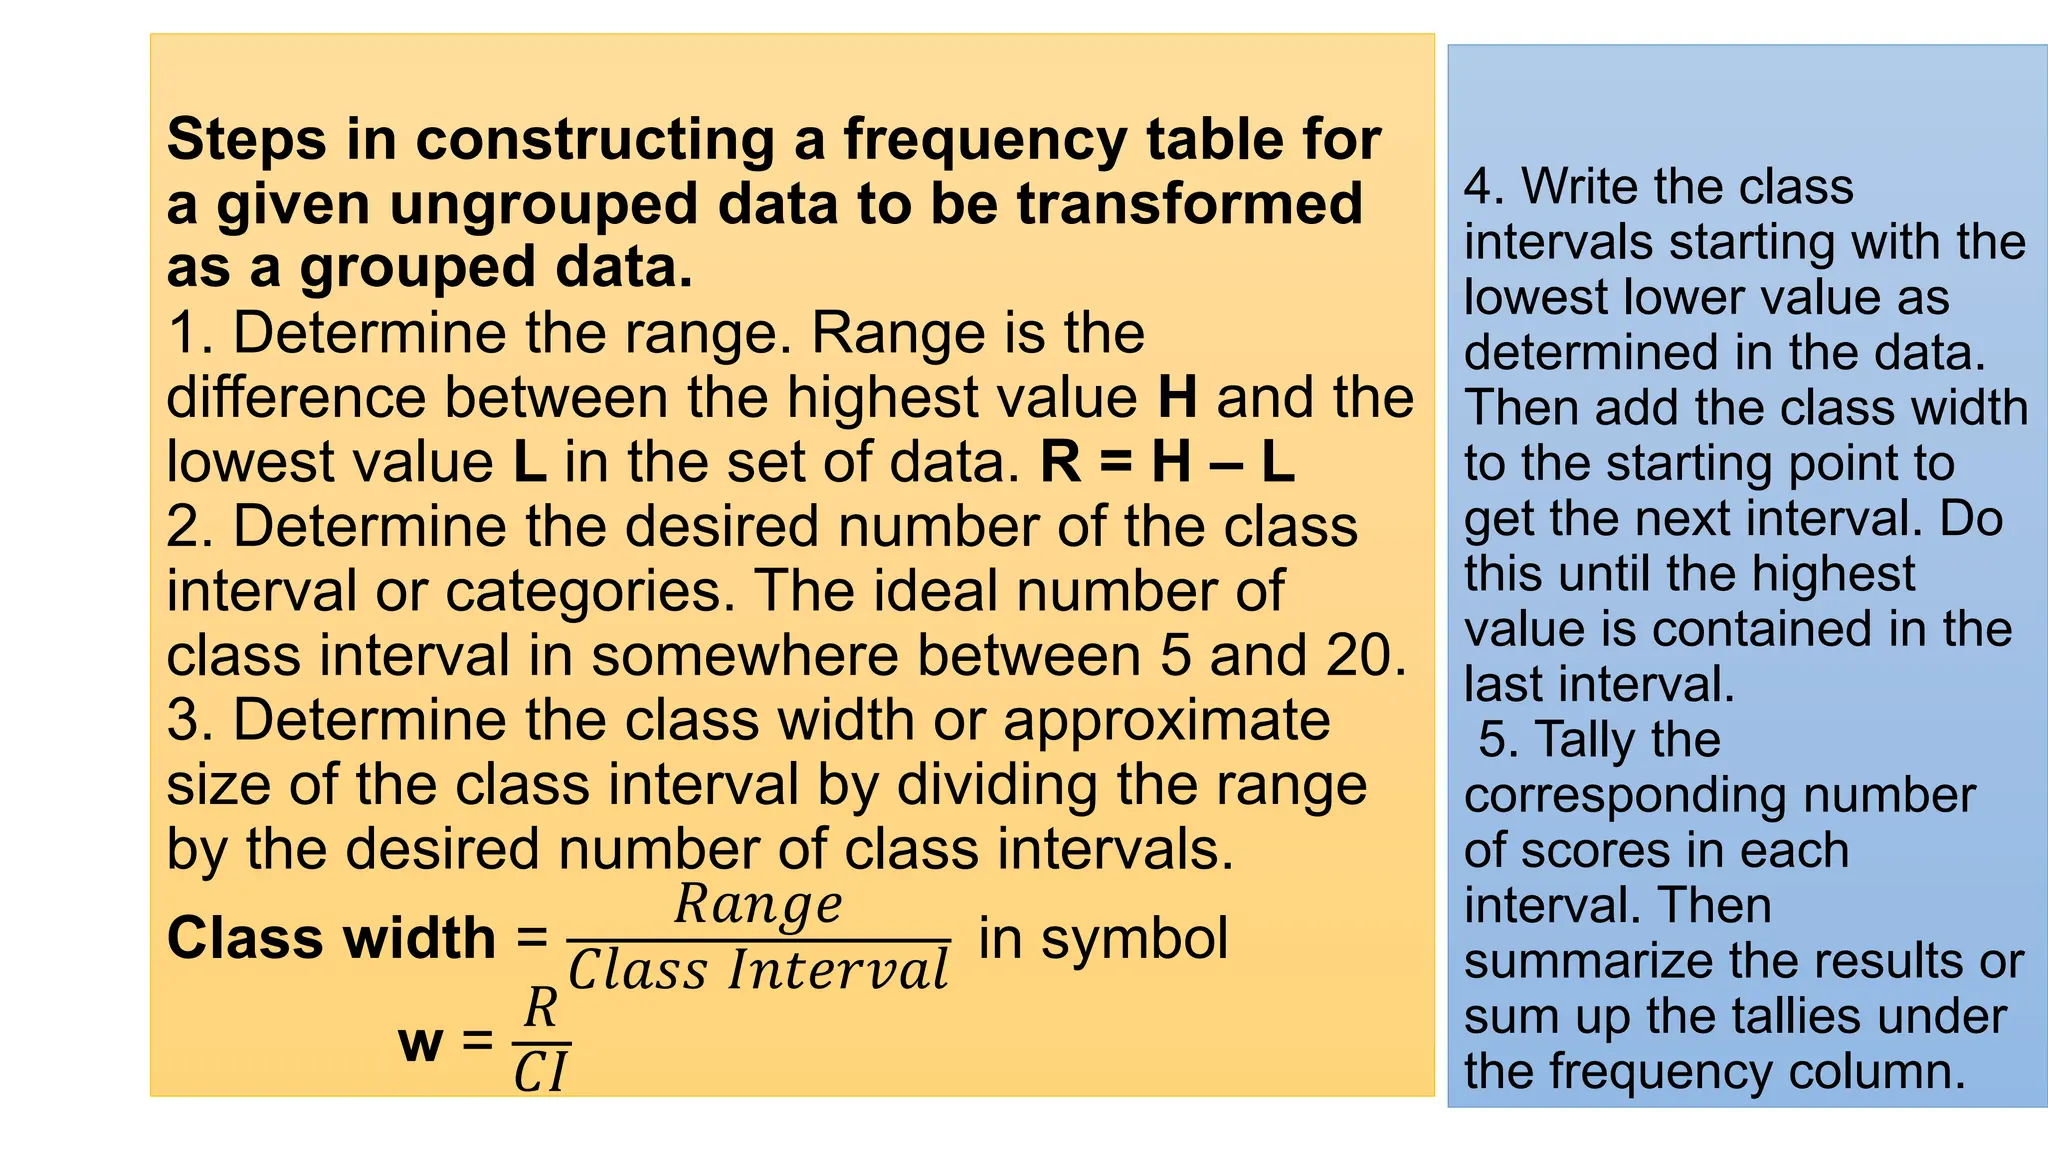
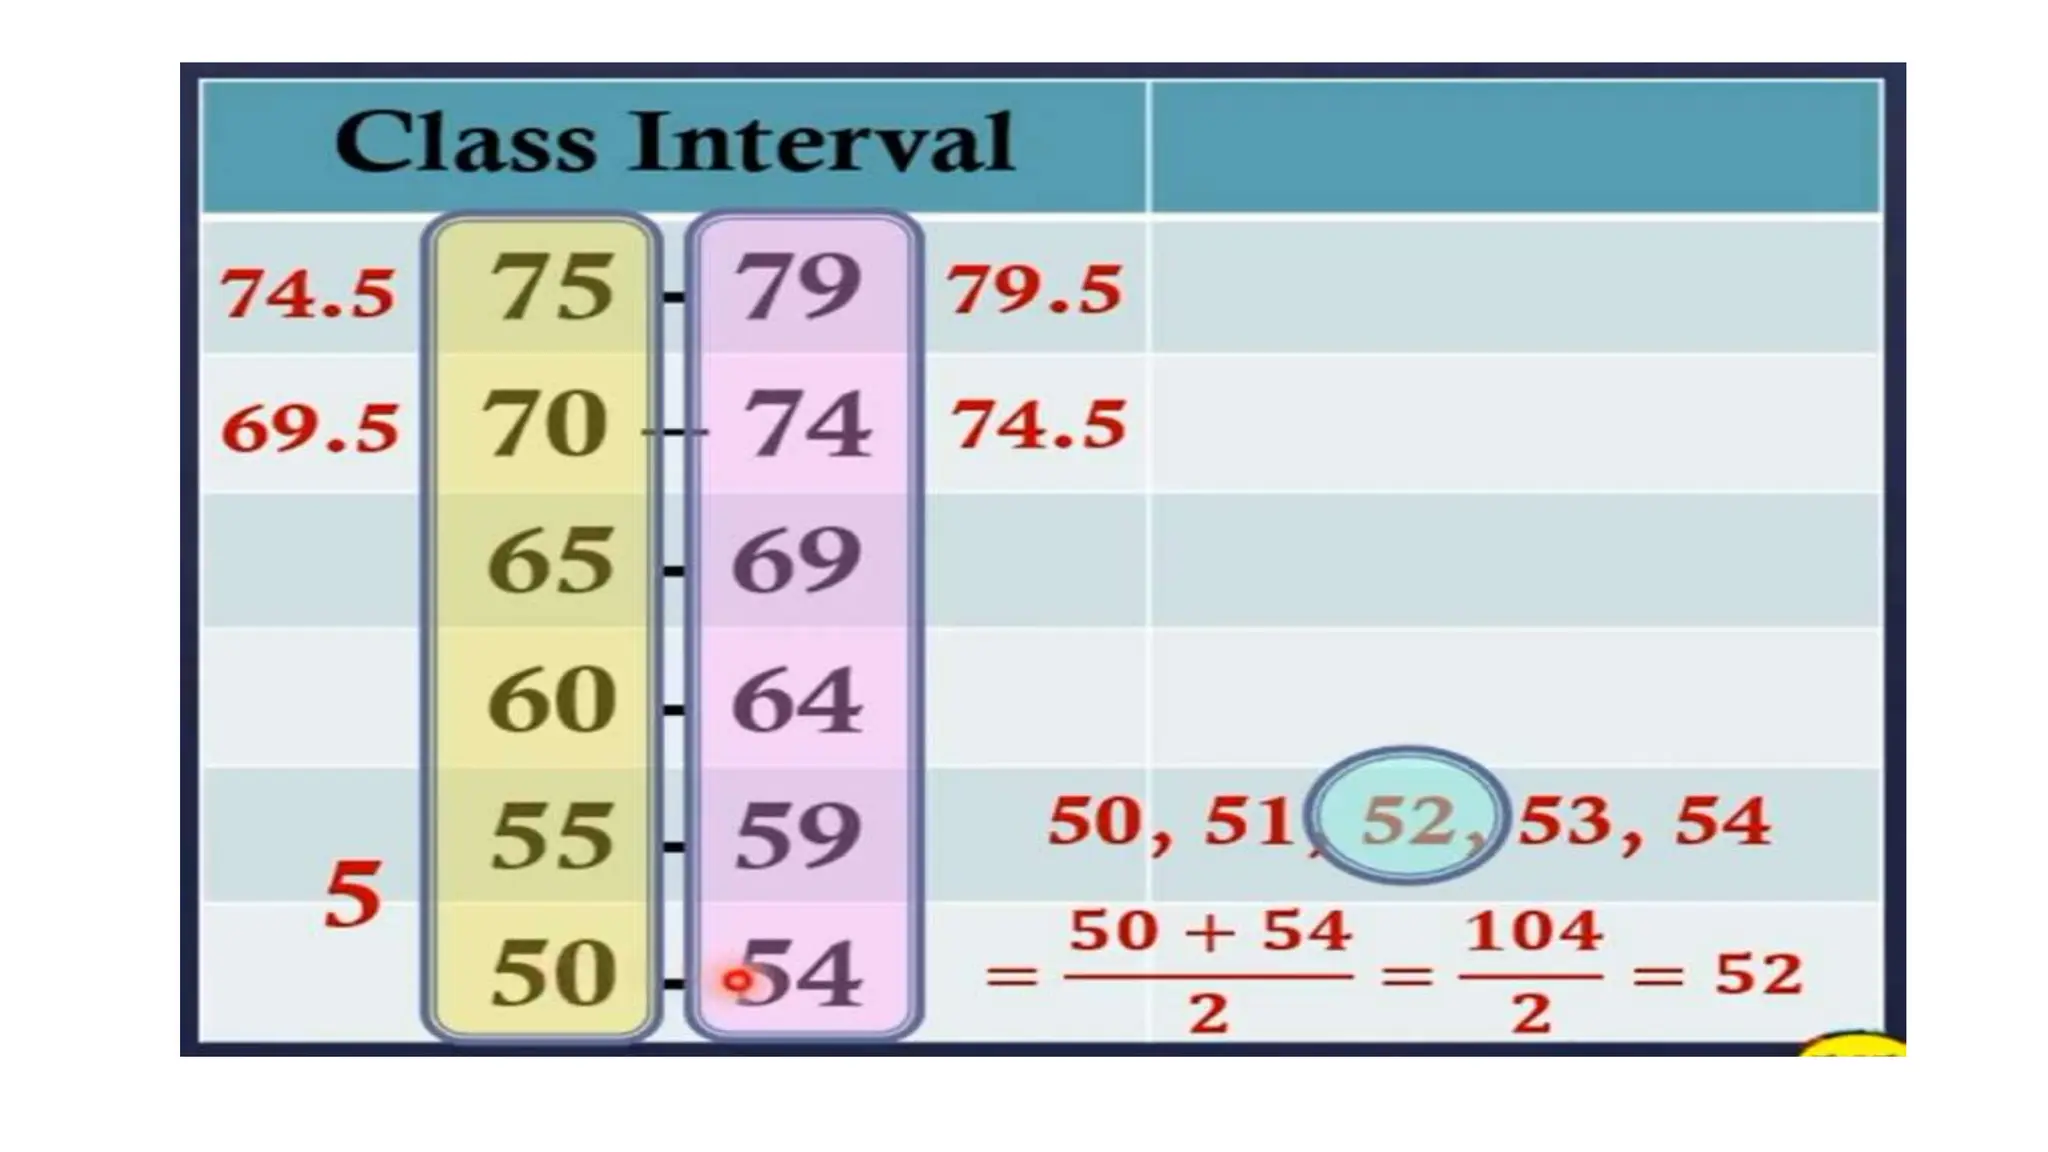
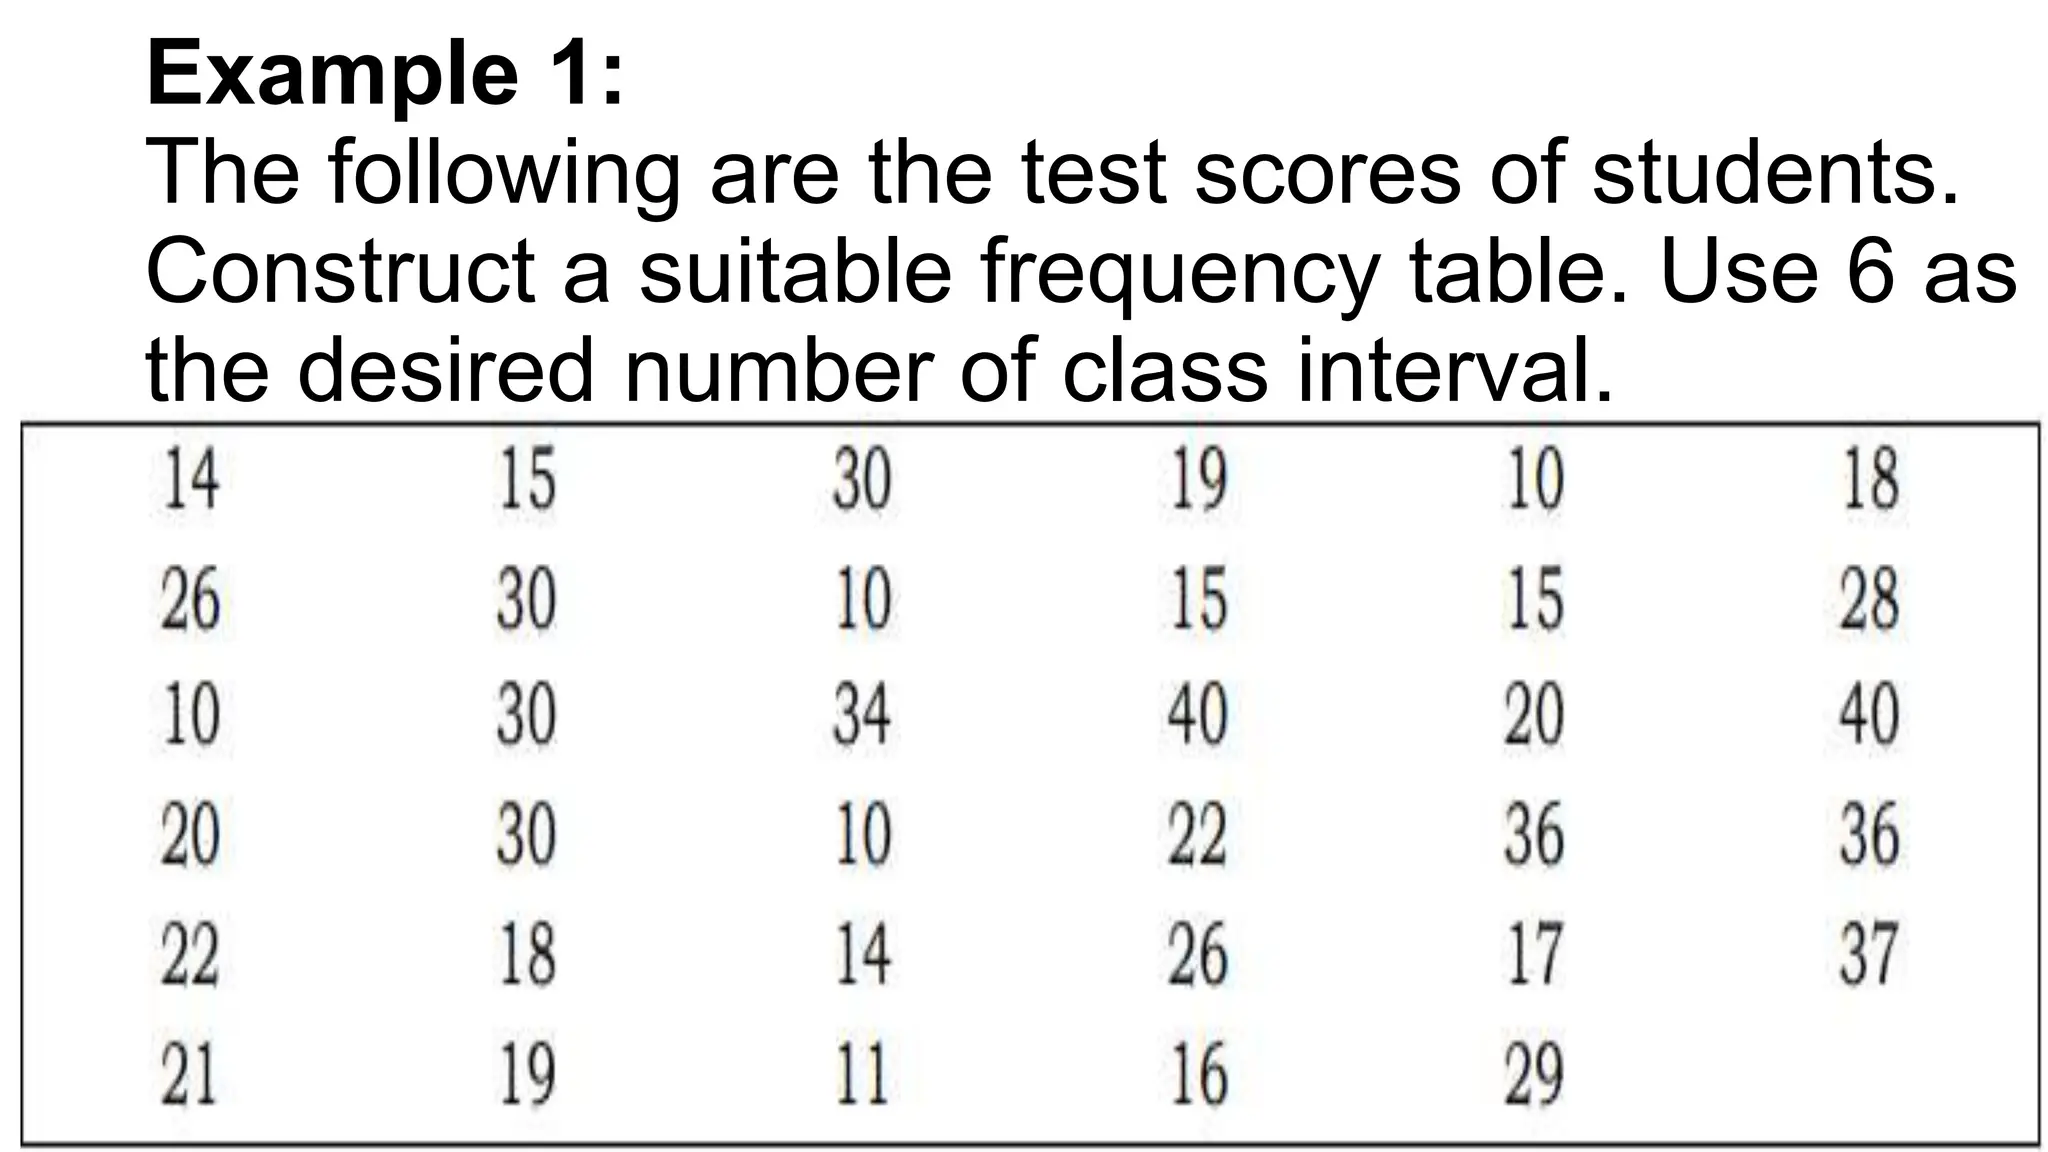
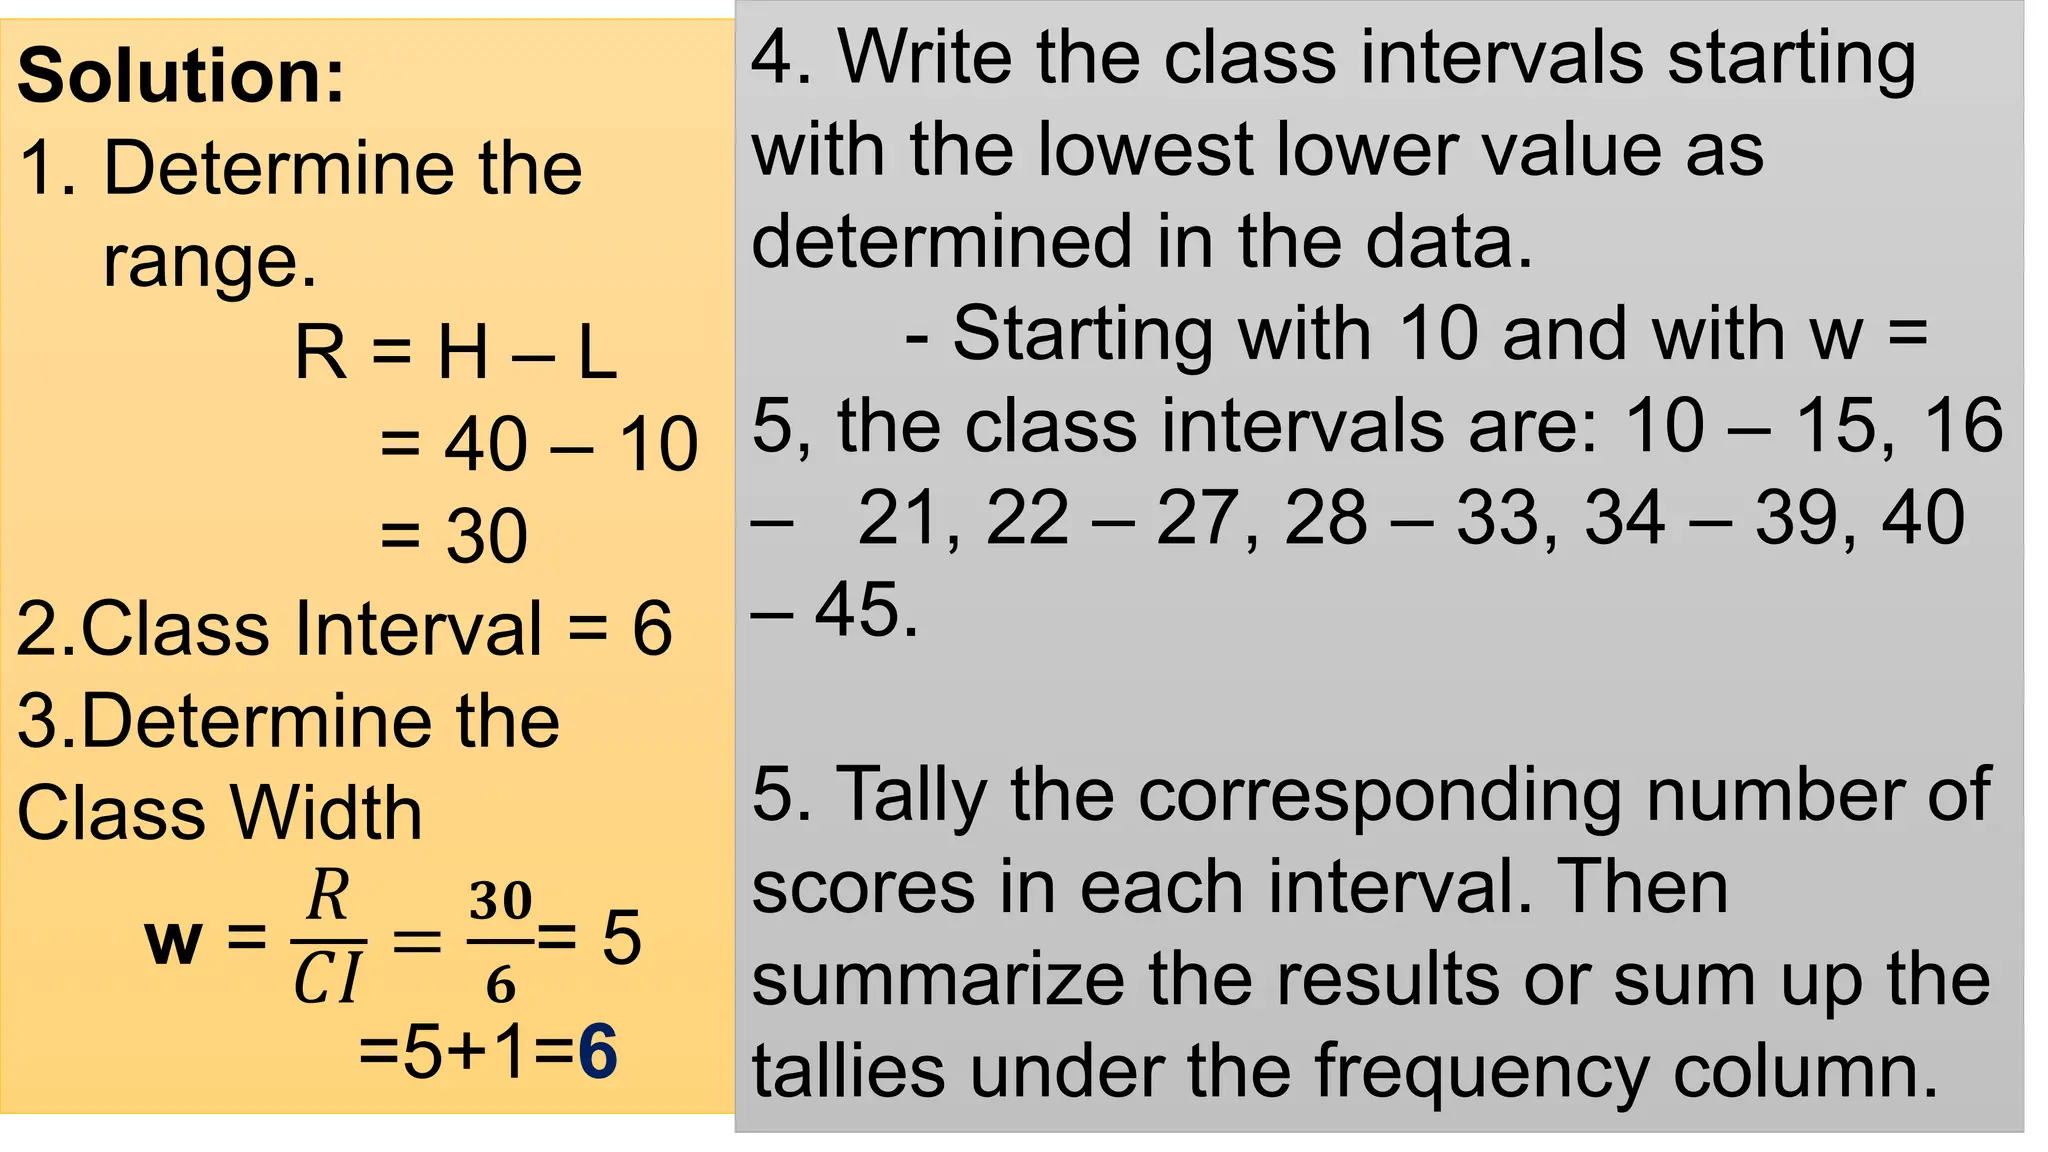
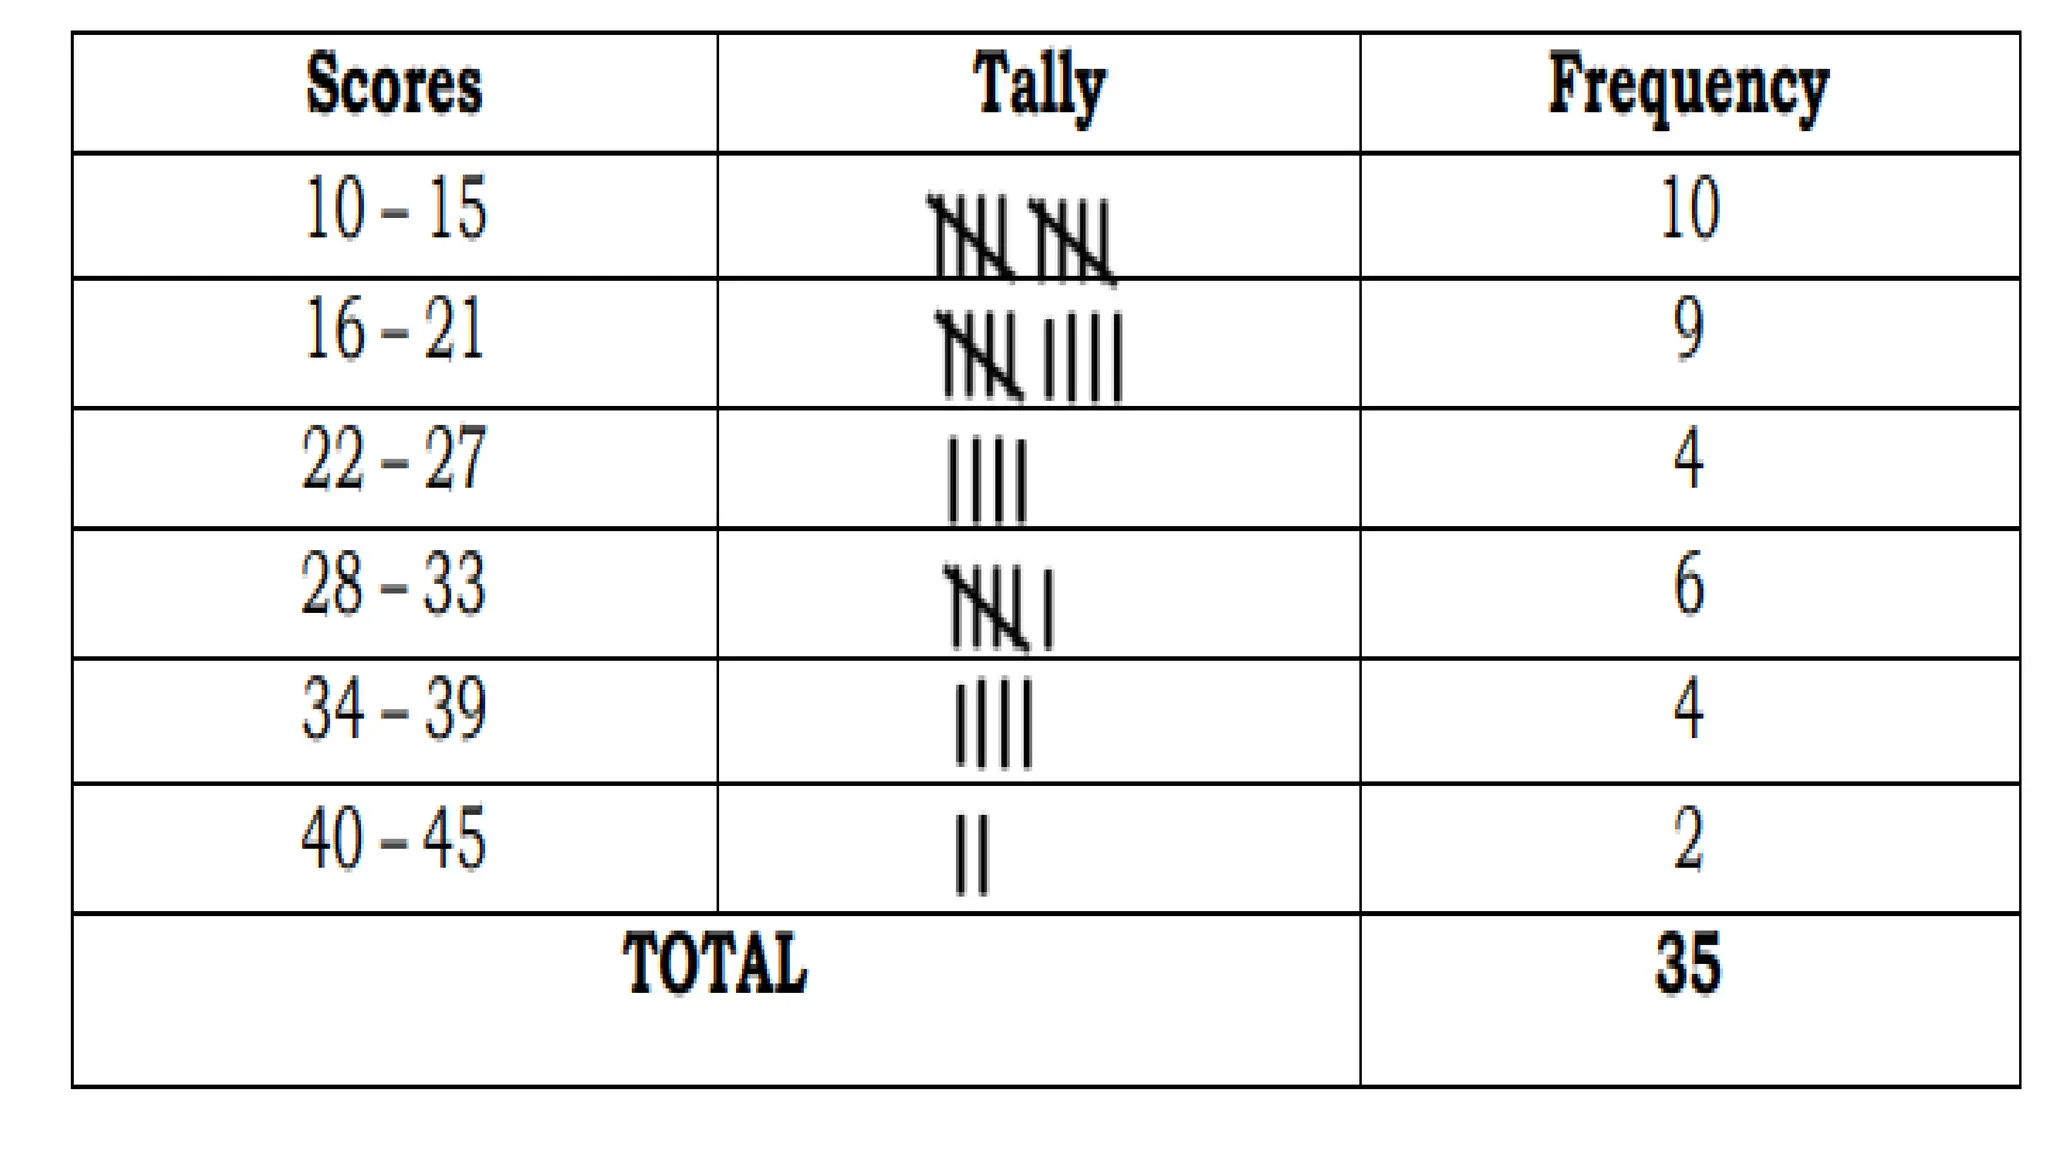
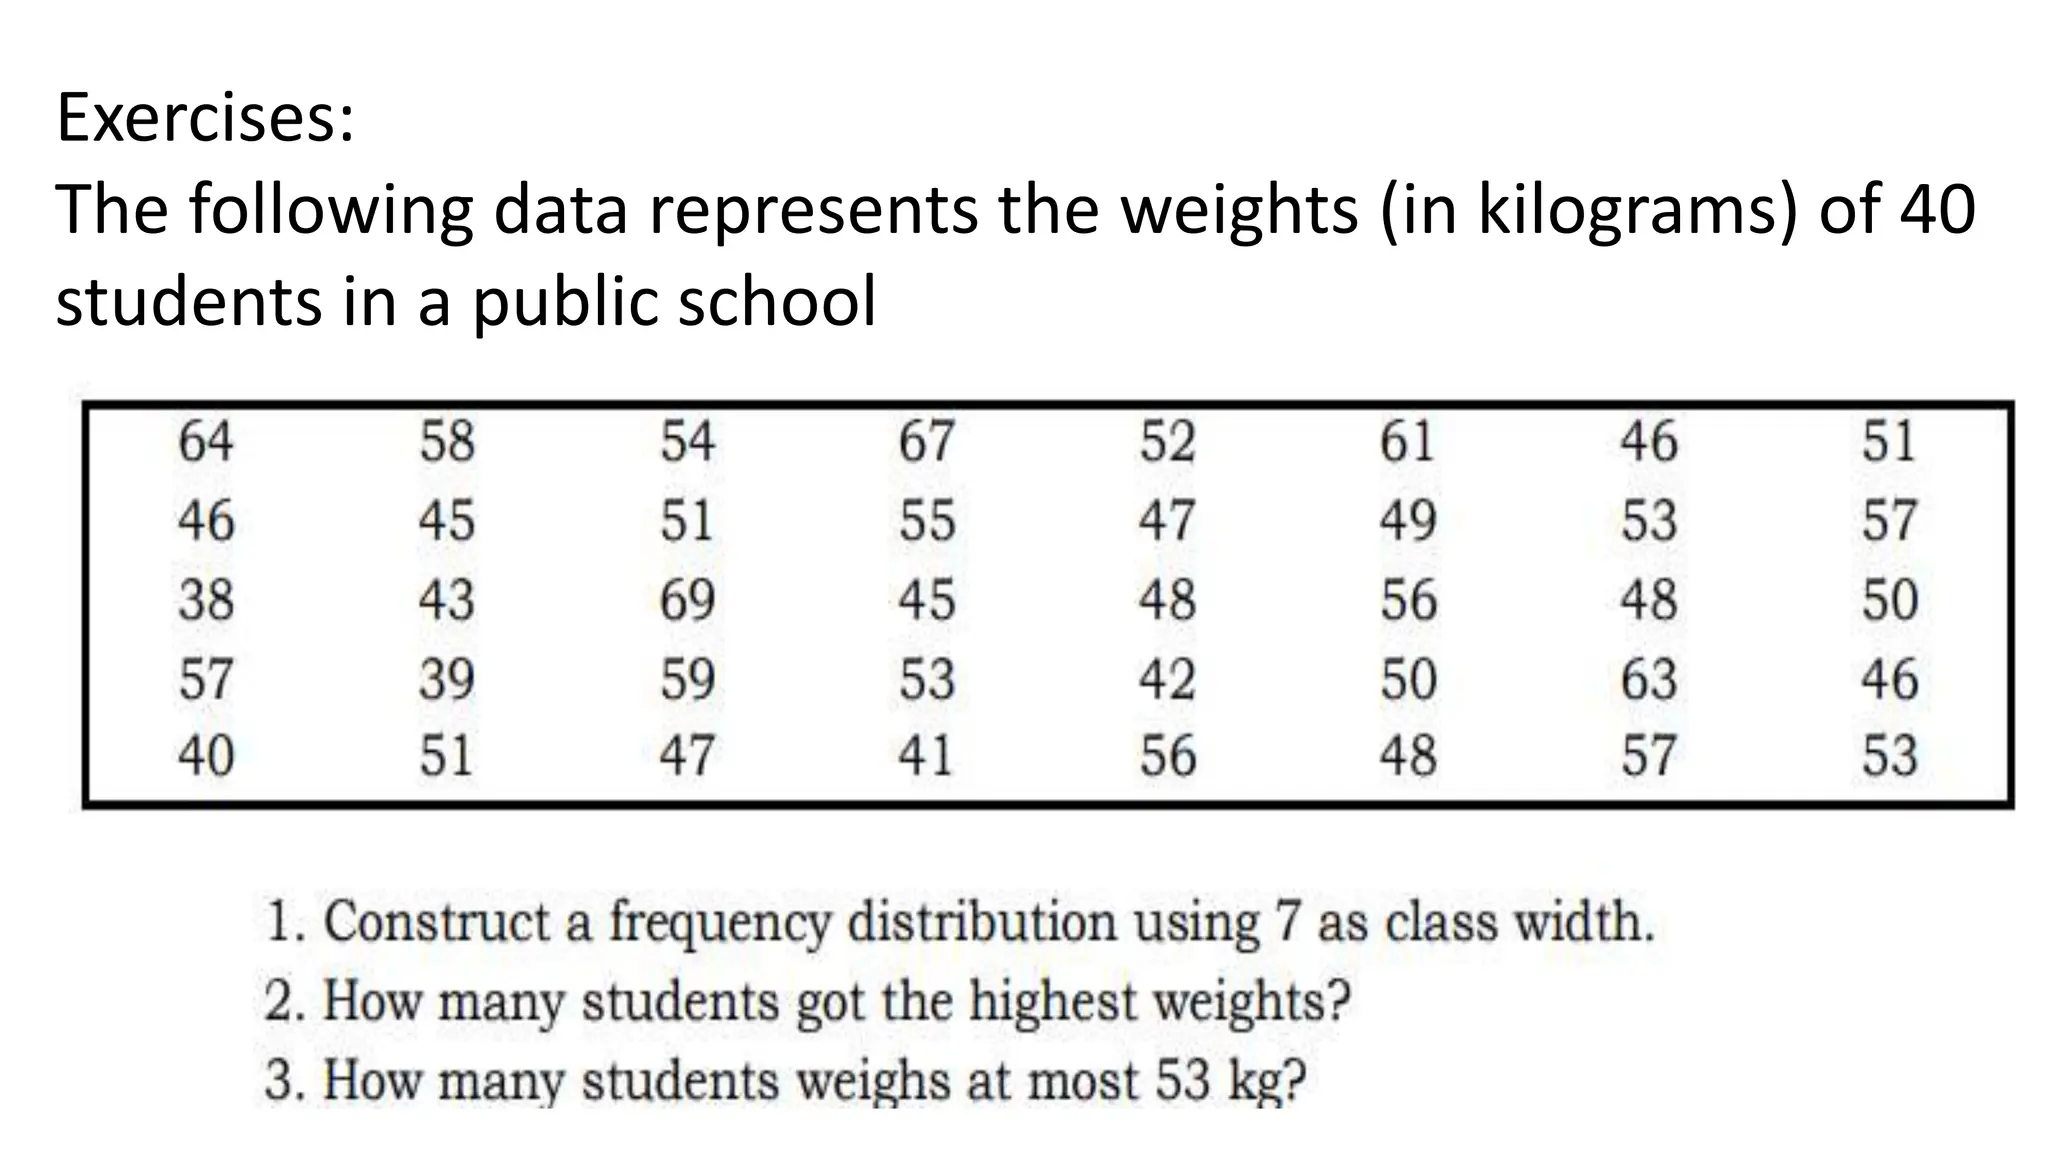
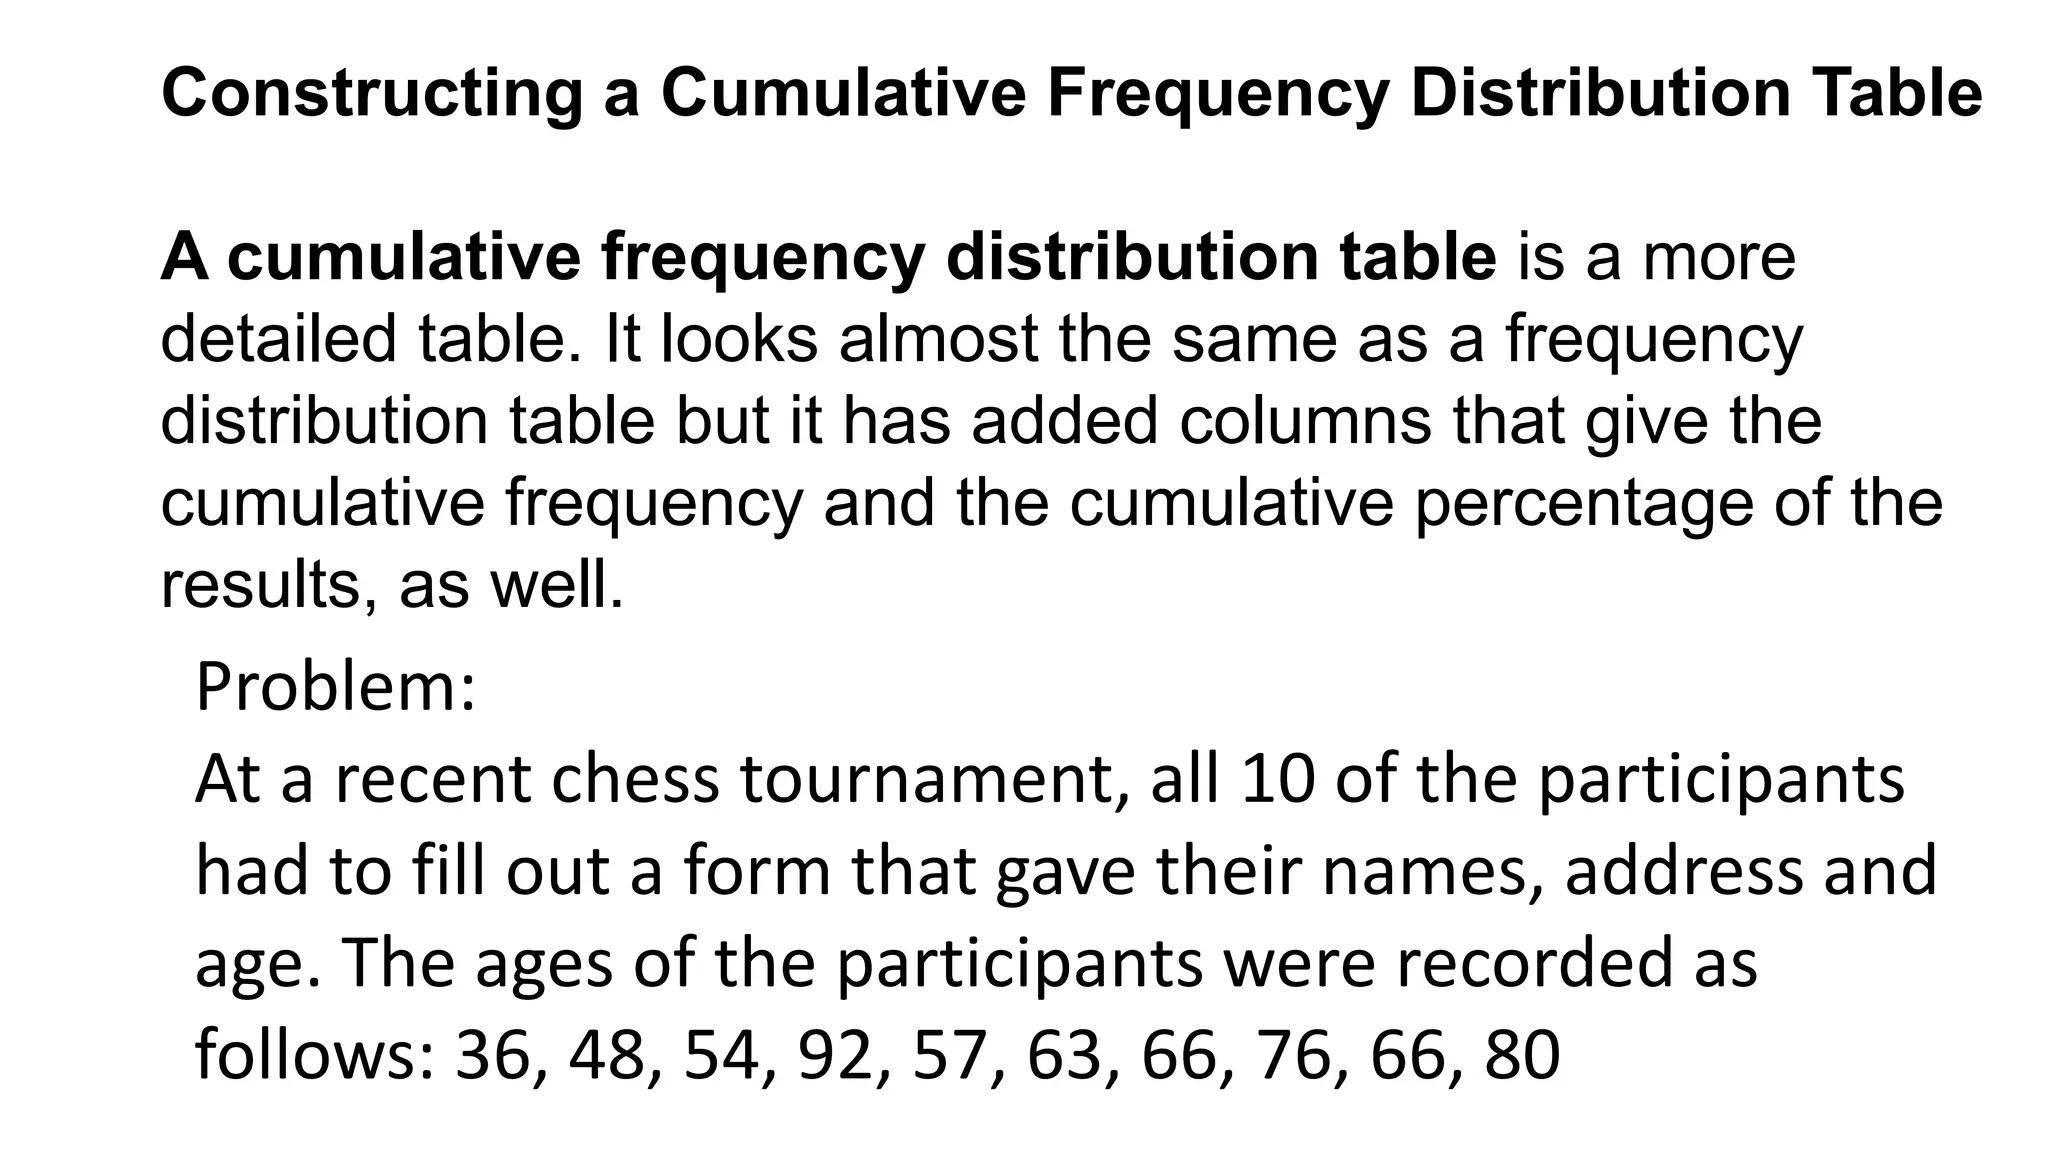
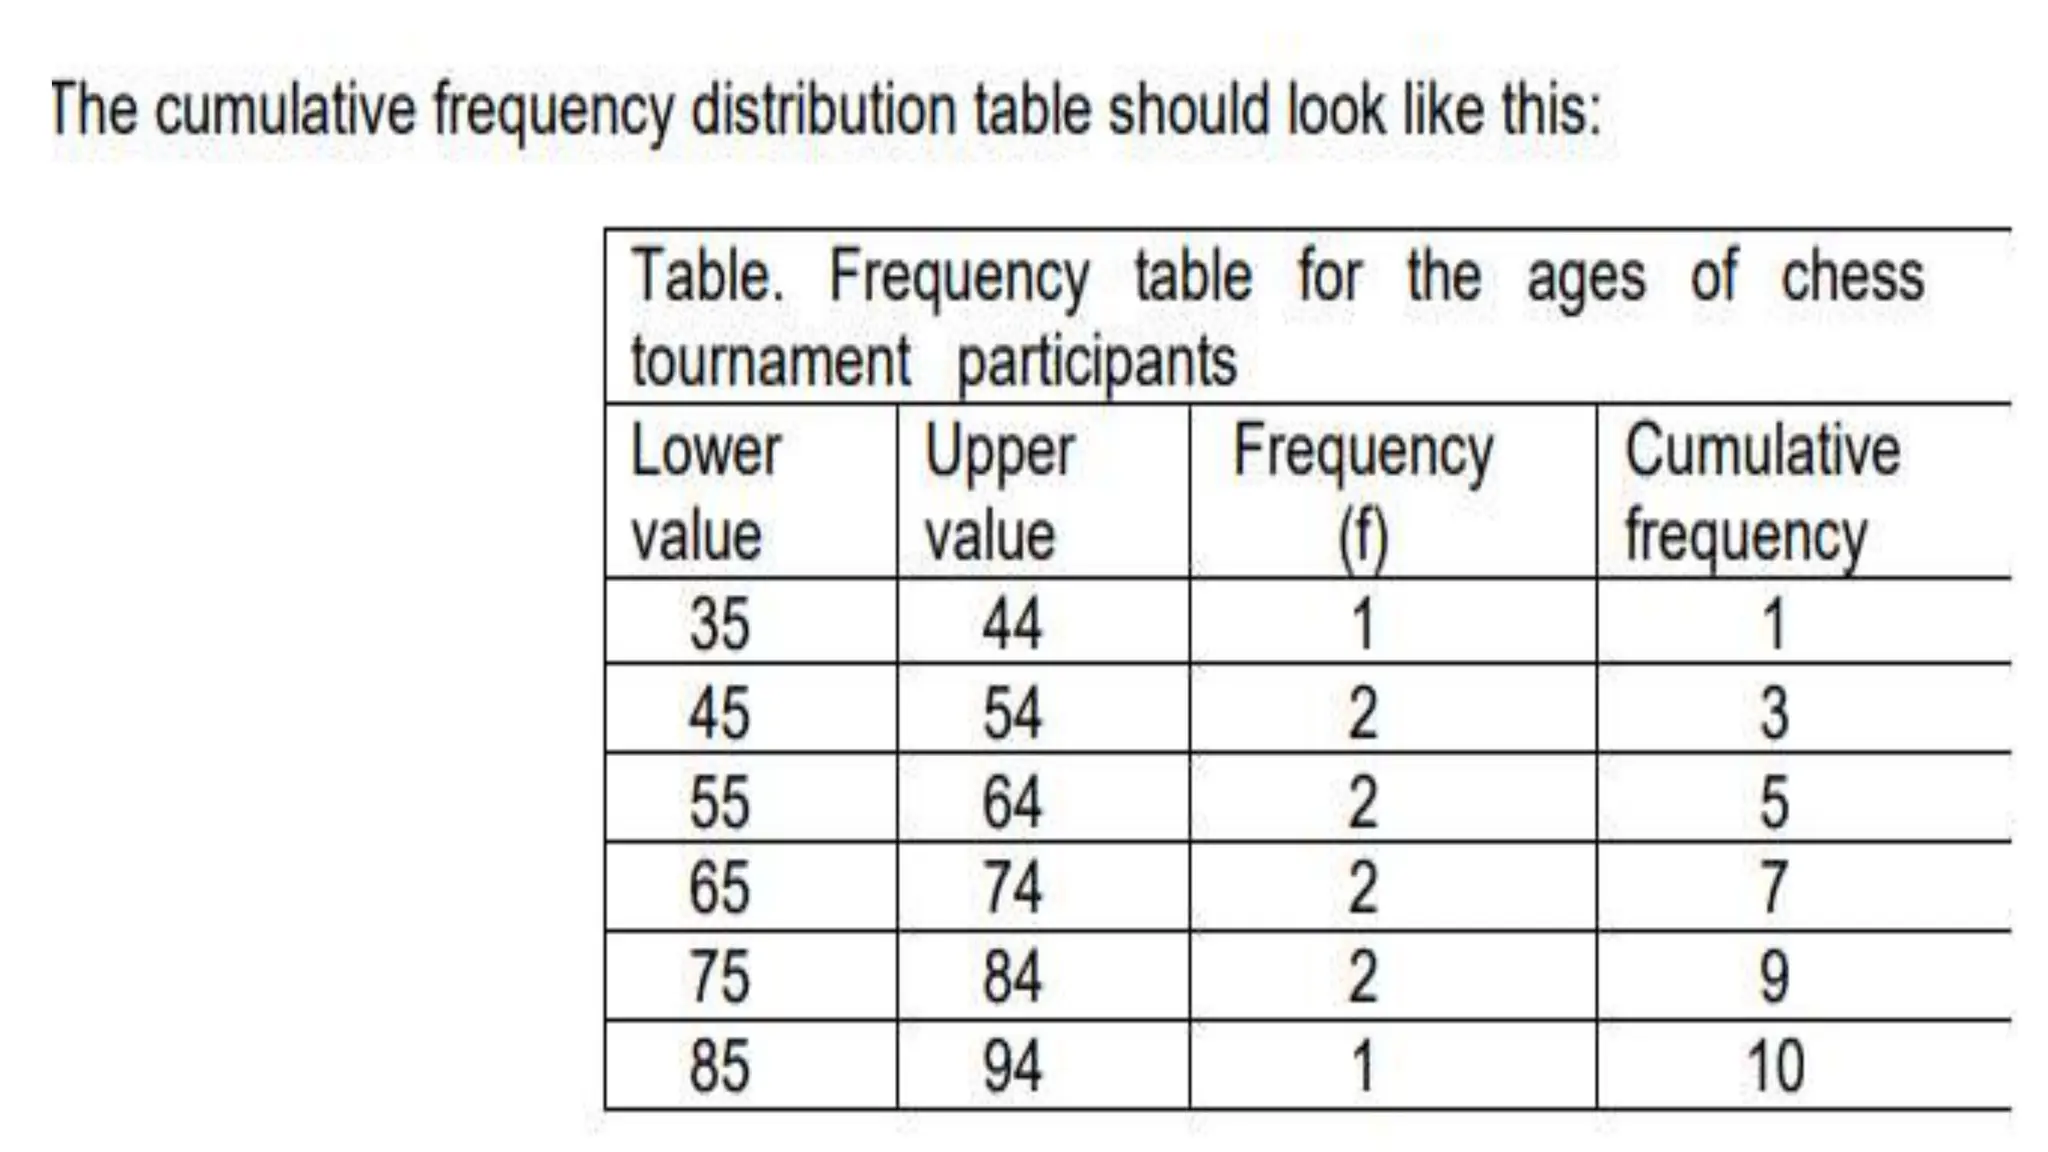
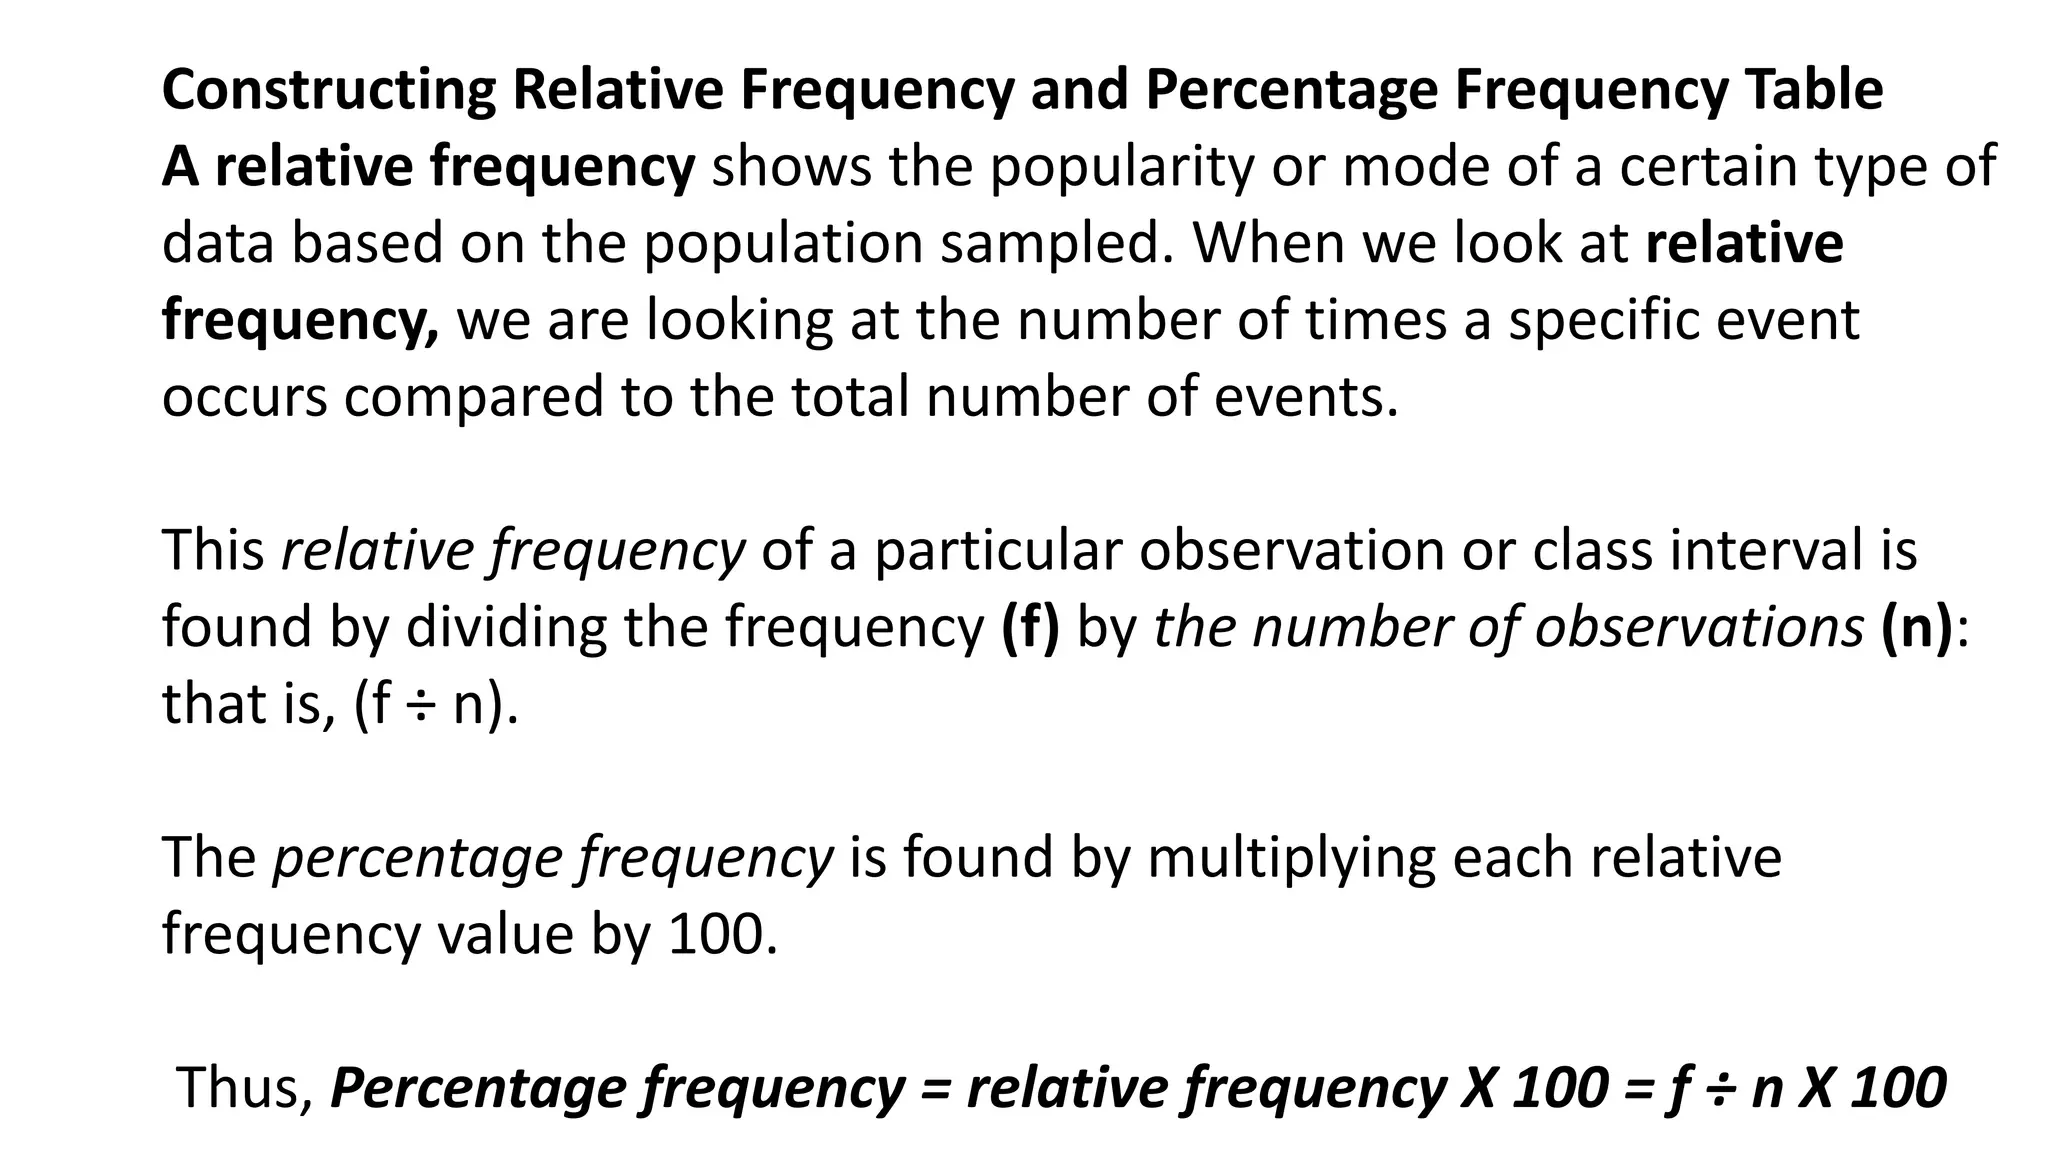
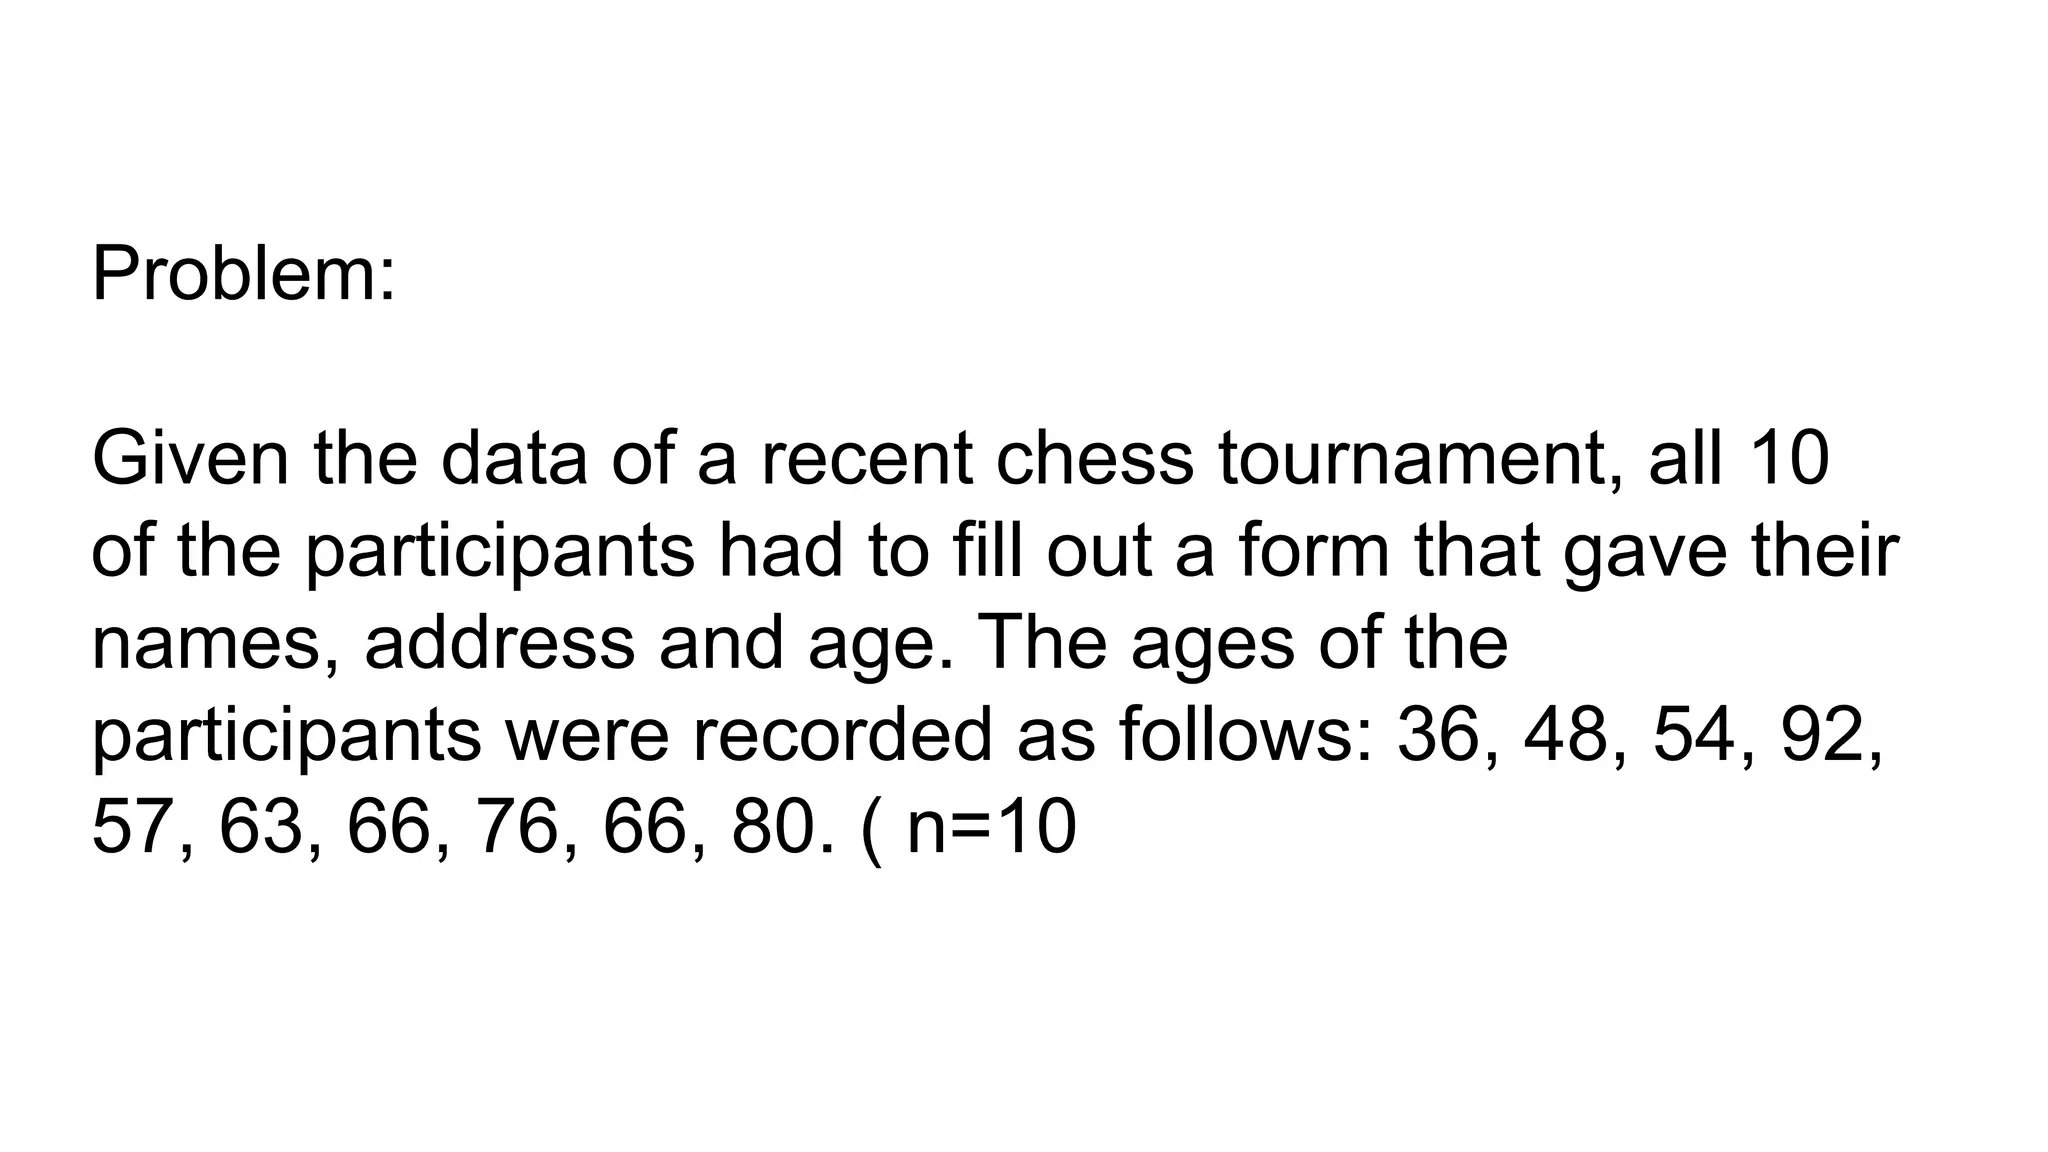
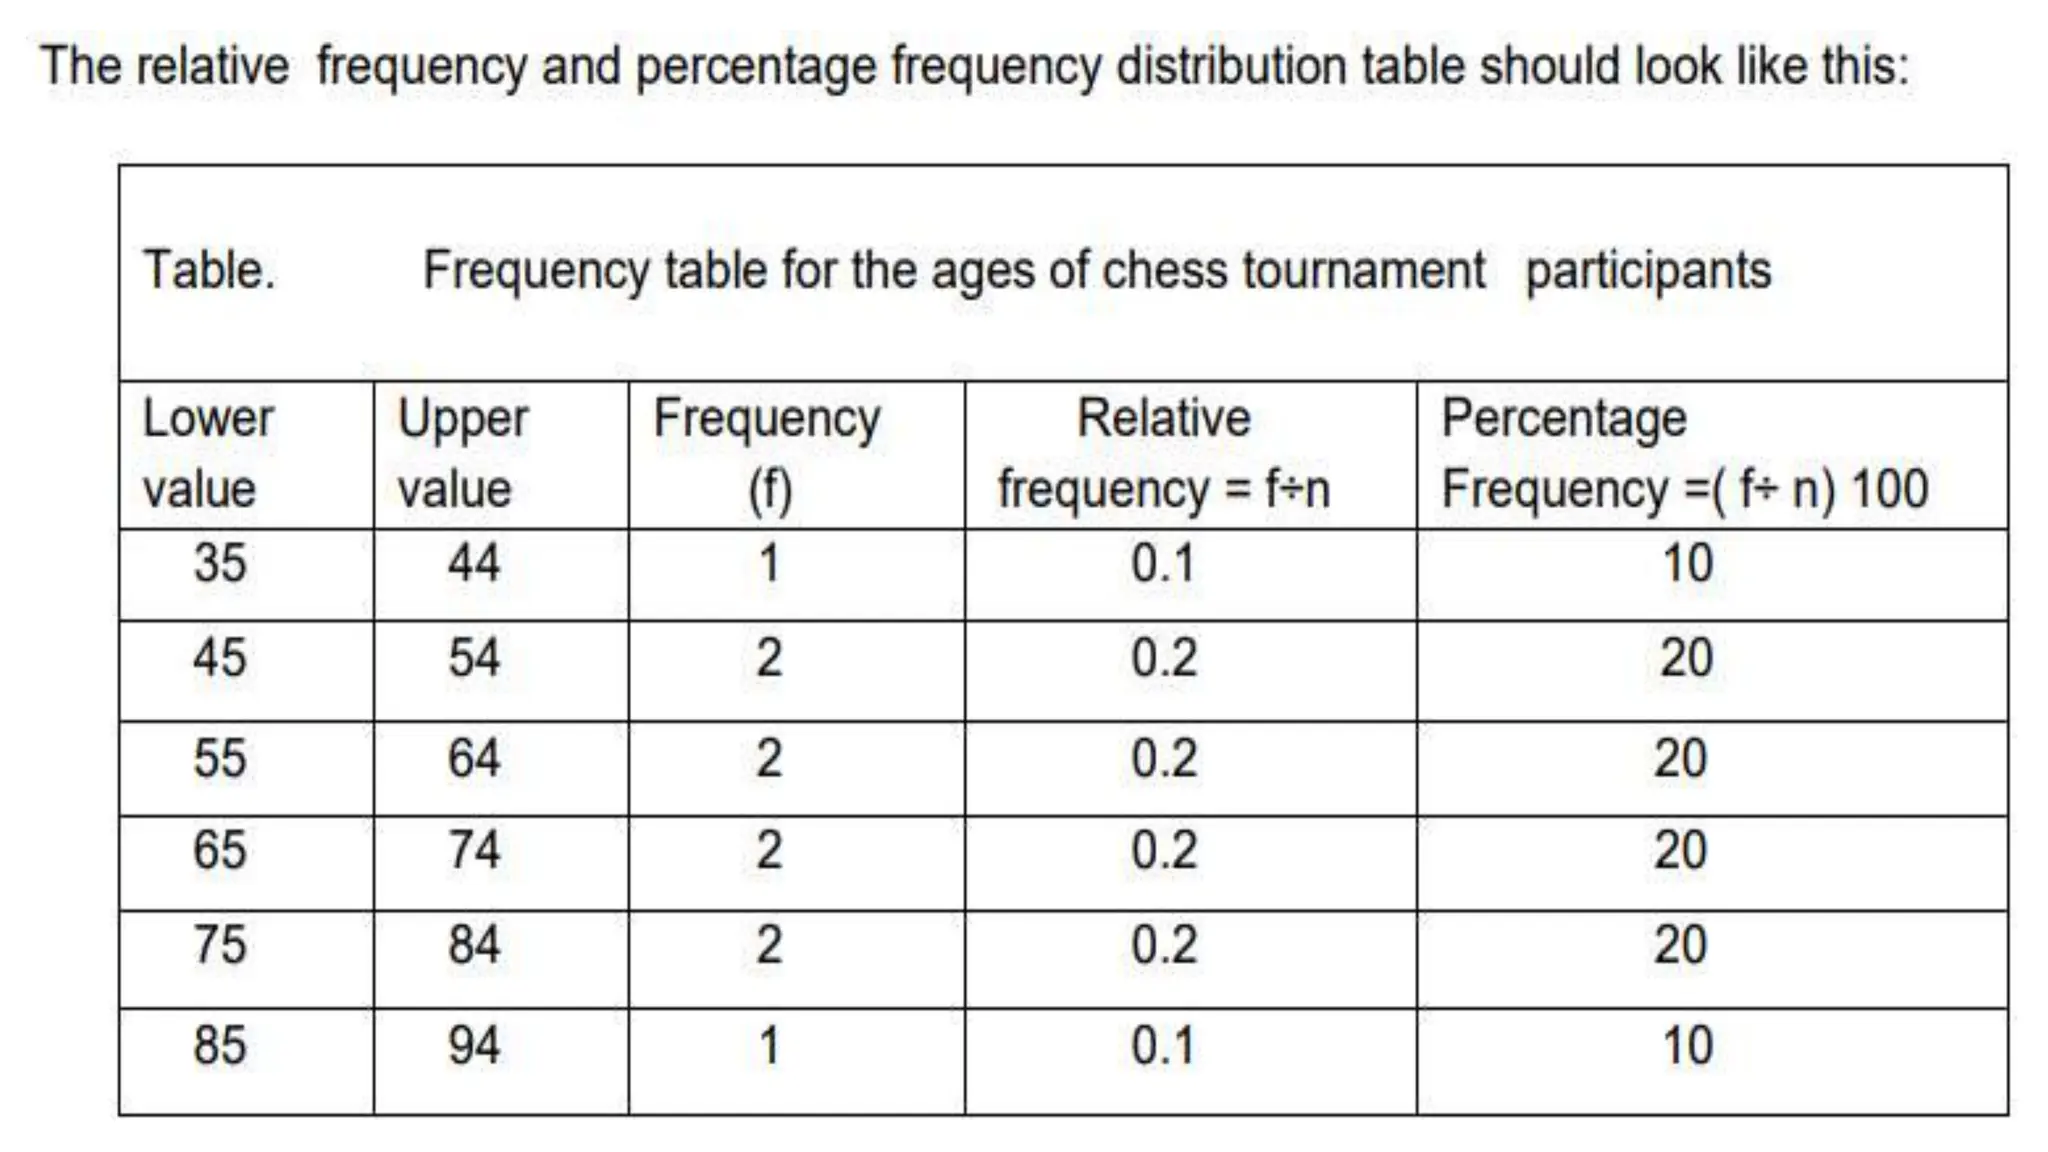
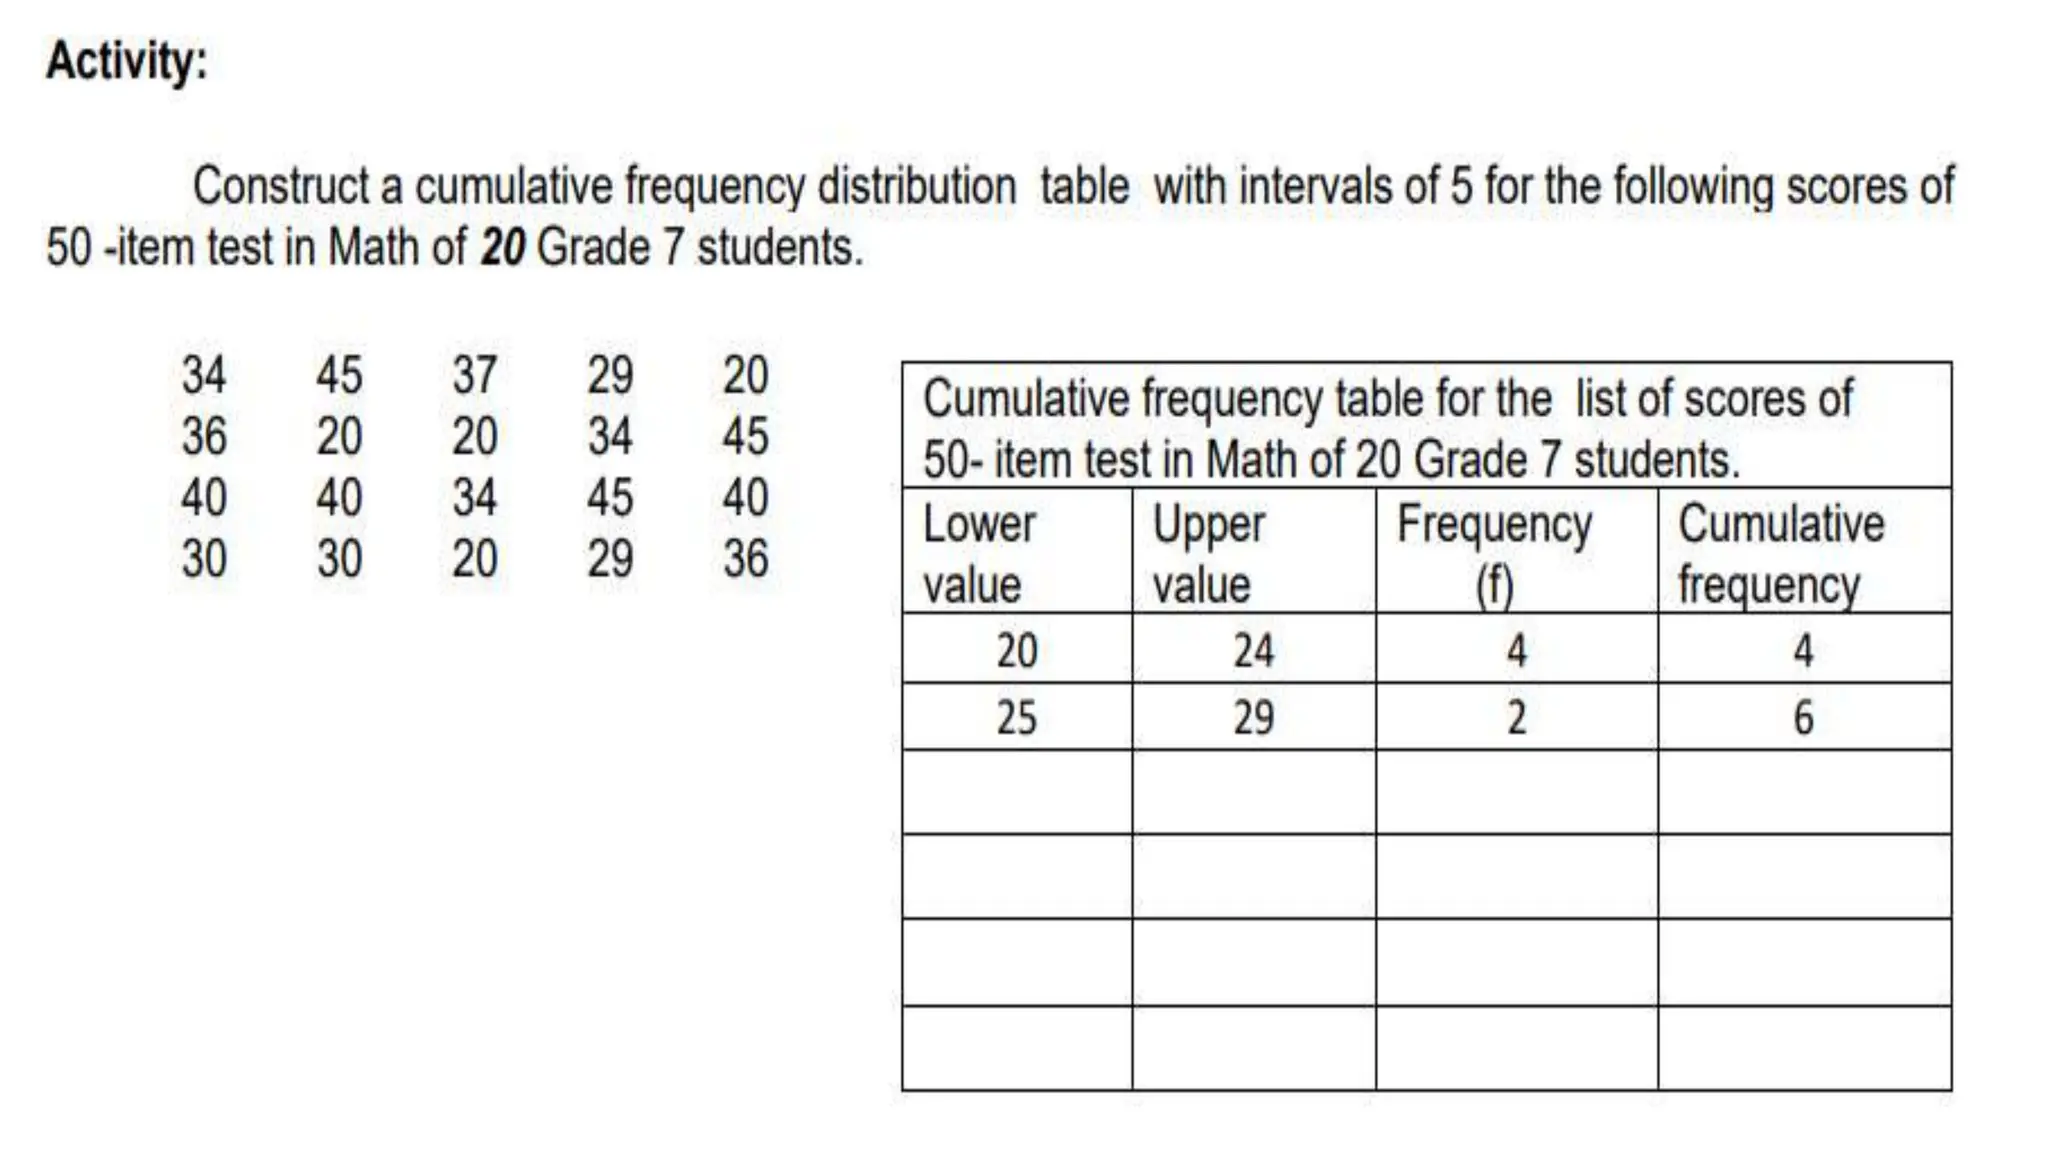
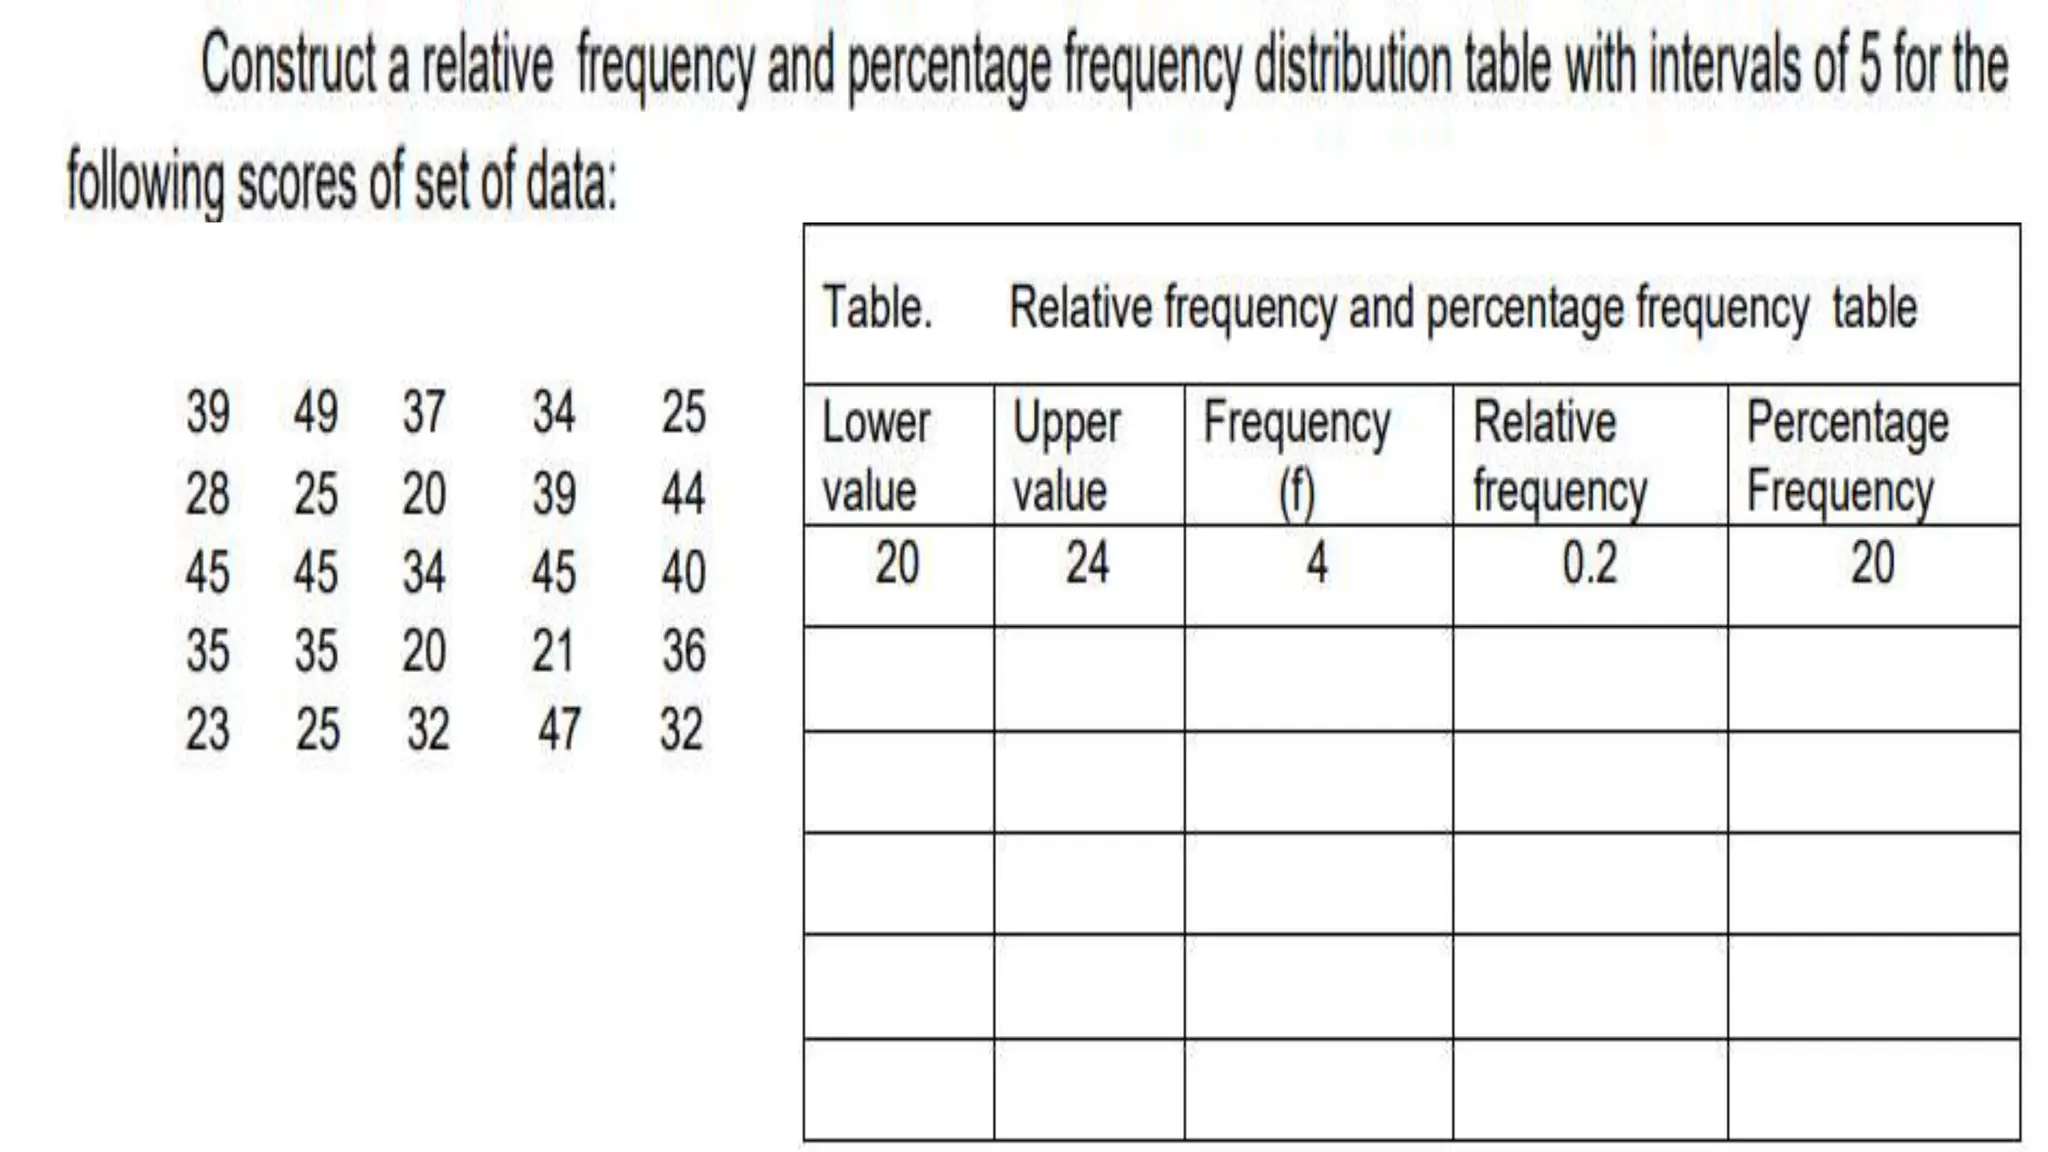
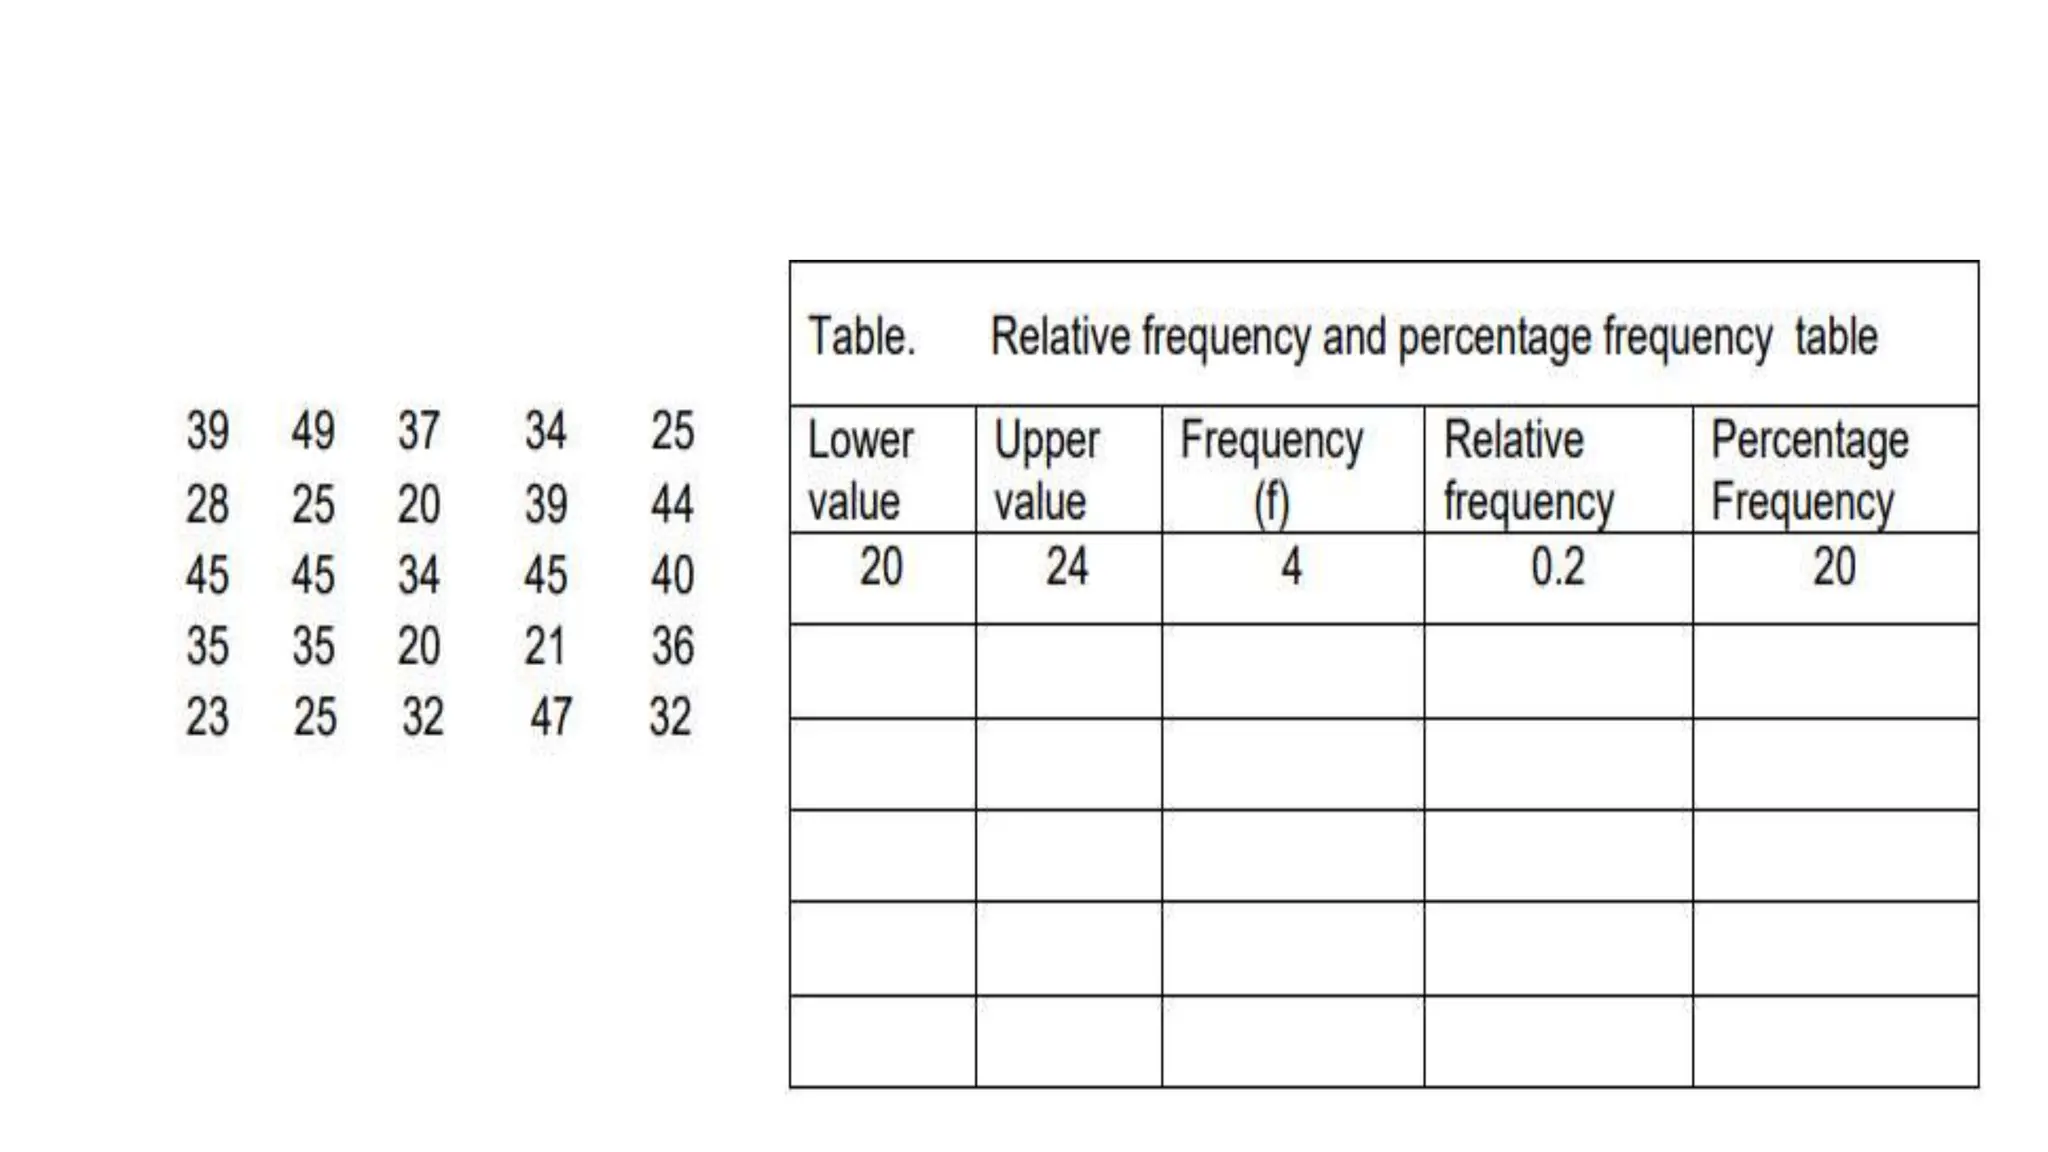
Frequency Distribution Table
Frequency Distribution- is a
way of presenting and
organizing data in a tabular
form using classes and
frequencies
Frequency Table- is a table
that lists items and shows
the number of times the
items occur.
Frequency-the number of
occurrences of a data
Steps in constructing a frequency table (for
ungrouped data)
Step 1: Make three columns. Arrange the
data in order in the first column.
Step 2: Make a tally.
Step 3: Count the tallies then write the
frequencies
Step 4: Total all the frequencies
Problem:
A survey was taken at Prk San Isidro,
Poblacion, Tampakan. In each of 20
homes, people were asked how many
vehicle were registered to their
households. The results were recorded as
follows: 1, 2, 1, 0, 3, 4, 0, 1, 1, 1, 2, 2, 3, 2,
3, 2, 1, 4, 0, 0.
Example 2:
Below are the results of a survey about the
favorite colors of 15 students in a freshman
class. What color is the most favorite of the
students and the least favorite color?
Solution:
1. Write the colors in the first column.
2. Make a tally.
3. Count the tallies then write the
frequencies.
4. Total all the frequencies.
Based on the table, it shows that red is the most favorite color
and violet is the least favorite color of the 15 students.
Example 3:
An airline asked their passenger on a
flight to rate the quality of their service.
The table below shows the ratings of 24
passengers. Make a frequency
distribution table of the data collected.
How many passengers gave a rating of 3
and below?
Exercises:
Process questions:
1. What is the most favorite subject of
the selected Grade 7 students?
2. What is their least favorite subject?
3. How many students choose
Mathematics as their favorite subject?
Complete the frequency table then answer the following questions.
1.What is the most common number of beats per minute?
2.How many people had pulse rates of 80 and higher?
3.How many people had pulse rate of 70 and below?
Assignment: Construct a suitable frequency
table for the following list of shoe sizes of 35
boys :
7 5 4 4 6 5 4
8 5 5 4 3 5 6
5 3 6 3 2 8 5
6 6 7 4 7 4 5
4 4 2 5 5 6 4
Shoe Size Tally Frequency (f)
Steps in constructing a frequency table for
a given ungrouped data to be transformed
as a grouped data.
1. Determine the range. Range is the
difference between the highest value H and the
lowest value L in the set of data. R = H – L
2. Determine the desired number of the class
interval or categories. The ideal number of
class interval in somewhere between 5 and 20.
3. Determine the class width or approximate
size of the class interval by dividing the range
by the desired number of class intervals.
Class width =
ܴܽ݊݃݁
‫ݏݏ݈ܽܥ‬ ‫݈ܽݒݎ݁ݐ݊ܫ‬
in symbol
w =
ܴ
‫ܫܥ‬
4. Write the class
intervals starting with the
lowest lower value as
determined in the data.
Then add the class width
to the starting point to
get the next interval. Do
this until the highest
value is contained in the
last interval.
5. Tally the
corresponding number
of scores in each
interval. Then
summarize the results or
sum up the tallies under
the frequency column.
Example 1:
The following are the test scores of students.
Construct a suitable frequency table. Use 6 as
the desired number of class interval.
Solution:
1. Determine the
range.
R = H – L
= 40 – 10
= 30
2.Class Interval = 6
3.Determine the
Class Width
w =
ܴ
‫ܫܥ‬
=
𝟑𝟎
𝟔
= 5
=5+1=6
4. Write the class intervals starting
with the lowest lower value as
determined in the data.
- Starting with 10 and with w =
5, the class intervals are: 10 – 15, 16
– 21, 22 – 27, 28 – 33, 34 – 39, 40
– 45.
5. Tally the corresponding number of
scores in each interval. Then
summarize the results or sum up the
tallies under the frequency column.
Exercises:
The following data represents the weights (in kilograms) of 40
students in a public school
Performance Task!
Conduct a survey to find out the allowance of the students
received each day from their parents and write their answers
inside the box. The number of respondents is 40 students.
a. Construct a frequency table for the data.
b. What is the least amount of allowance received by a student?
c. What is the largest amount of allowance received by a
student?
d. How many students received Php 30.00 a day?
e. What is the frequency of Php 10.00?
Constructing a Cumulative Frequency Distribution Table
A cumulative frequency distribution table is a more
detailed table. It looks almost the same as a frequency
distribution table but it has added columns that give the
cumulative frequency and the cumulative percentage of the
results, as well.
Problem:
At a recent chess tournament, all 10 of the participants
had to fill out a form that gave their names, address and
age. The ages of the participants were recorded as
follows: 36, 48, 54, 92, 57, 63, 66, 76, 66, 80
Constructing Relative Frequency and Percentage Frequency Table
A relative frequency shows the popularity or mode of a certain type of
data based on the population sampled. When we look at relative
frequency, we are looking at the number of times a specific event
occurs compared to the total number of events.
This relative frequency of a particular observation or class interval is
found by dividing the frequency (f) by the number of observations (n):
that is, (f ÷ n).
The percentage frequency is found by multiplying each relative
frequency value by 100.
Thus, Percentage frequency = relative frequency X 100 = f ÷ n X 100
Problem:
Given the data of a recent chess tournament, all 10
of the participants had to fill out a form that gave their
names, address and age. The ages of the
participants were recorded as follows: 36, 48, 54, 92,
57, 63, 66, 76, 66, 80. ( n=10
Frequency Distribution Table math 7.pptx

Frequency Distribution Table math 7.pptx

  • 1.
  • 2.
    Frequency Distribution- isa way of presenting and organizing data in a tabular form using classes and frequencies
  • 3.
    Frequency Table- isa table that lists items and shows the number of times the items occur. Frequency-the number of occurrences of a data
  • 4.
    Steps in constructinga frequency table (for ungrouped data) Step 1: Make three columns. Arrange the data in order in the first column. Step 2: Make a tally. Step 3: Count the tallies then write the frequencies Step 4: Total all the frequencies
  • 5.
    Problem: A survey wastaken at Prk San Isidro, Poblacion, Tampakan. In each of 20 homes, people were asked how many vehicle were registered to their households. The results were recorded as follows: 1, 2, 1, 0, 3, 4, 0, 1, 1, 1, 2, 2, 3, 2, 3, 2, 1, 4, 0, 0.
  • 7.
    Example 2: Below arethe results of a survey about the favorite colors of 15 students in a freshman class. What color is the most favorite of the students and the least favorite color?
  • 8.
    Solution: 1. Write thecolors in the first column. 2. Make a tally. 3. Count the tallies then write the frequencies. 4. Total all the frequencies.
  • 9.
    Based on thetable, it shows that red is the most favorite color and violet is the least favorite color of the 15 students.
  • 10.
    Example 3: An airlineasked their passenger on a flight to rate the quality of their service. The table below shows the ratings of 24 passengers. Make a frequency distribution table of the data collected. How many passengers gave a rating of 3 and below?
  • 13.
  • 14.
    Process questions: 1. Whatis the most favorite subject of the selected Grade 7 students? 2. What is their least favorite subject? 3. How many students choose Mathematics as their favorite subject?
  • 15.
    Complete the frequencytable then answer the following questions. 1.What is the most common number of beats per minute? 2.How many people had pulse rates of 80 and higher? 3.How many people had pulse rate of 70 and below?
  • 16.
    Assignment: Construct asuitable frequency table for the following list of shoe sizes of 35 boys : 7 5 4 4 6 5 4 8 5 5 4 3 5 6 5 3 6 3 2 8 5 6 6 7 4 7 4 5 4 4 2 5 5 6 4 Shoe Size Tally Frequency (f)
  • 17.
    Steps in constructinga frequency table for a given ungrouped data to be transformed as a grouped data. 1. Determine the range. Range is the difference between the highest value H and the lowest value L in the set of data. R = H – L 2. Determine the desired number of the class interval or categories. The ideal number of class interval in somewhere between 5 and 20. 3. Determine the class width or approximate size of the class interval by dividing the range by the desired number of class intervals. Class width = ܴܽ݊݃݁ ‫ݏݏ݈ܽܥ‬ ‫݈ܽݒݎ݁ݐ݊ܫ‬ in symbol w = ܴ ‫ܫܥ‬ 4. Write the class intervals starting with the lowest lower value as determined in the data. Then add the class width to the starting point to get the next interval. Do this until the highest value is contained in the last interval. 5. Tally the corresponding number of scores in each interval. Then summarize the results or sum up the tallies under the frequency column.
  • 20.
    Example 1: The followingare the test scores of students. Construct a suitable frequency table. Use 6 as the desired number of class interval.
  • 21.
    Solution: 1. Determine the range. R= H – L = 40 – 10 = 30 2.Class Interval = 6 3.Determine the Class Width w = ܴ ‫ܫܥ‬ = 𝟑𝟎 𝟔 = 5 =5+1=6 4. Write the class intervals starting with the lowest lower value as determined in the data. - Starting with 10 and with w = 5, the class intervals are: 10 – 15, 16 – 21, 22 – 27, 28 – 33, 34 – 39, 40 – 45. 5. Tally the corresponding number of scores in each interval. Then summarize the results or sum up the tallies under the frequency column.
  • 23.
    Exercises: The following datarepresents the weights (in kilograms) of 40 students in a public school
  • 24.
    Performance Task! Conduct asurvey to find out the allowance of the students received each day from their parents and write their answers inside the box. The number of respondents is 40 students. a. Construct a frequency table for the data. b. What is the least amount of allowance received by a student? c. What is the largest amount of allowance received by a student? d. How many students received Php 30.00 a day? e. What is the frequency of Php 10.00?
  • 25.
    Constructing a CumulativeFrequency Distribution Table A cumulative frequency distribution table is a more detailed table. It looks almost the same as a frequency distribution table but it has added columns that give the cumulative frequency and the cumulative percentage of the results, as well. Problem: At a recent chess tournament, all 10 of the participants had to fill out a form that gave their names, address and age. The ages of the participants were recorded as follows: 36, 48, 54, 92, 57, 63, 66, 76, 66, 80
  • 27.
    Constructing Relative Frequencyand Percentage Frequency Table A relative frequency shows the popularity or mode of a certain type of data based on the population sampled. When we look at relative frequency, we are looking at the number of times a specific event occurs compared to the total number of events. This relative frequency of a particular observation or class interval is found by dividing the frequency (f) by the number of observations (n): that is, (f ÷ n). The percentage frequency is found by multiplying each relative frequency value by 100. Thus, Percentage frequency = relative frequency X 100 = f ÷ n X 100
  • 28.
    Problem: Given the dataof a recent chess tournament, all 10 of the participants had to fill out a form that gave their names, address and age. The ages of the participants were recorded as follows: 36, 48, 54, 92, 57, 63, 66, 76, 66, 80. ( n=10