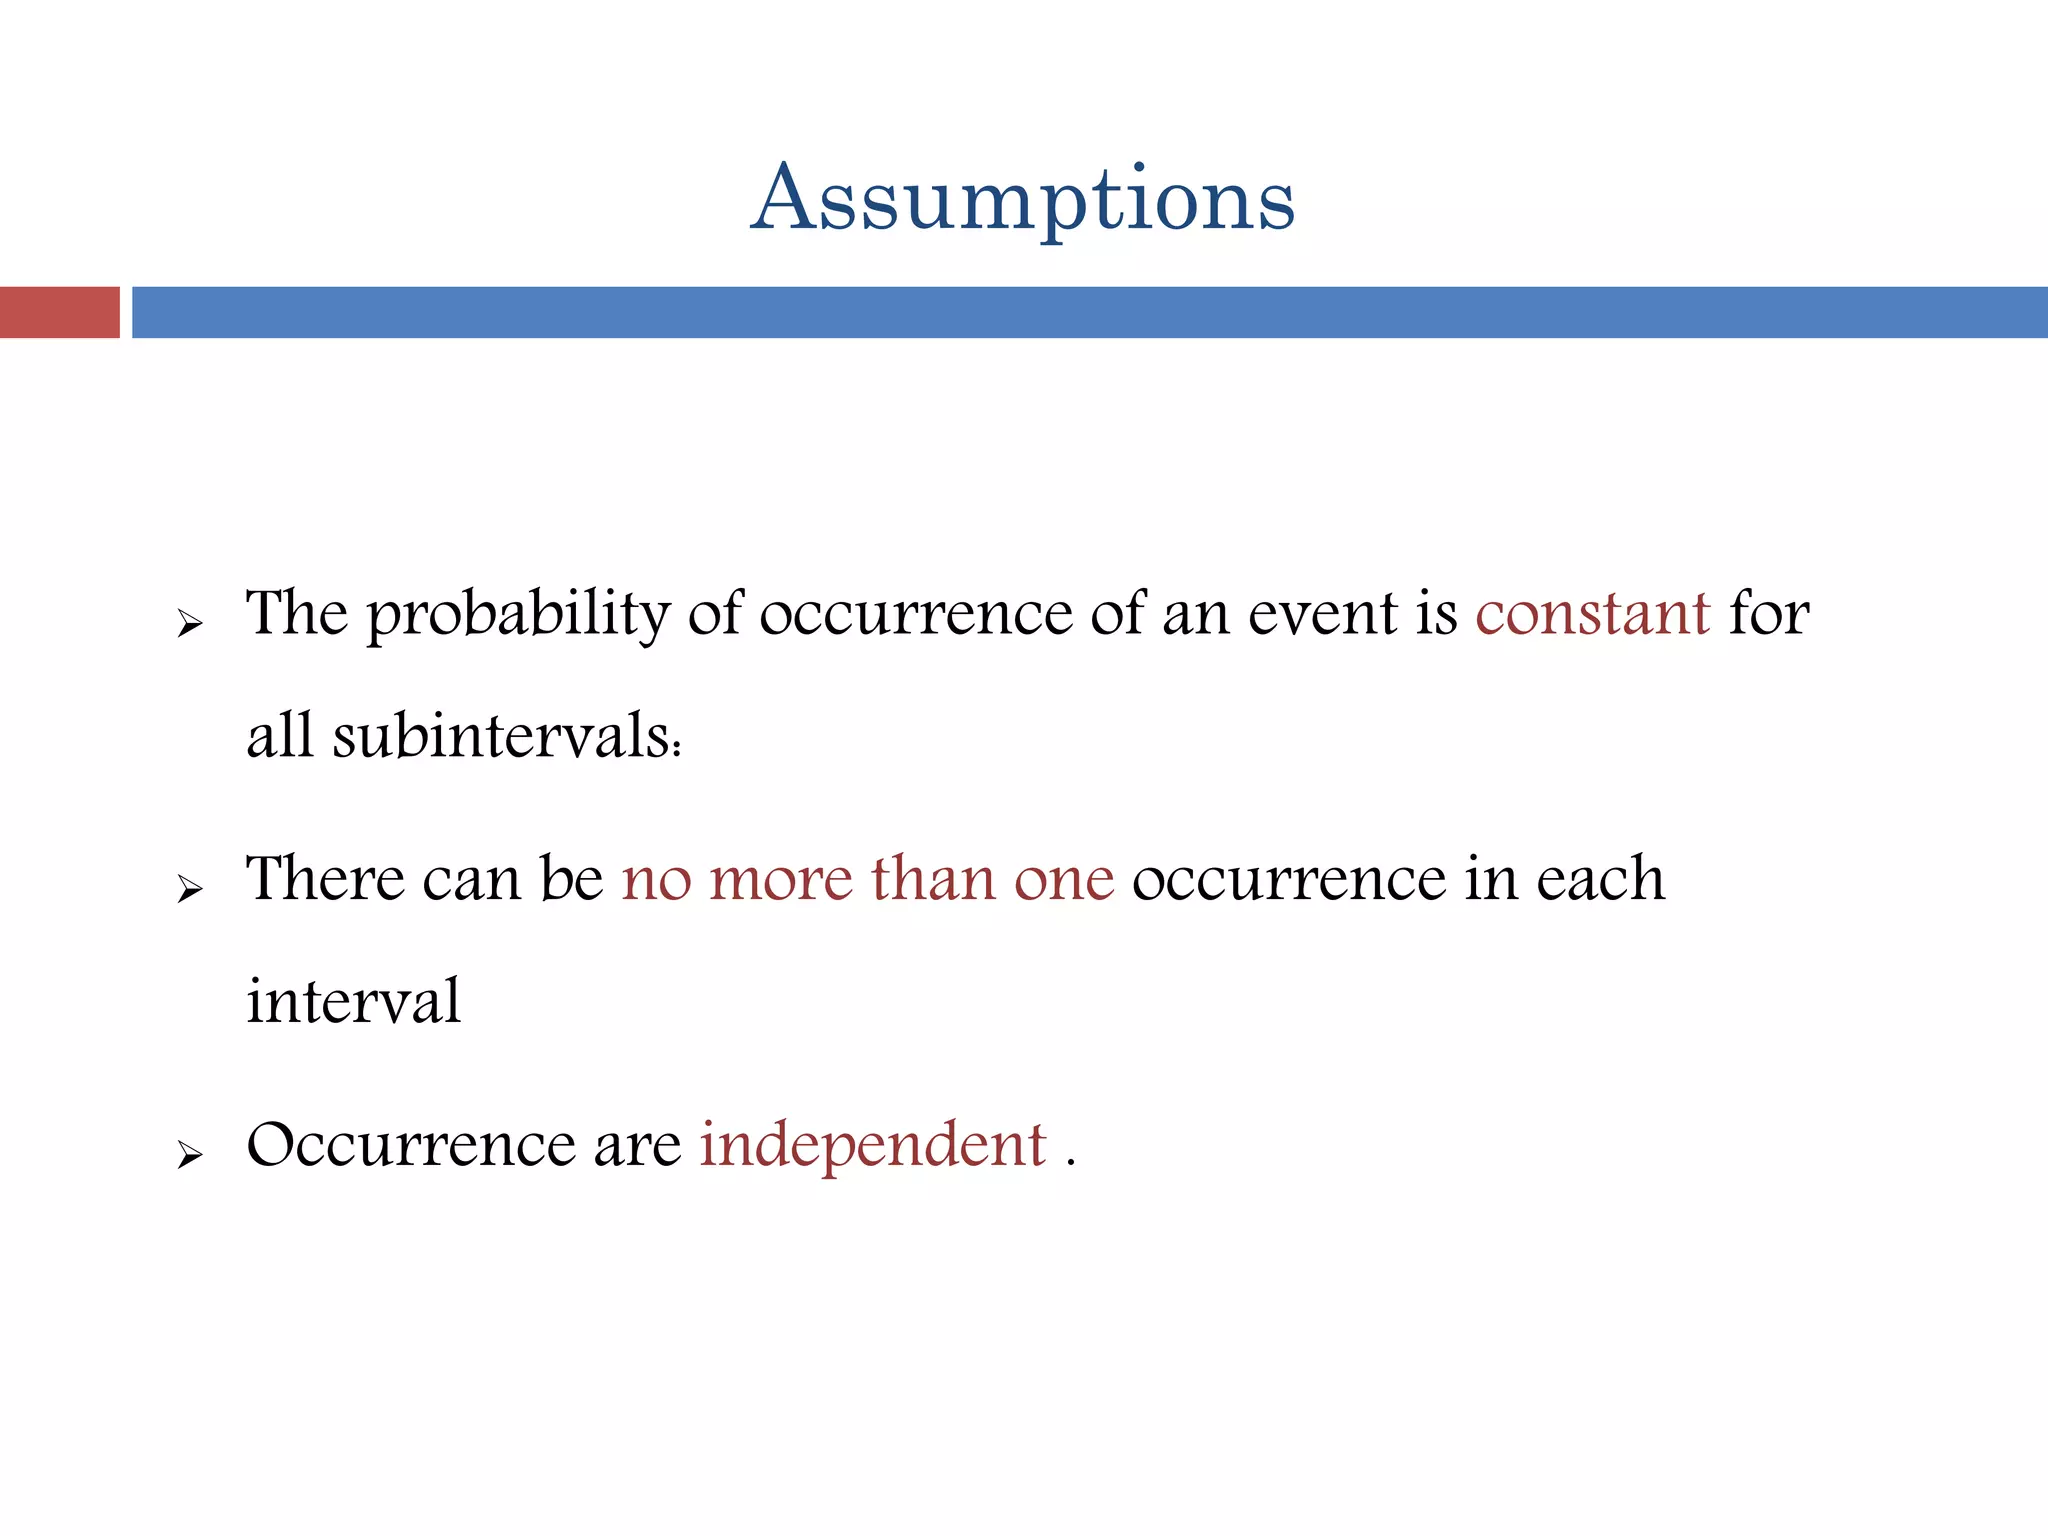
A binomial random variable is the number of successes x in n repeated trials of a binomial experiment. The probability distribution of a binomial random variable is called a binomial distribution. Suppose we flip a coin two times and count the number of heads (successes).
It includes various cases and practice problems related to Binomial, Poisson & Normal Distributions. Detailed information on where tp use which probability.
Brief description of the concepts related to correlation analysis. Problem Sums related to Karl Pearson's Correlation, Spearman's Rank Correlation, Coefficient of Concurrent Deviation, Correlation of a grouped data.
A Probability Distribution is a way to shape the sample data to make predictions and draw conclusions about an entire population. It refers to the frequency at which some events or experiments occur. It helps finding all the possible values a random variable can take between the minimum and maximum statistically possible values.
Measures of dispersion
Absolute measure, relative measures
Range of Coe. of Range
Mean deviation and coe. of mean deviation
Quartile deviation IQR, coefficient of QD
Standard deviation and coefficient of variation
A brief description of F Test and ANOVA for Msc Life Science students. I have taken the example slides from youtube where an excellent explanation is available.
Here is the link : https://www.youtube.com/watch?v=-yQb_ZJnFXw
Probability
Random variables and Probability Distributions
The Normal Probability Distributions and Related Distributions
Sampling Distributions for Samples from a Normal Population
Classical Statistical Inferences
Properties of Estimators
Testing of Hypotheses
Relationship between Confidence Interval Procedures and Tests of Hypotheses.
Detail Description about Probability Distribution for Dummies. The contents are about random variables, its types(Discrete and Continuous) , it's distribution (Discrete probability distribution and probability density function), Expected value, Binomial, Poisson and Normal Distribution usage and solved example for each topic.
Please explain both Poisson and exponential distributions and the di.pdfajinthaenterprises
Please explain both Poisson and exponential distributions and the difference between them.
Please include extensive details for lifesaver.
Solution
The Poisson distribution - Introduction
The Poisson distribution is related to the exponential distribution. Suppose a certain event can
occur many times within a unit of time. Denote by x the total number of occurrences within a
unit of time. Suppose x is unknown (it is a random variable). If the time elapsed between two
successive occurrences of the event has an exponential distribution (and it is independent of
previous occurrences), then x has a Poisson distribution.
The Poisson distribution - Definition
The Poisson distribution is characterized as follows:
Definition_ Let x be a discrete random variable. Let its support Rx be the set of positive integer
numbers (the natural numbers and ):
Rx = Z+
For a Poisson process, hits occur at random independent of the past, but with a known long term
average rate of hits per unit time. The Poisson distribution would let us find the probability of
getting some particular number of hits.
Now, instead of looking at the number of hits, we look at the random variable L (for Lifetime),
the time you have to wait for the first hit.
The probability that the waiting time is more than a given time value is
P(L>t)=P(no hits in time t)=0e0!=et (by the Poisson distribution, where =t).
P(Lt)=1et (the cumulative distribution function). We can get the density function by taking the
derivative of this:
f(x)={et0fort0fort<0
Any random variable that has a density function like this is said to be exponentially distributed.
The relation between the Poisson distribution and the exponential distribution is summarized by
the following proposition:
Proposition_ X (the number of occurrences of an event within a unit of time) has a Poisson
distribution with parameter if and only if the time elapsed between two successive occurrences
of the event has an exponential distribution with parameter and it is independent of previous
occurrences..
BINOMIAL ,POISSON AND NORMAL DISTRIBUTION.pptxletbestrong
BINOMIAL DISTRIBUTION
In probability theory and statistics, the binomial distribution is the discrete probability distribution gives only two possible results in an experiment, either Success or Failure. For example, if we toss a coin, there could be only two possible outcomes: heads or tails, and if any test is taken, then there could be only two results: pass or fail. This distribution is also called a binomial probability distribution.
Number of trials (n) is a fixed number.
The outcome of a given trial is either success or failure.
The probability of success (p) remains constant from trial to trial which means an experiment is conducted under homogeneous conditions.
The trials are independent which means the outcome of previous trial does not affect the outcome of the next trial.
Binomial Probability Distribution
In binomial probability distribution, the number of ‘Success’ in a sequence of n experiments, where each time a question is asked for yes-no, then the valued outcome is represented either with success/yes/true/one (probability p) or failure/no/false/zero (probability q = 1 − p). A single success/failure test is also called a Bernoulli trial or Bernoulli experiment, and a series of outcomes is called a Bernoulli process. For n = 1, i.e. a single experiment, the binomial distribution is a Bernoulli distribution.
There are two parameters n and p used here in a binomial distribution. The variable ‘n’ states the number of times the experiment runs and the variable ‘p’ tells the probability of any one outcome. Suppose a die is thrown randomly 10 times, then the probability of getting 2 for anyone throw is ⅙. When you throw the dice 10 times, you have a binomial distribution of n = 10 and p = ⅙.
The binomial distribution formula is for any random variable X, given by;
P(x:n,p) = nCx px (1-p)n-x
Where,
n = the number of experiments
x = 0, 1, 2, 3, 4, …
p = Probability of Success in a single experiment
q = Probability of Failure in a single experiment = 1 – p
The binomial distribution formula can also be written in the form of n-Bernoulli trials, where nCx = n!/x!(n-x)!. Hence,
P(x:n,p) = n!/[x!(n-x)!].px.(q)n-x
Binomial Distribution Mean and Variance
For a binomial distribution, the mean, variance and standard deviation for the given number of success are represented using the formulas
Mean, μ = np
Variance, σ2 = npq
Standard Deviation σ= √(npq)
Where p is the probability of success
q is the probability of failure, where q = 1-p
Properties of binomial distribution
The properties of the binomial distribution are:
• There are two possible outcomes: true or false, success or failure, yes or no.
• There is ‘n’ number of independent trials or a fixed number of n times repeated trials.
• The probability of success or failure remains the same for each trial.
• Only the number of success is calculated out of n independent trials.
• Every trial is an independent trial, which means the outcome of one trial does not affect the outcome
The PPT covered the distinguish between discrete and continuous distribution. Detailed explanation of the types of discrete distributions such as binomial distribution, Poisson distribution & Hyper-geometric distribution.
Model Attribute Check Company Auto PropertyCeline George
In Odoo, the multi-company feature allows you to manage multiple companies within a single Odoo database instance. Each company can have its own configurations while still sharing common resources such as products, customers, and suppliers.
The French Revolution, which began in 1789, was a period of radical social and political upheaval in France. It marked the decline of absolute monarchies, the rise of secular and democratic republics, and the eventual rise of Napoleon Bonaparte. This revolutionary period is crucial in understanding the transition from feudalism to modernity in Europe.
For more information, visit-www.vavaclasses.com
How to Make a Field invisible in Odoo 17Celine George
It is possible to hide or invisible some fields in odoo. Commonly using “invisible” attribute in the field definition to invisible the fields. This slide will show how to make a field invisible in odoo 17.
Instructions for Submissions thorugh G- Classroom.pptxJheel Barad
This presentation provides a briefing on how to upload submissions and documents in Google Classroom. It was prepared as part of an orientation for new Sainik School in-service teacher trainees. As a training officer, my goal is to ensure that you are comfortable and proficient with this essential tool for managing assignments and fostering student engagement.
How to Create Map Views in the Odoo 17 ERPCeline George
The map views are useful for providing a geographical representation of data. They allow users to visualize and analyze the data in a more intuitive manner.
Operation “Blue Star” is the only event in the history of Independent India where the state went into war with its own people. Even after about 40 years it is not clear if it was culmination of states anger over people of the region, a political game of power or start of dictatorial chapter in the democratic setup.
The people of Punjab felt alienated from main stream due to denial of their just demands during a long democratic struggle since independence. As it happen all over the word, it led to militant struggle with great loss of lives of military, police and civilian personnel. Killing of Indira Gandhi and massacre of innocent Sikhs in Delhi and other India cities was also associated with this movement.
We all have good and bad thoughts from time to time and situation to situation. We are bombarded daily with spiraling thoughts(both negative and positive) creating all-consuming feel , making us difficult to manage with associated suffering. Good thoughts are like our Mob Signal (Positive thought) amidst noise(negative thought) in the atmosphere. Negative thoughts like noise outweigh positive thoughts. These thoughts often create unwanted confusion, trouble, stress and frustration in our mind as well as chaos in our physical world. Negative thoughts are also known as “distorted thinking”.
How to Split Bills in the Odoo 17 POS ModuleCeline George
Bills have a main role in point of sale procedure. It will help to track sales, handling payments and giving receipts to customers. Bill splitting also has an important role in POS. For example, If some friends come together for dinner and if they want to divide the bill then it is possible by POS bill splitting. This slide will show how to split bills in odoo 17 POS.
Unit 8 - Information and Communication Technology (Paper I).pdfThiyagu K
This slides describes the basic concepts of ICT, basics of Email, Emerging Technology and Digital Initiatives in Education. This presentations aligns with the UGC Paper I syllabus.
Synthetic Fiber Construction in lab .pptxPavel ( NSTU)
Synthetic fiber production is a fascinating and complex field that blends chemistry, engineering, and environmental science. By understanding these aspects, students can gain a comprehensive view of synthetic fiber production, its impact on society and the environment, and the potential for future innovations. Synthetic fibers play a crucial role in modern society, impacting various aspects of daily life, industry, and the environment. ynthetic fibers are integral to modern life, offering a range of benefits from cost-effectiveness and versatility to innovative applications and performance characteristics. While they pose environmental challenges, ongoing research and development aim to create more sustainable and eco-friendly alternatives. Understanding the importance of synthetic fibers helps in appreciating their role in the economy, industry, and daily life, while also emphasizing the need for sustainable practices and innovation.
Students, digital devices and success - Andreas Schleicher - 27 May 2024..pptxEduSkills OECD
Andreas Schleicher presents at the OECD webinar ‘Digital devices in schools: detrimental distraction or secret to success?’ on 27 May 2024. The presentation was based on findings from PISA 2022 results and the webinar helped launch the PISA in Focus ‘Managing screen time: How to protect and equip students against distraction’ https://www.oecd-ilibrary.org/education/managing-screen-time_7c225af4-en and the OECD Education Policy Perspective ‘Students, digital devices and success’ can be found here - https://oe.cd/il/5yV
The Roman Empire A Historical Colossus.pdfkaushalkr1407
The Roman Empire, a vast and enduring power, stands as one of history's most remarkable civilizations, leaving an indelible imprint on the world. It emerged from the Roman Republic, transitioning into an imperial powerhouse under the leadership of Augustus Caesar in 27 BCE. This transformation marked the beginning of an era defined by unprecedented territorial expansion, architectural marvels, and profound cultural influence.
The empire's roots lie in the city of Rome, founded, according to legend, by Romulus in 753 BCE. Over centuries, Rome evolved from a small settlement to a formidable republic, characterized by a complex political system with elected officials and checks on power. However, internal strife, class conflicts, and military ambitions paved the way for the end of the Republic. Julius Caesar’s dictatorship and subsequent assassination in 44 BCE created a power vacuum, leading to a civil war. Octavian, later Augustus, emerged victorious, heralding the Roman Empire’s birth.
Under Augustus, the empire experienced the Pax Romana, a 200-year period of relative peace and stability. Augustus reformed the military, established efficient administrative systems, and initiated grand construction projects. The empire's borders expanded, encompassing territories from Britain to Egypt and from Spain to the Euphrates. Roman legions, renowned for their discipline and engineering prowess, secured and maintained these vast territories, building roads, fortifications, and cities that facilitated control and integration.
The Roman Empire’s society was hierarchical, with a rigid class system. At the top were the patricians, wealthy elites who held significant political power. Below them were the plebeians, free citizens with limited political influence, and the vast numbers of slaves who formed the backbone of the economy. The family unit was central, governed by the paterfamilias, the male head who held absolute authority.
Culturally, the Romans were eclectic, absorbing and adapting elements from the civilizations they encountered, particularly the Greeks. Roman art, literature, and philosophy reflected this synthesis, creating a rich cultural tapestry. Latin, the Roman language, became the lingua franca of the Western world, influencing numerous modern languages.
Roman architecture and engineering achievements were monumental. They perfected the arch, vault, and dome, constructing enduring structures like the Colosseum, Pantheon, and aqueducts. These engineering marvels not only showcased Roman ingenuity but also served practical purposes, from public entertainment to water supply.
3. A discrete Probability Distribution
Derived by French mathematician Simeon Denis
Poisson in 1837
Defined by the mean number of occurrences in a
time interval and denoted by λ
Also known as the Distribution of Rare Events
Poisson Distribution
Simeon D. Poisson (1781-
1840)
4. Works when binomial calculation becomes impractical (No. of
trials>probability of success),
Applied where random events in space or time are expected to occur.
Deviation indicates some degree of non-randomness in the events
Example: Number of earthquakes per year.
Cont’d…
5. Requirements for a Poisson Distribution
RIPS
Random
Proportional
Simultaneous
Independent
6. Assumptions
The probability of occurrence of an event is constant for
all subintervals:
There can be no more than one occurrence in each
interval
Occurrence are independent .
8. Mathematical Calculations
#If the average number of accidents at a particular intersection in
every year is 18. Then-
(a) Calculate the probability that there are exactly 2 accidents
occurred in this month.
(b) Calculate the probability that there is at least one accident
occurred in this month.
9. There are 12 months in a year, so = 12
18
= 1.5 accidents per month
P(X = 3) =
!x
e x
!2
5.1 25.1
e
= 0.2510
(a) Calculate the probability that there are exactly 2
accidents occurred in this month.
10. (b) Calculate the probability that there is at least one
accident occurred in this month.
P(X ≥ 1 ) = P(X=1) + P(X=2) + P(X=3) + …. Infinite.
So… Take the complement: P(X=0)
!x
e x
!0
5.1 05.1
e
5.1
e
= 0.223130…