Download to read offline

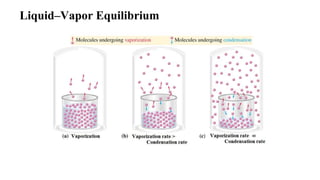

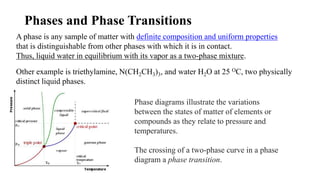

1. A phase is any uniform sample of matter that is distinct from other phases in contact, such as liquid water in equilibrium with its vapor. 2. Phase diagrams illustrate the relationship between states of matter under varying temperatures and pressures. Crossing a two-phase curve represents a phase transition. 3. Common phase transitions include melting, freezing, boiling, condensation, sublimation, and deposition which are defined by the direction of heat transfer and changes in density.