Download to read offline
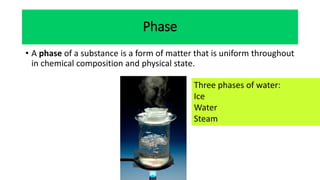
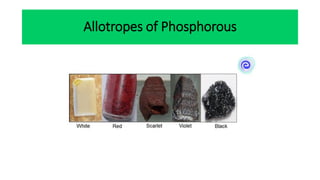
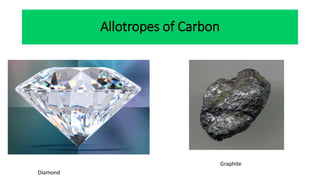
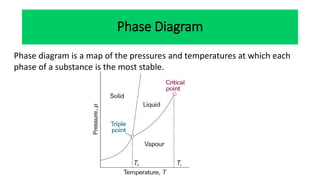
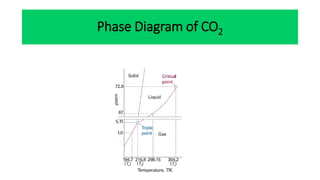
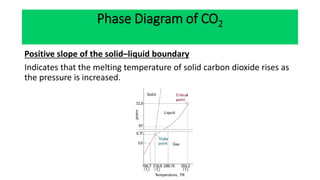
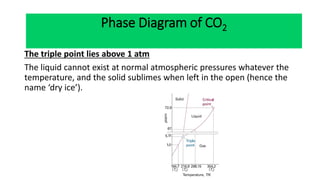
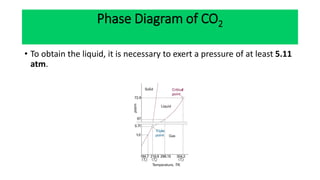
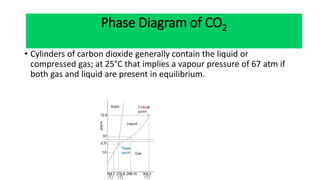


The document discusses the concept of phase diagrams and phase transitions, explaining phases of substances, such as water and carbon. It details how phase boundaries indicate stable regions of temperature and pressure, including critical points, boiling points, and triple points where three phases coexist. Additionally, it highlights metastable phases that can persist due to kinetic hindrances, with a specific focus on the phase diagram of carbon dioxide.