Downloaded 130 times

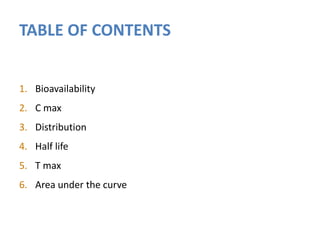

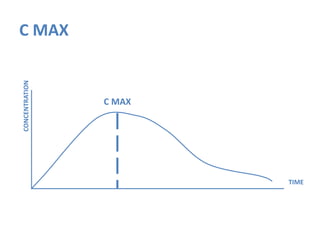
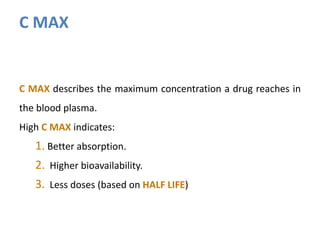


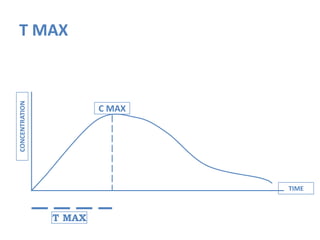
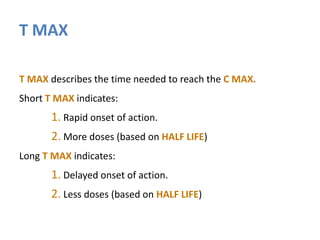
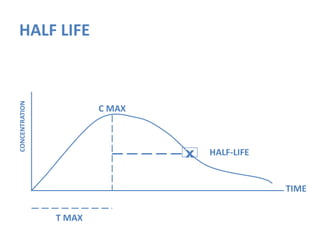


This document provides an overview of key pharmacokinetic concepts including bioavailability, Cmax, distribution, half-life, Tmax, and area under the curve (AUC). Bioavailability describes the amount of drug that reaches systemic circulation. Cmax is the maximum drug concentration in blood plasma. Distribution describes drugs binding to plasma proteins. Half-life is the time for drug concentration to reduce by half. Tmax is the time to reach Cmax. AUC represents total drug absorption over time.


![Bio pharmaceutical classification System [BCS]](https://cdn.slidesharecdn.com/ss_thumbnails/biopharmaceuticalclassificationystembcs-160328061345-thumbnail.jpg?width=640&height=640&fit=bounds)