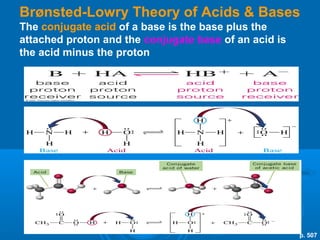
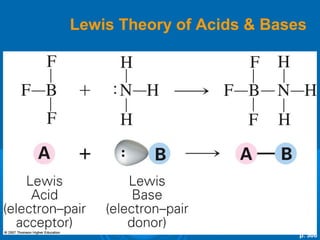
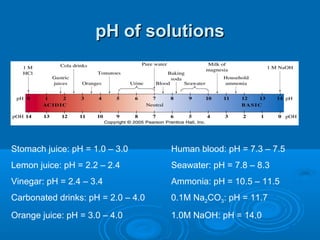
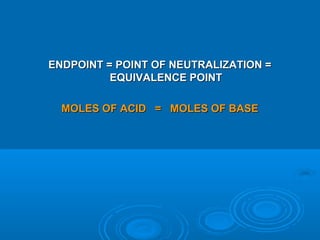
The document details the principles of titration, including types of titrations such as precipitation, acid-base, complexation, and redox reactions, emphasizing the importance of accurate measurements and standardization. It also discusses methods for determining the equivalence point, endpoint detection technologies, and the necessary properties for indicators and standards used in titrations. Additionally, it addresses potential errors in titration methods and best practices for using volumetric apparatus.

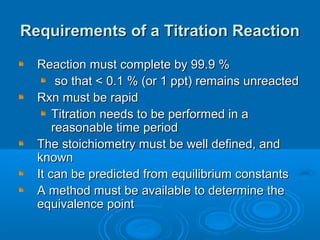
![pH calculation
Q1: Calculate the pH of a solution if [H+] = 2.7 x 10⁻⁴ M
pH = -log[H+] pH = -log(2.7 x 10⁻⁴) = 3.57
Q2: Find the hydrogen ion concentration of a solution if its
pH is 11.62.
[H+] = 10-pH [H+] = 10-11.62 = 2.4 x 10⁻¹²M
Q3: Find the pOH and the pH of a solution if its hydroxide
ion concentration is 7.9 x 10⁻⁵M
pOH = -log[OH-] pOH = -log(7.9 x 10⁻⁵) = 4.10
pH + pOH = 14 pH = 14 - 4.10 pH = 9.9](https://image.slidesharecdn.com/titrationppt-121029043930-phpapp02/85/Titration-ppt-11-320.jpg)
![A solution with a pH of 1 has [H+] of 0.1 mol/L or 10-1
A solution with a pH of 3 has [H+] of 0.001 mol/L or 10-3](https://image.slidesharecdn.com/titrationppt-121029043930-phpapp02/85/Titration-ppt-12-320.jpg)
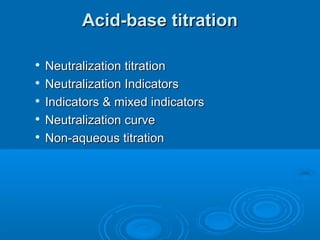
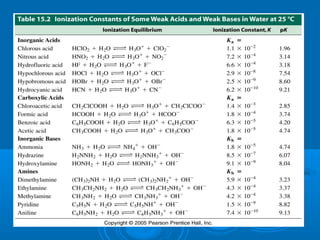
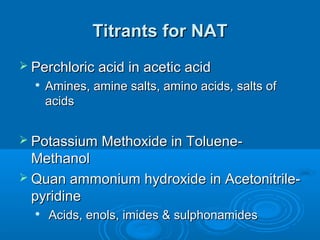
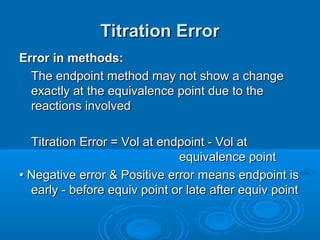
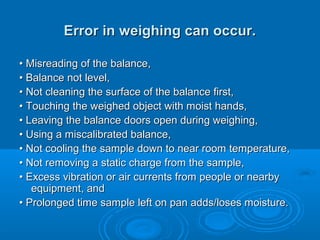
![Ka and Kb
The equilibrium constant for a Brønsted acid is
represented by Ka, and base is represented by Kb.
CH3COOH(aq) + H2O(l) H3O+(aq) + CH3COO–(aq)
[H3O+][CH3COO–]
Notice that H2O is not Ka = –––––––––––––––––
included in either [CH3COOH]
equilibrium expression.
NH3(aq) + H2O(l) NH4+(aq) + OH–(aq)
[NH4+][OH–]
Kb = –––––––––––––
pH of 1M AcoH =2.4 [NH3]](https://image.slidesharecdn.com/titrationppt-121029043930-phpapp02/85/Titration-ppt-15-320.jpg)
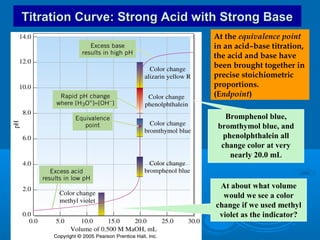
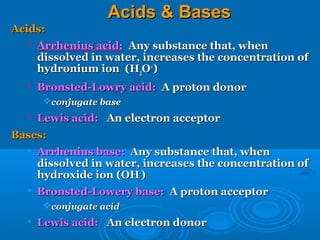
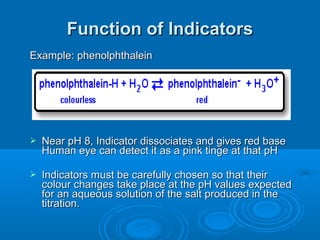
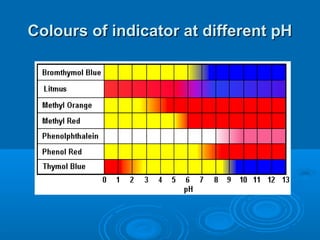
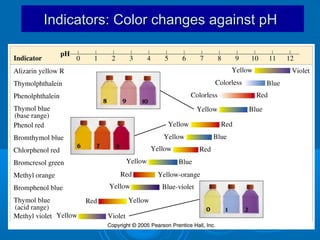
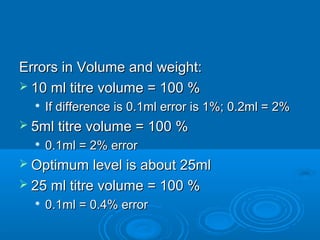
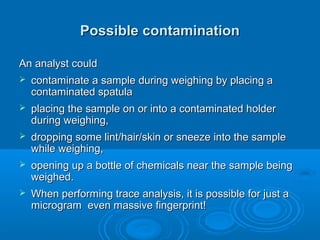
![Acid–Base Indicators
An acid–base indicator is a weak acid or
base.
The acid form (HA) of the indicator has one
color, the conjugate base (A–) has a different
color. One of the “colors” may be colorless.
In an acidic solution, [H3O+] is high. Because
H3O+ is a common ion, it suppresses the
ionization of the indicator acid, and we see
the color of HA.
In a basic solution, [OH–] is high, and it reacts
with HA, forming the color of A–.](https://image.slidesharecdn.com/titrationppt-121029043930-phpapp02/85/Titration-ppt-22-320.jpg)
![An Equation for Buffer
Solutions
In certain applications, there is a need to repeat the
calculations of the pH of buffer solutions many times.
This can be done with a single, simple equation, but
there are some limitations.
The Henderson–Hasselbalch equation:
[conjugate base]
pH = pKa + log ––––––––––––––
[weak acid]
• To use this equation, the ratio [conjugate base]/[weak acid]
must have a value between 0.10–10 and both concentrations
must exceed Ka by a factor of 100 or more.](https://image.slidesharecdn.com/titrationppt-121029043930-phpapp02/85/Titration-ppt-46-320.jpg)
![The Common Ion Effect
Consider a solution of acetic acid.
If we add acetate ion as a second solute (i.e., sodium
acetate), the pH of the solution increases:
LeChâtelier’s principle: What
happens to [H3O+] when the
equilibrium shifts to the left?](https://image.slidesharecdn.com/titrationppt-121029043930-phpapp02/85/Titration-ppt-47-320.jpg)