Downloaded 154 times


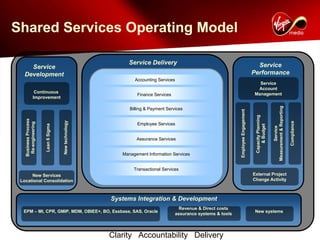
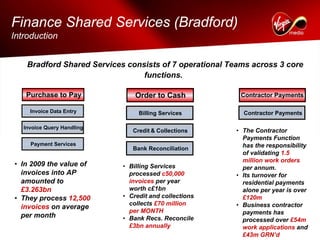
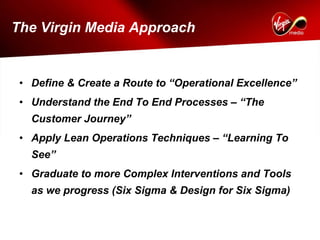
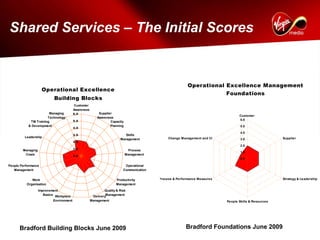
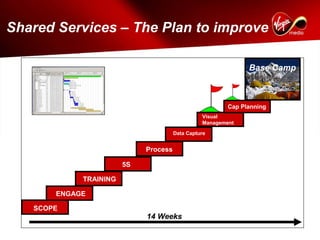
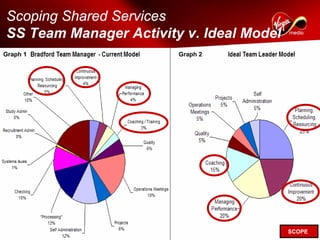


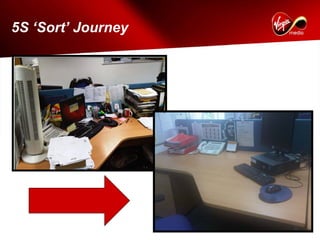
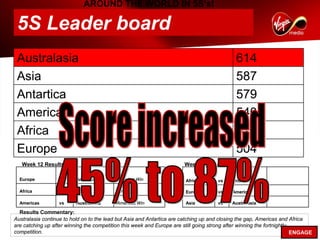
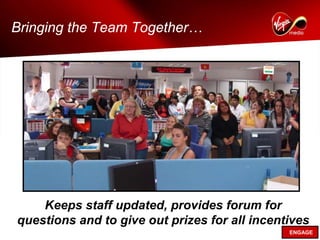
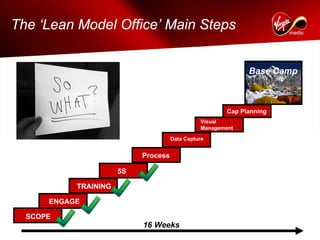
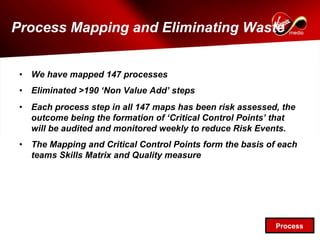
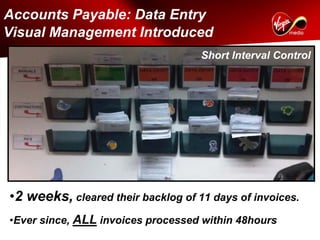
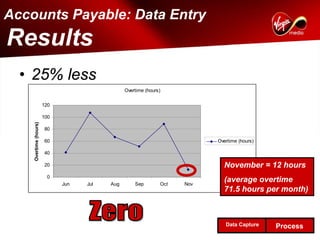
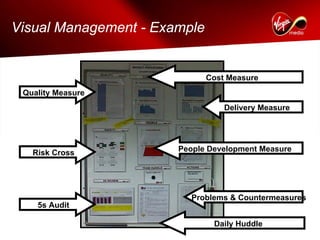
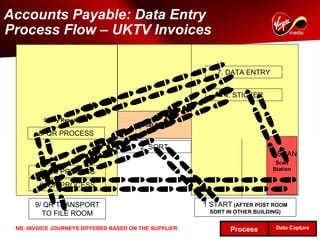
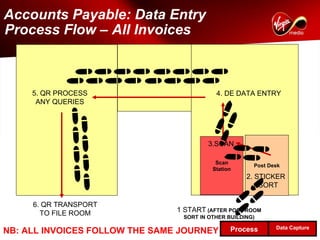
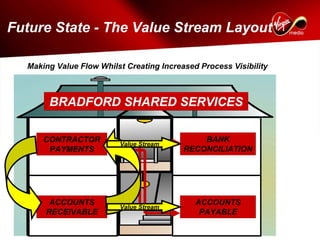
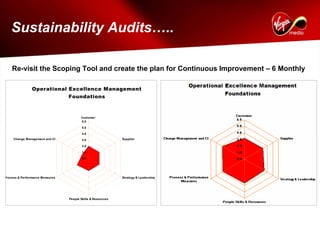
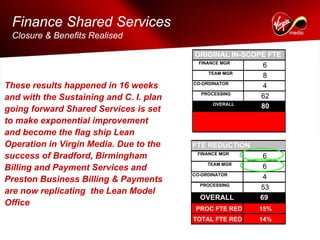


Virgin Media's Shared Services department implemented an operational excellence program over 16 weeks to improve processes and reduce waste. Key activities included scoping current performance, engaging staff, providing Lean training, implementing 5S practices, mapping over 147 processes to identify waste, and establishing visual management systems. These changes reduced processing times, eliminated over 190 non-value added steps, and reduced the workforce by 14% while improving quality. The program established a foundation for continuous improvement through sustaining audits and a Lean coaching role.


![Ams Webinar 25 March 2010 Jf Final[1]](https://cdn.slidesharecdn.com/ss_thumbnails/amswebinar25march2010jffinal1-12695451499652-phpapp02-thumbnail.jpg?width=640&height=640&fit=bounds)