Downloaded 37 times


The document outlines Deutsche Post DHL's financial indicators from 2011, highlighting their extensive global operations and employee statistics. It discusses the establishment of a global business services division to enhance efficiency in procurement processes and achieve cost reductions. The text emphasizes the importance of standardized procedures, technology integration, and performance tracking through KPIs for successful shared services purchasing organization.
Jerker Gunnarsson introduces himself and the presentation date, setting context for the discussion.
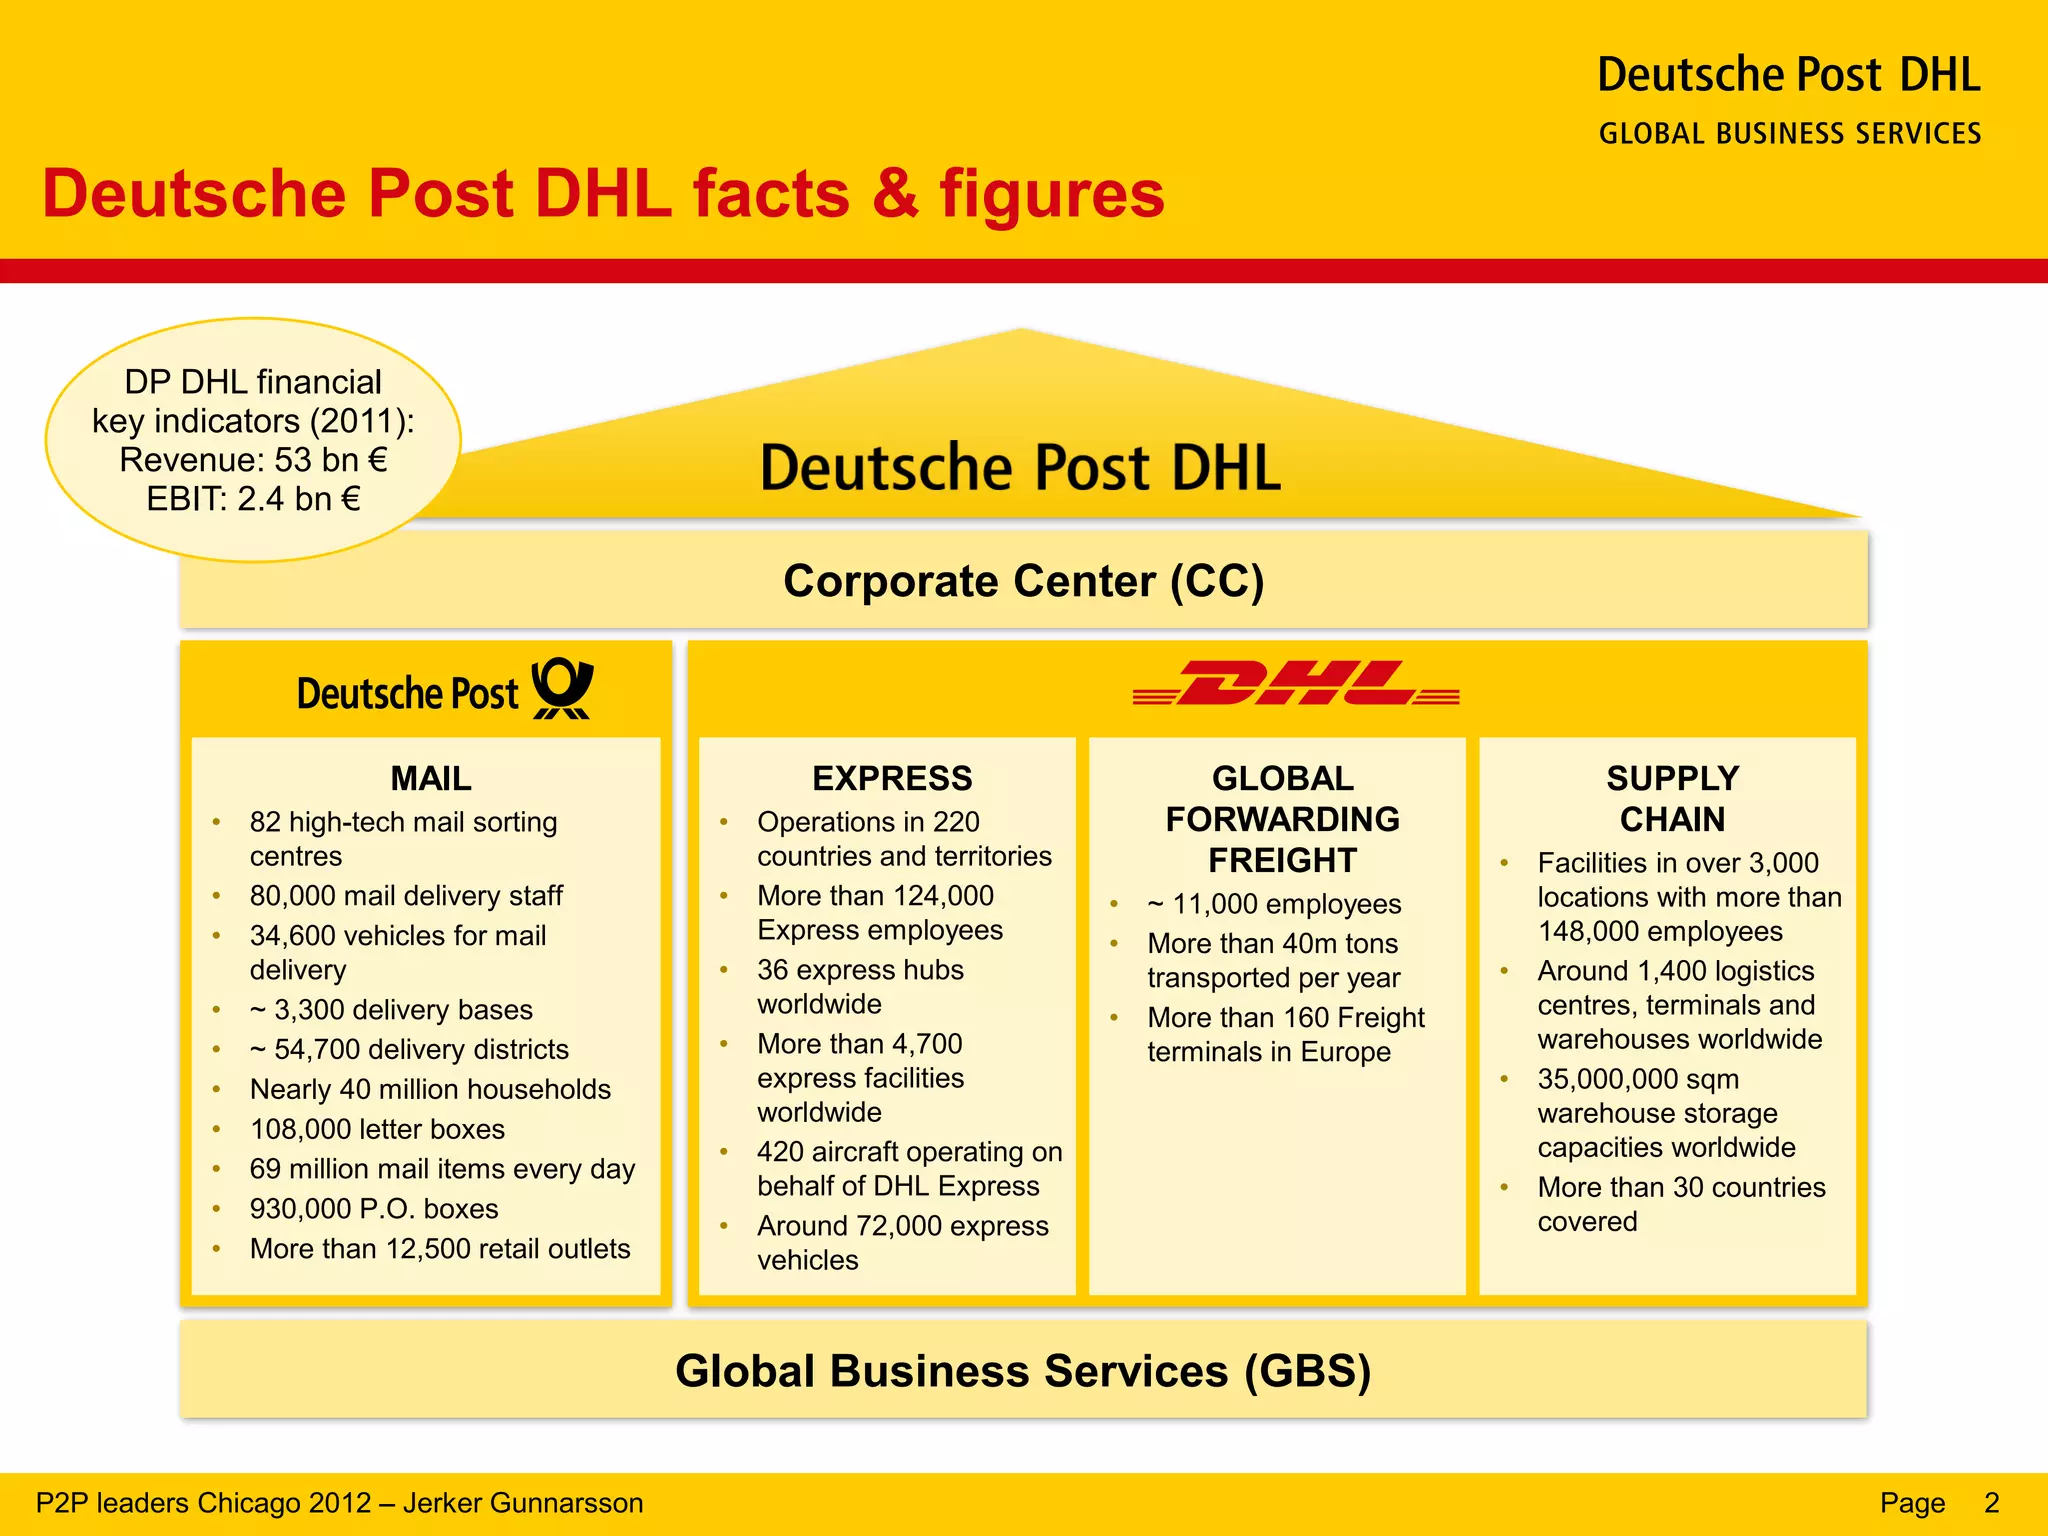
Key facts about Deutsche Post DHL including revenue, EBIT, global operations, and workforce statistics.
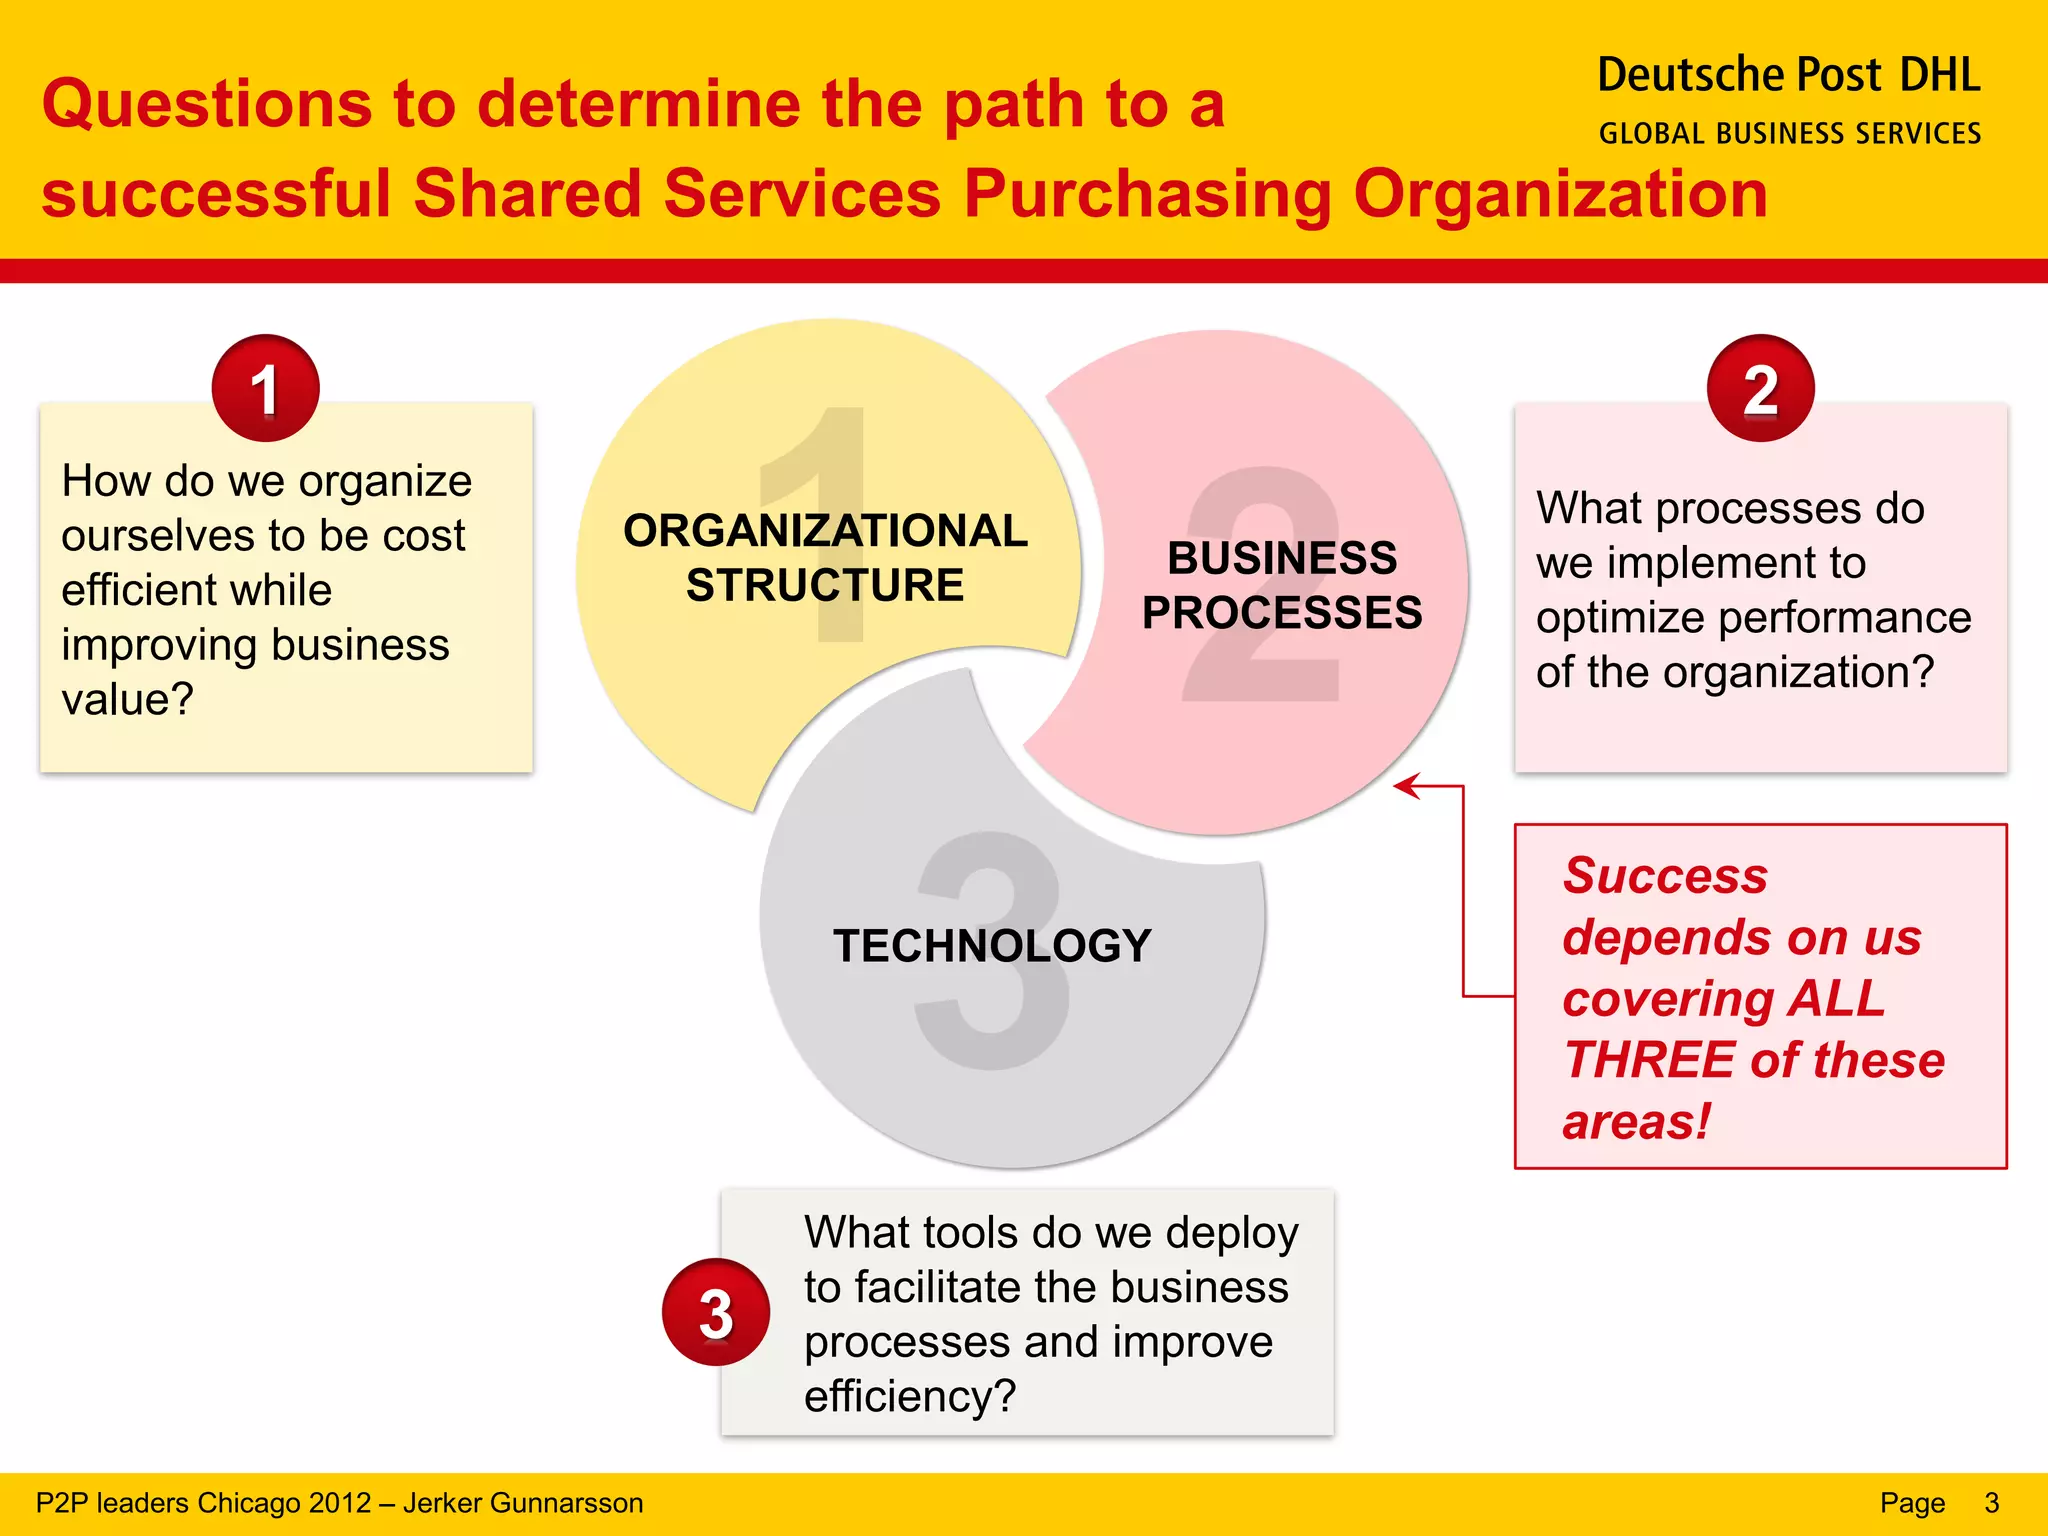
Critical questions for establishing an effective Shared Services Purchasing Organization to optimize costs and performance.
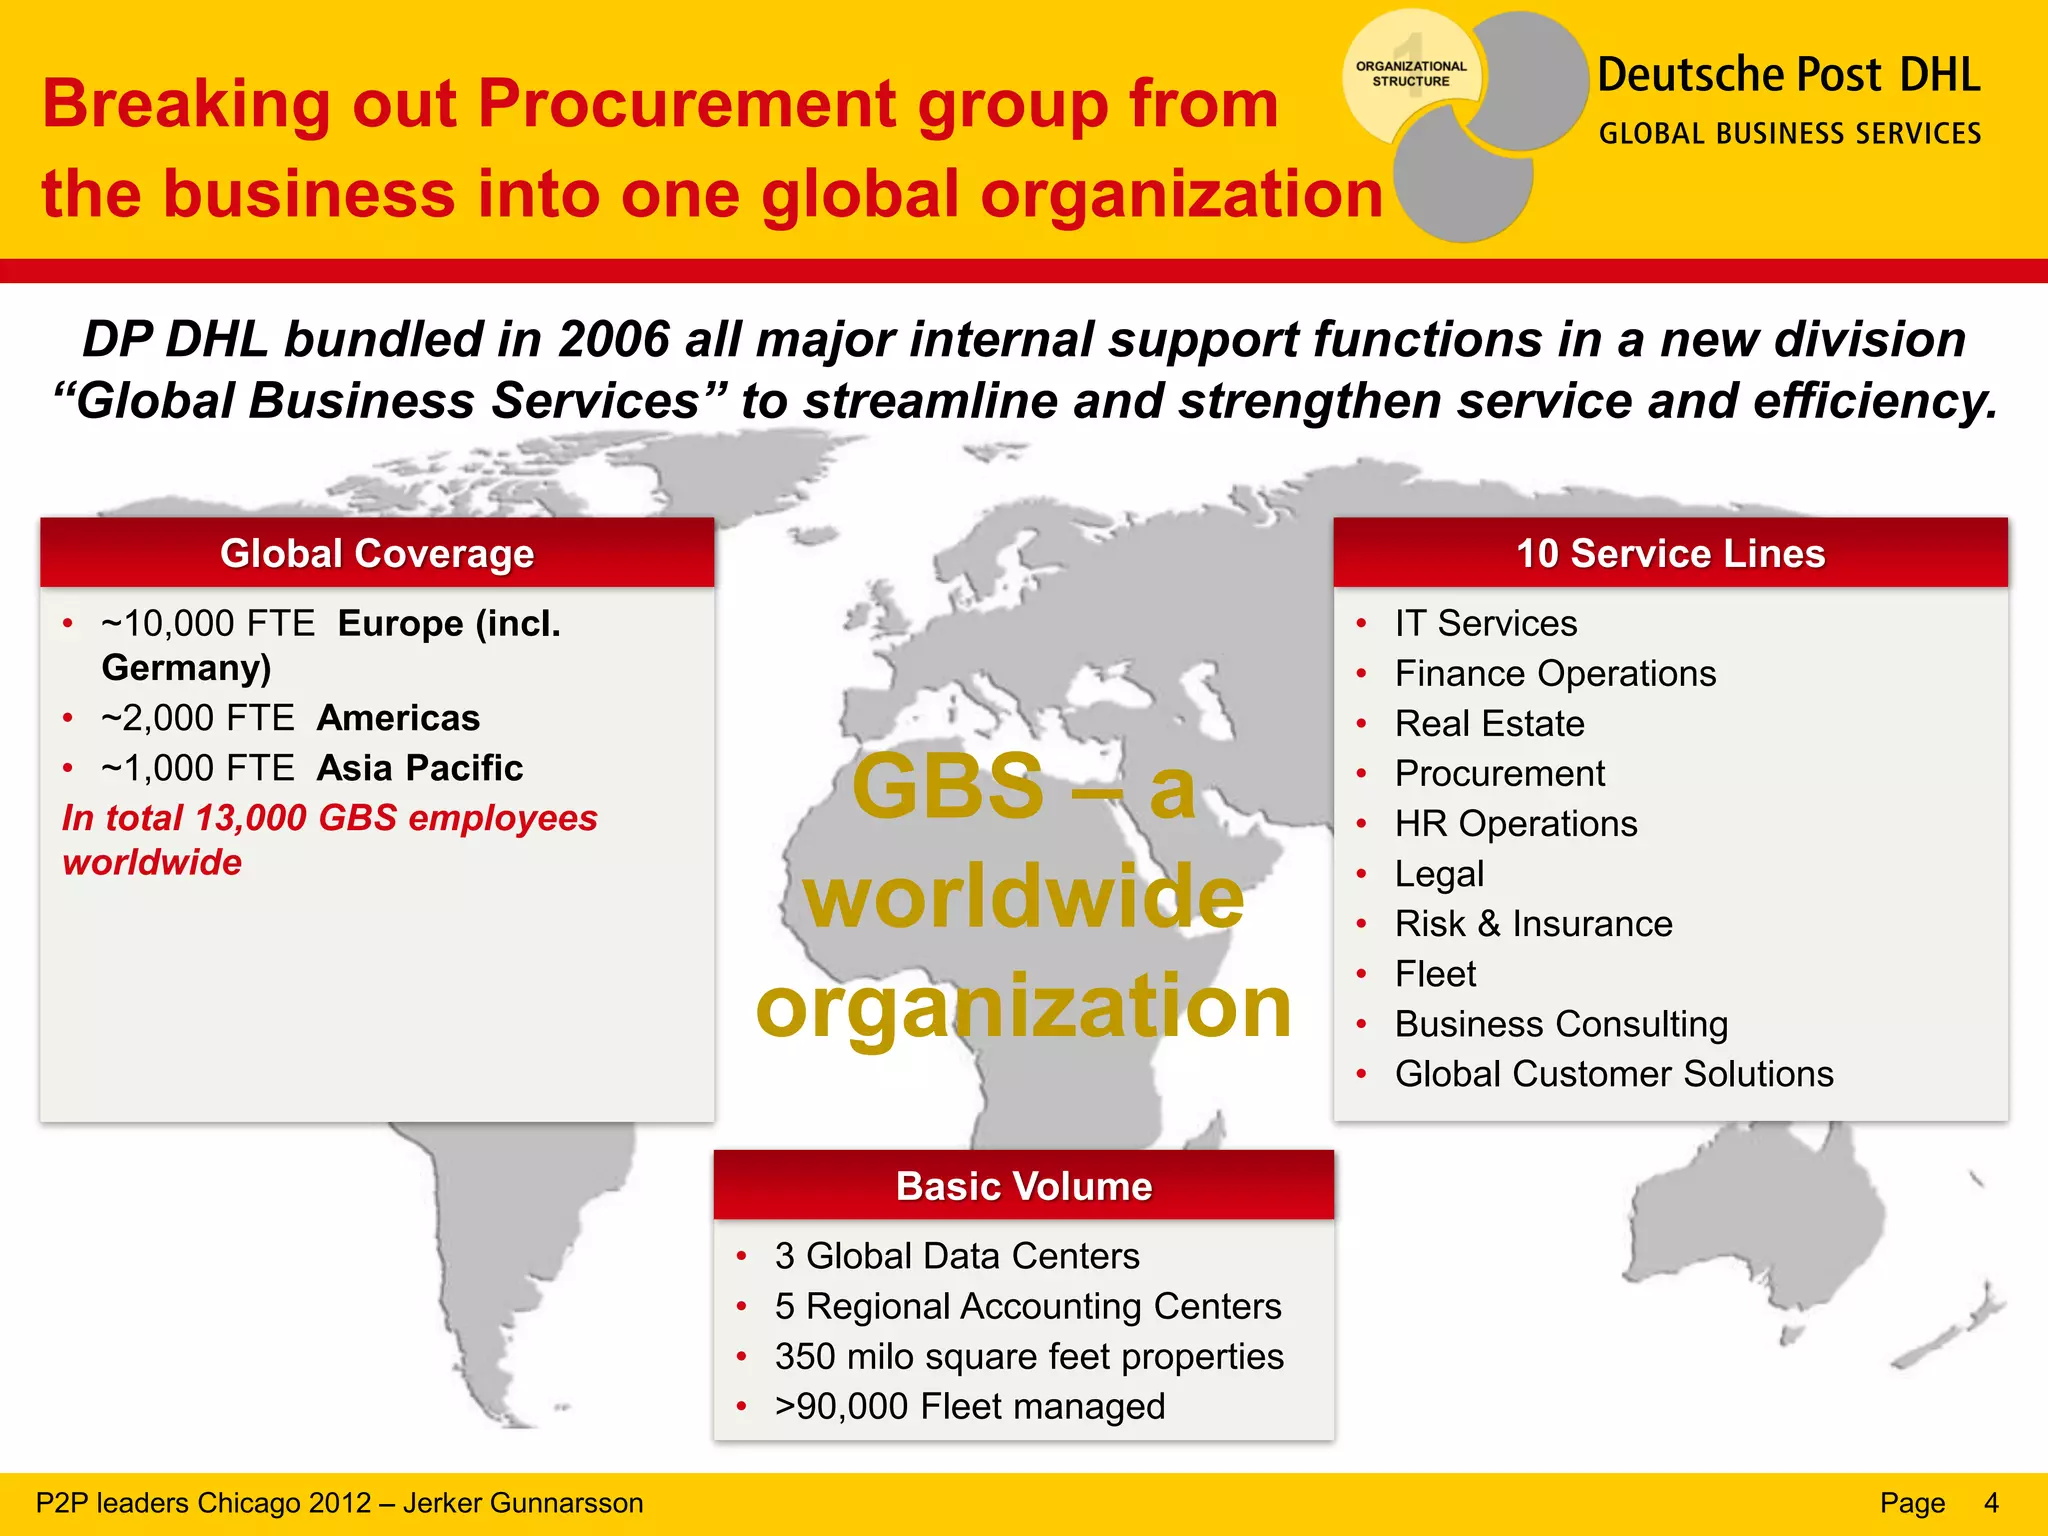
Overview of DP DHL's Global Business Services launched in 2006, detailing employee distribution and service lines.
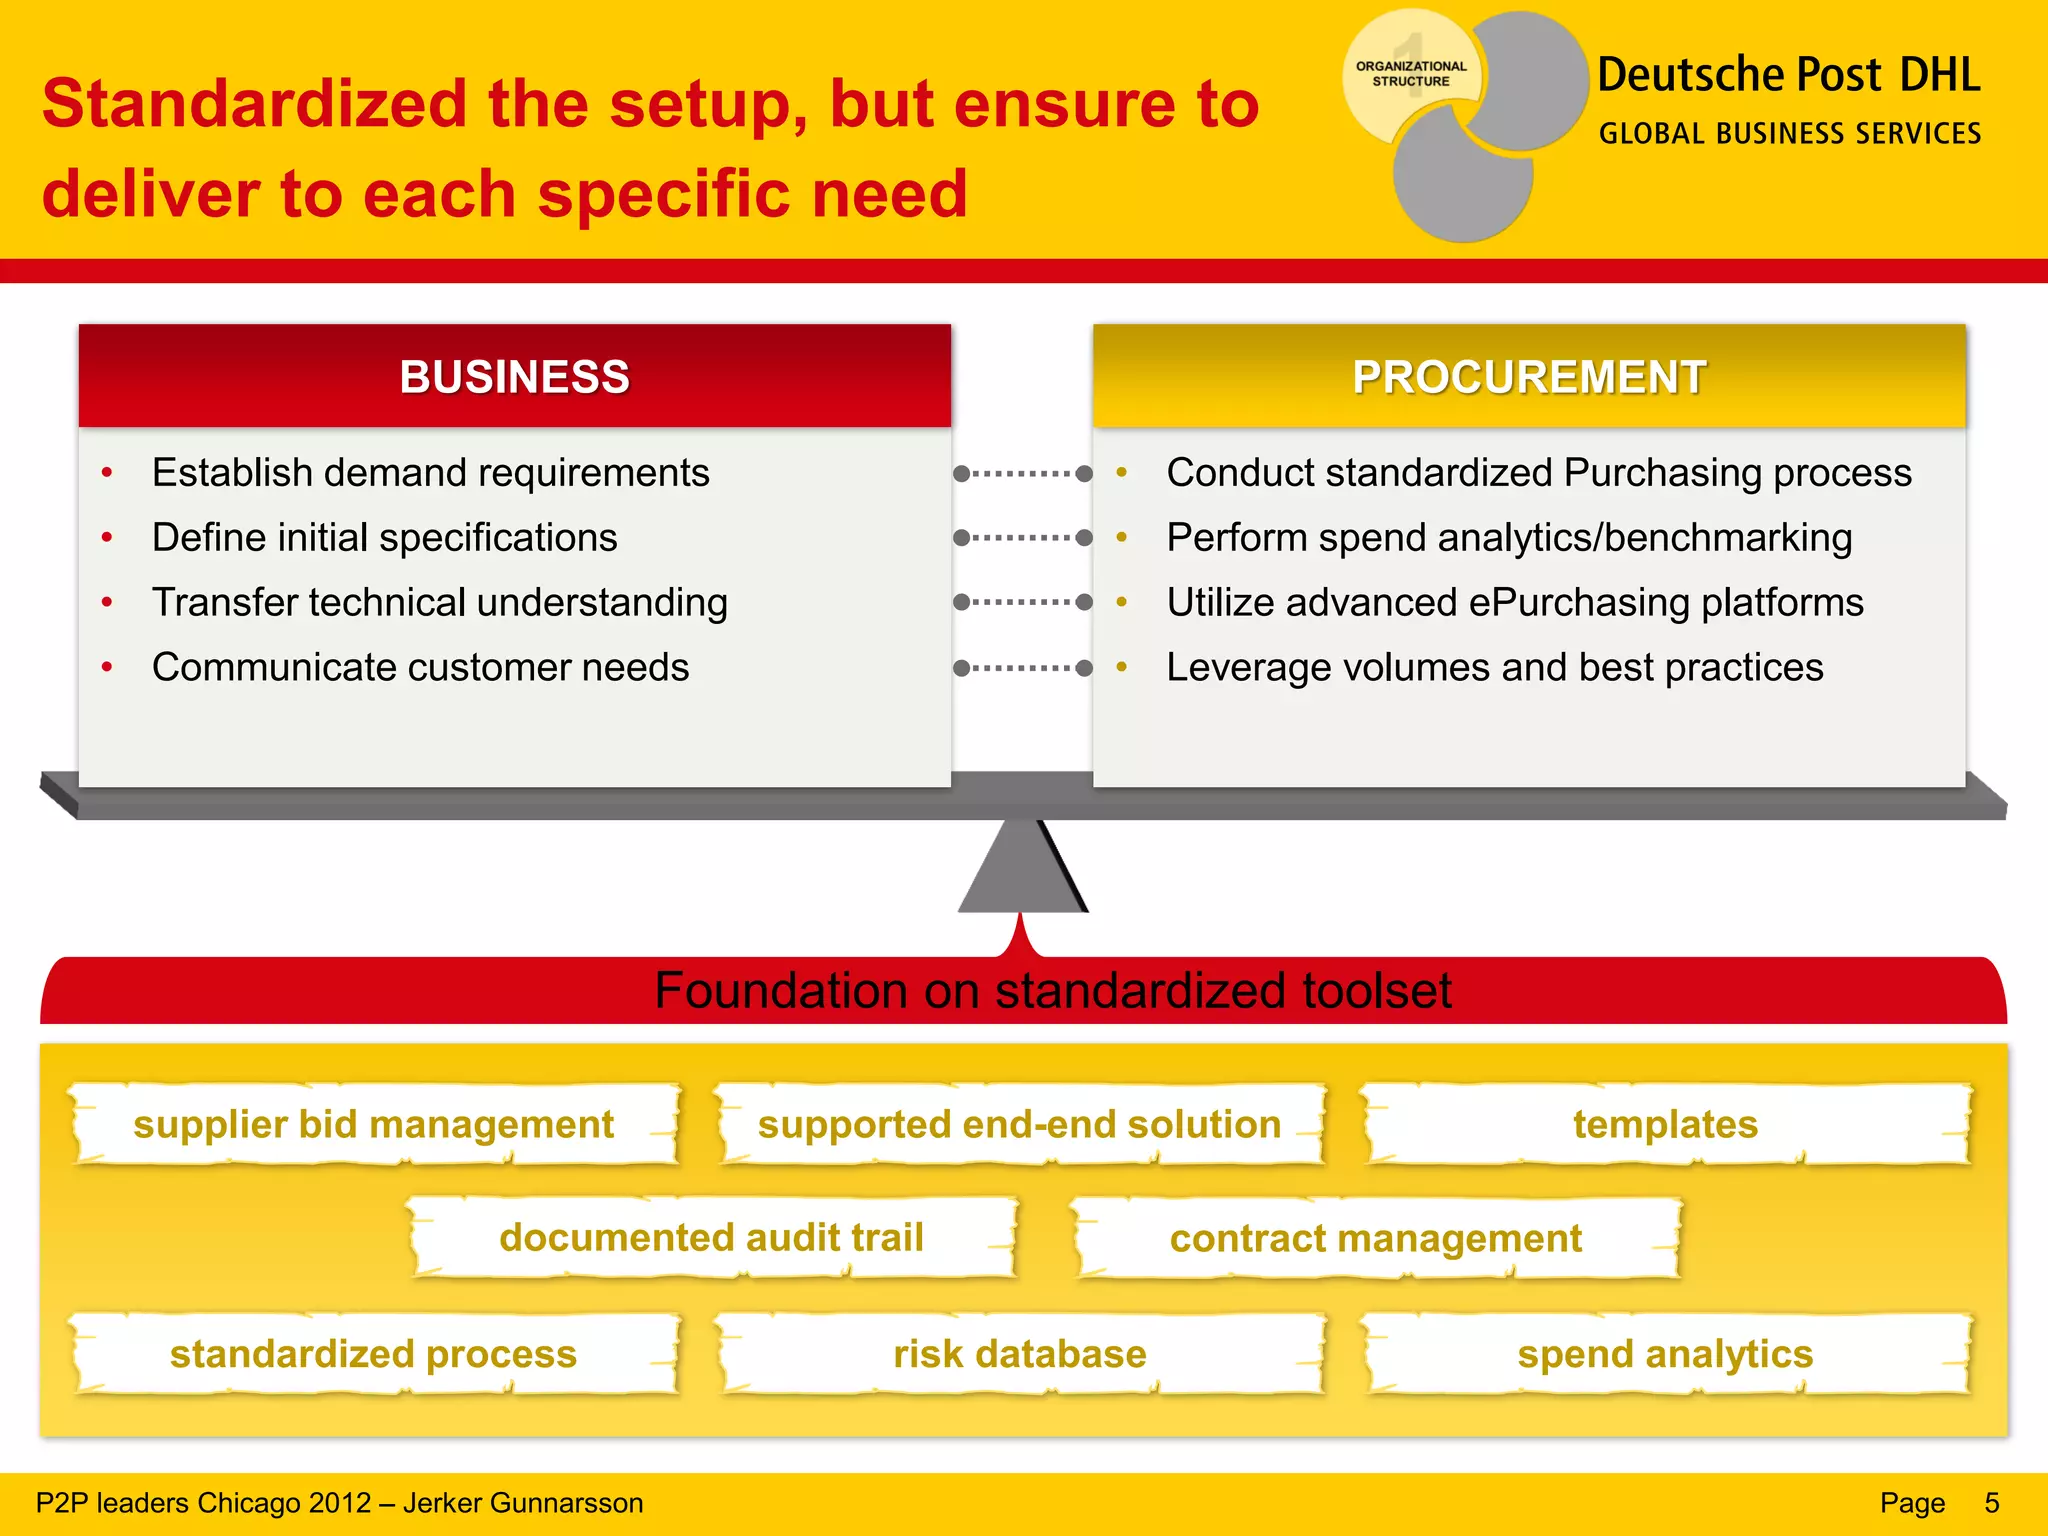
Discusses standardizing procurement requirements and processes to enhance efficiency and communication.
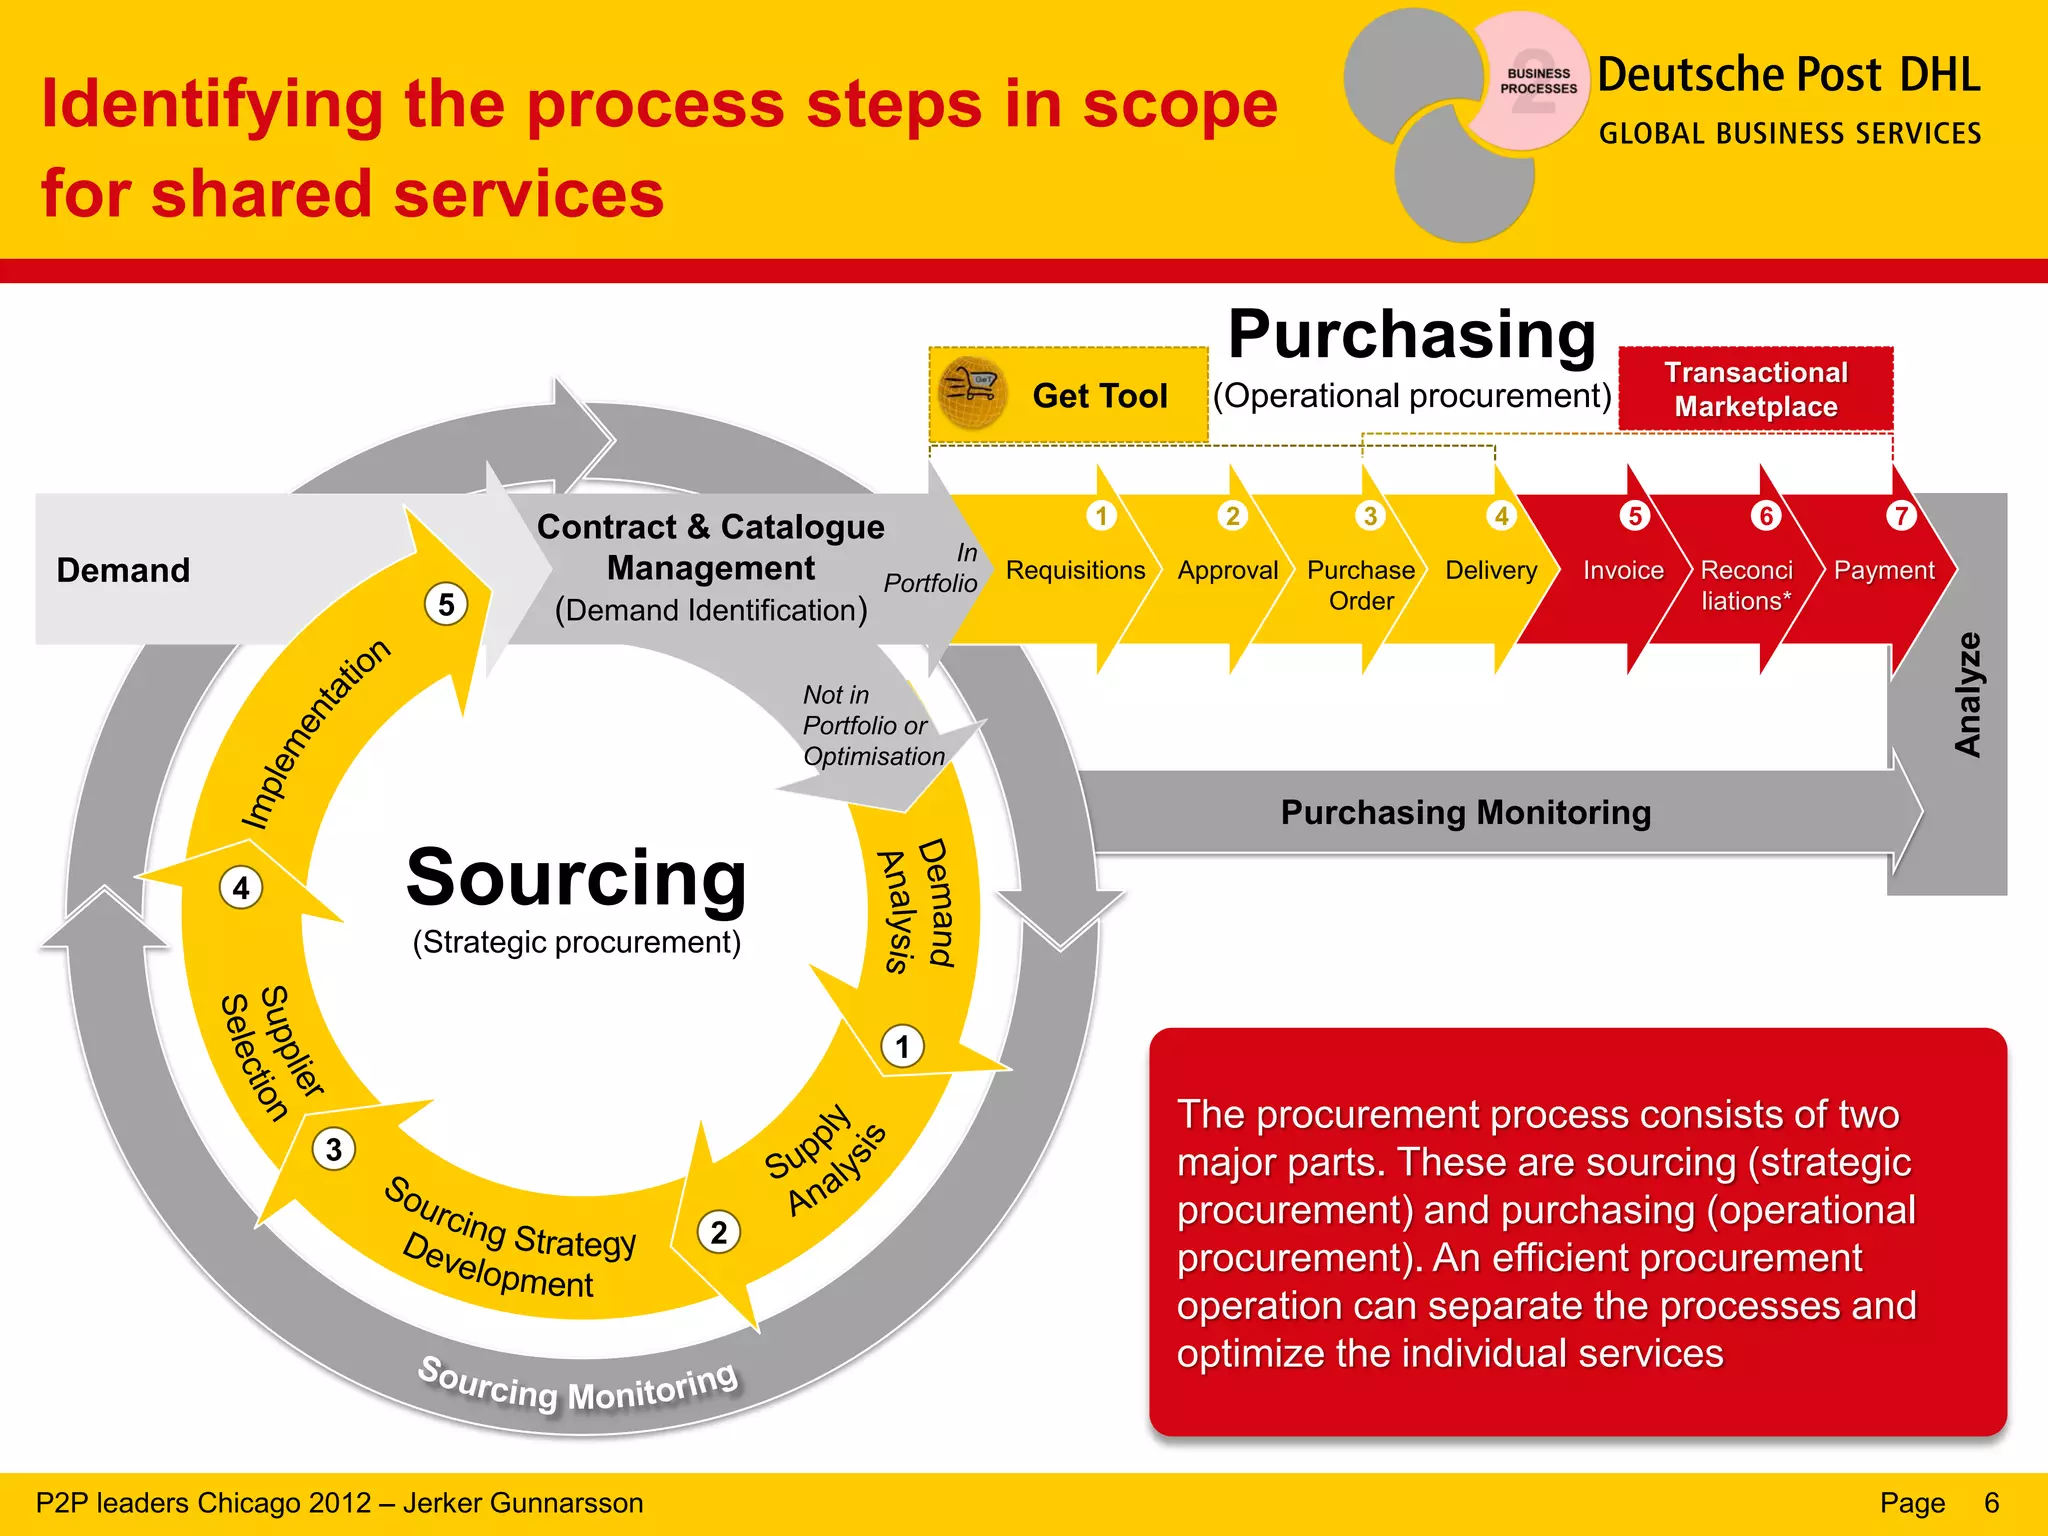
Details the two major parts of procurement: strategic sourcing and operational purchasing, and their interrelationship.
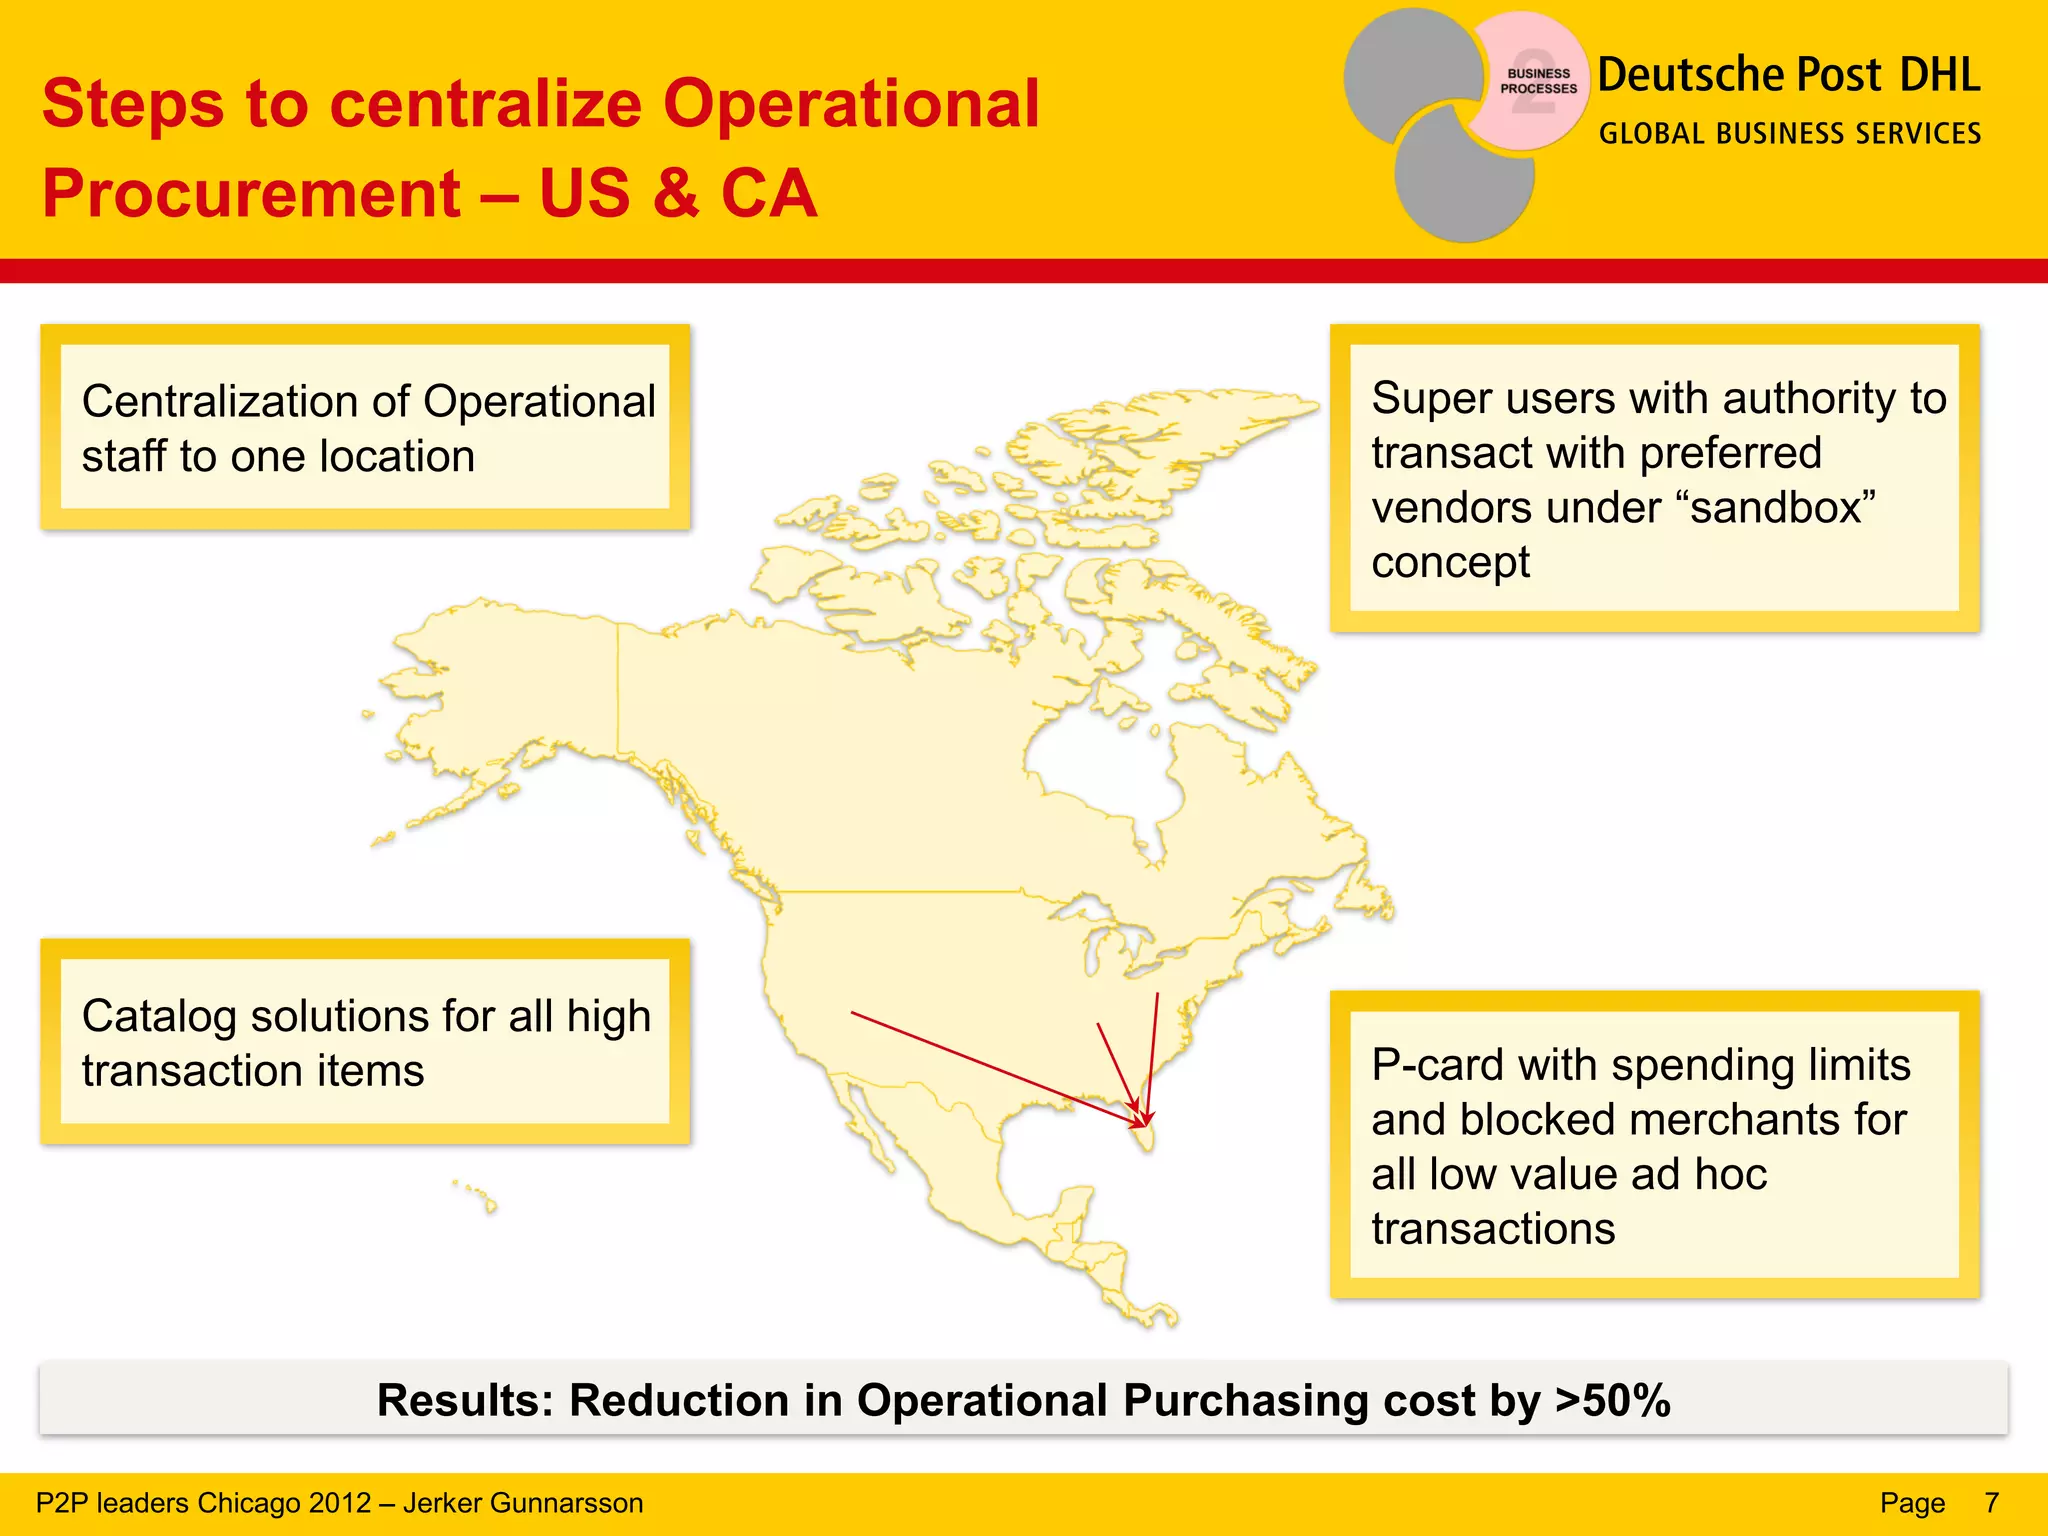
Plan to centralize operational procurement functions, showcasing benefits like cost reduction and streamlined vendor transactions.
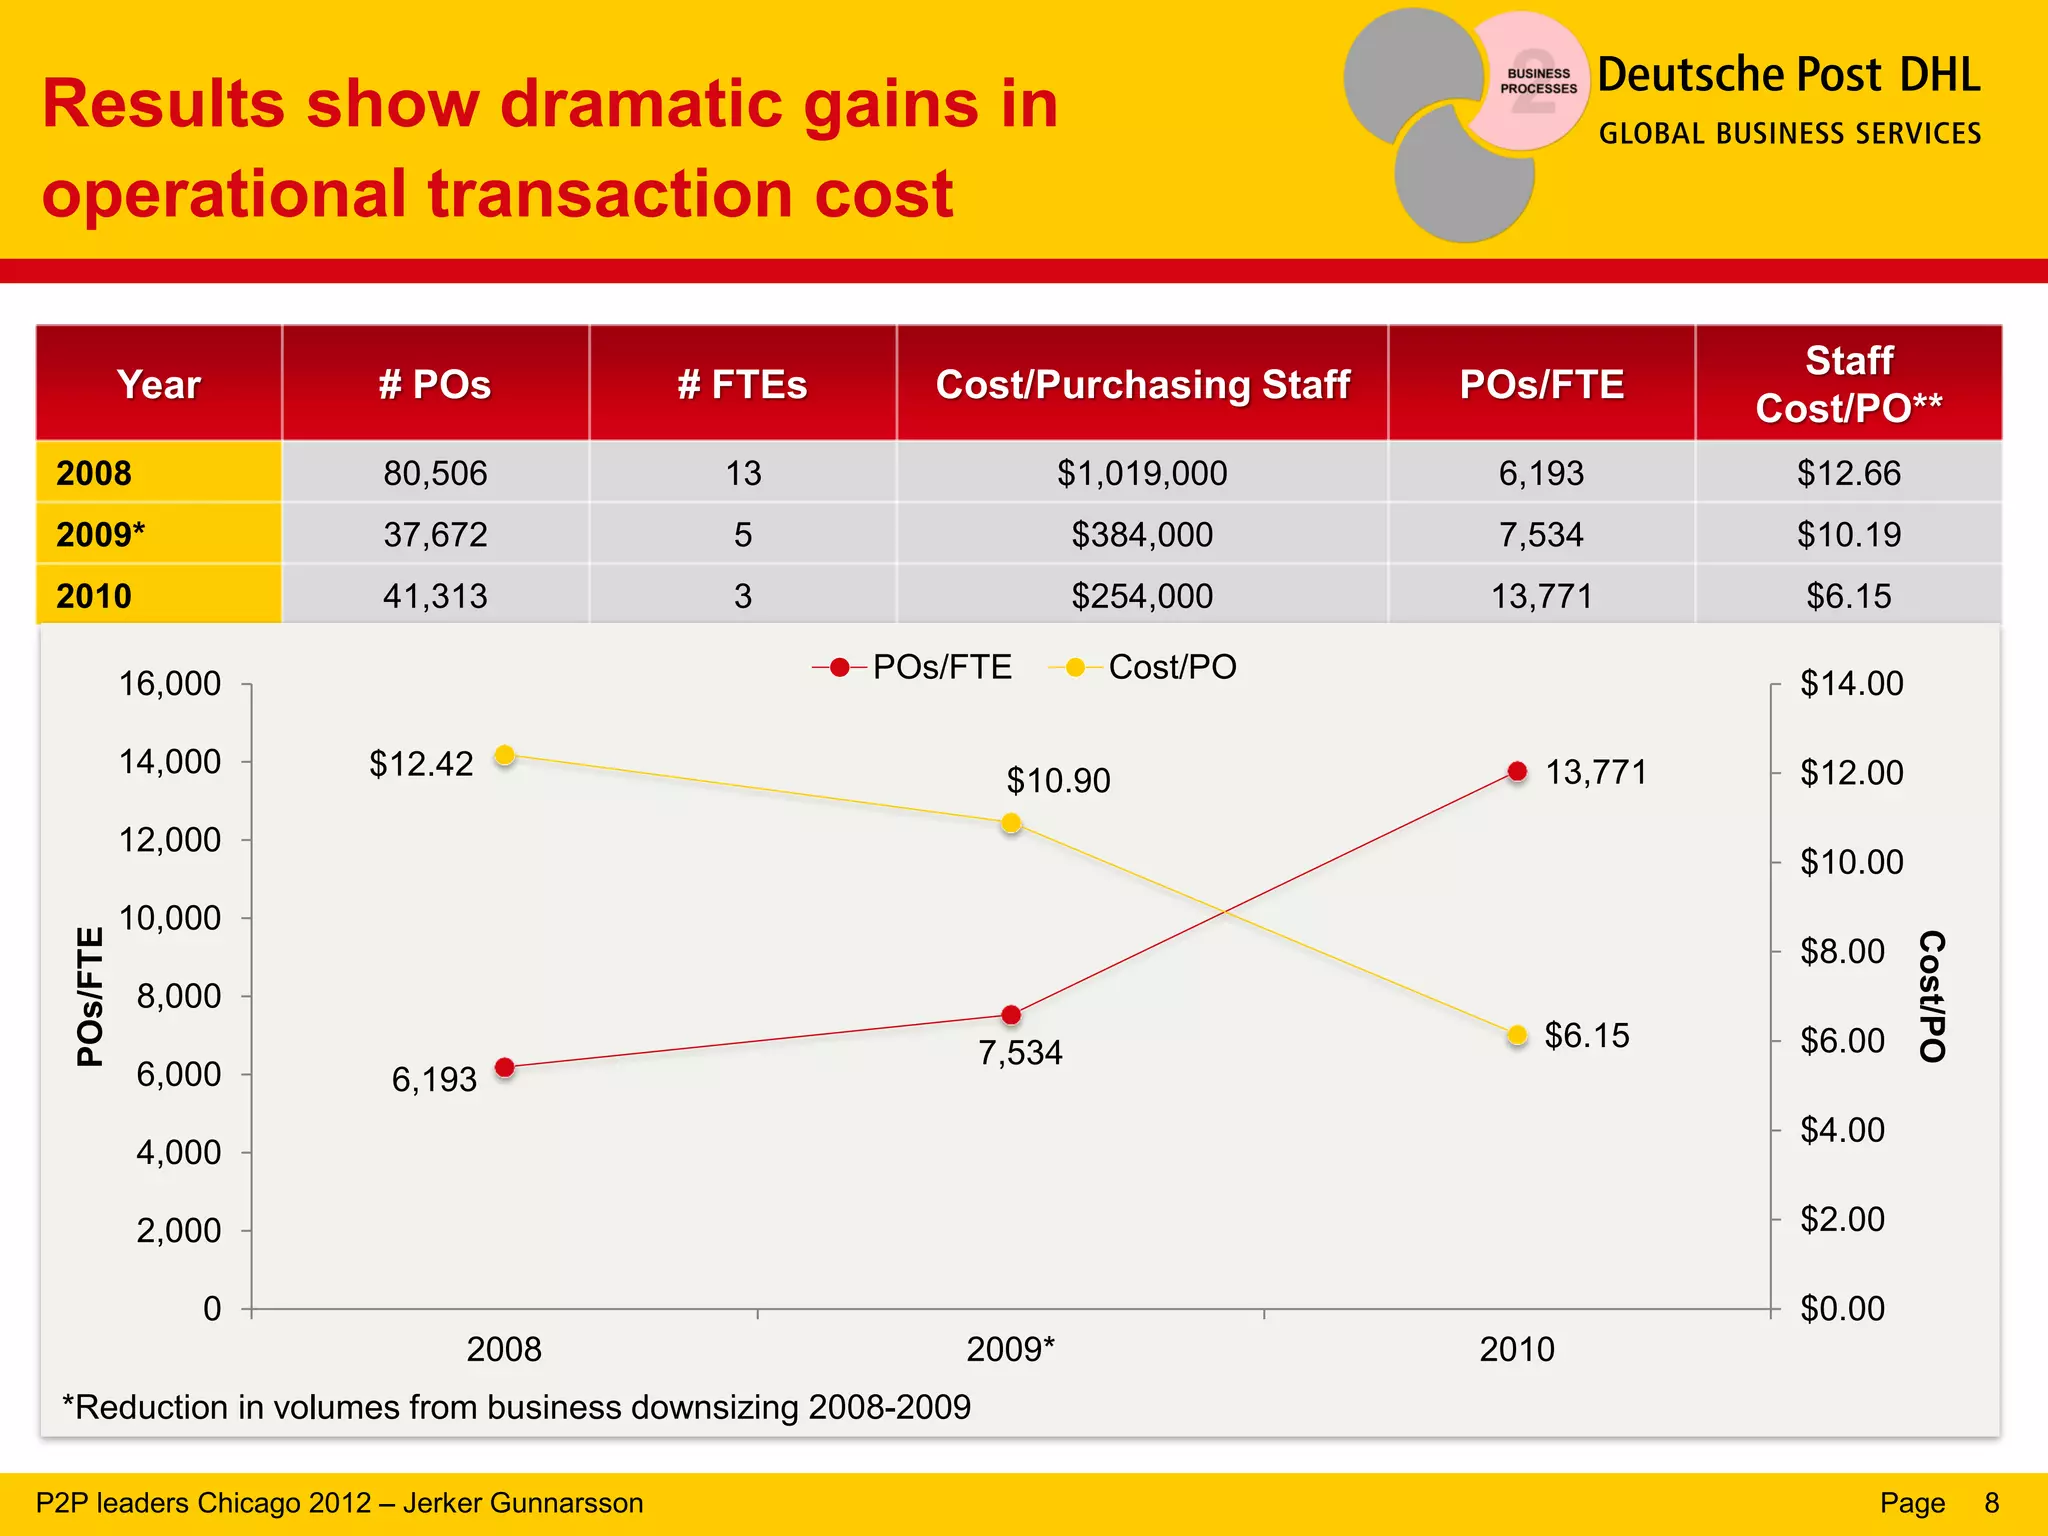
Data on purchasing orders, staff costs, and significant efficiency improvements across operational costs over the years.
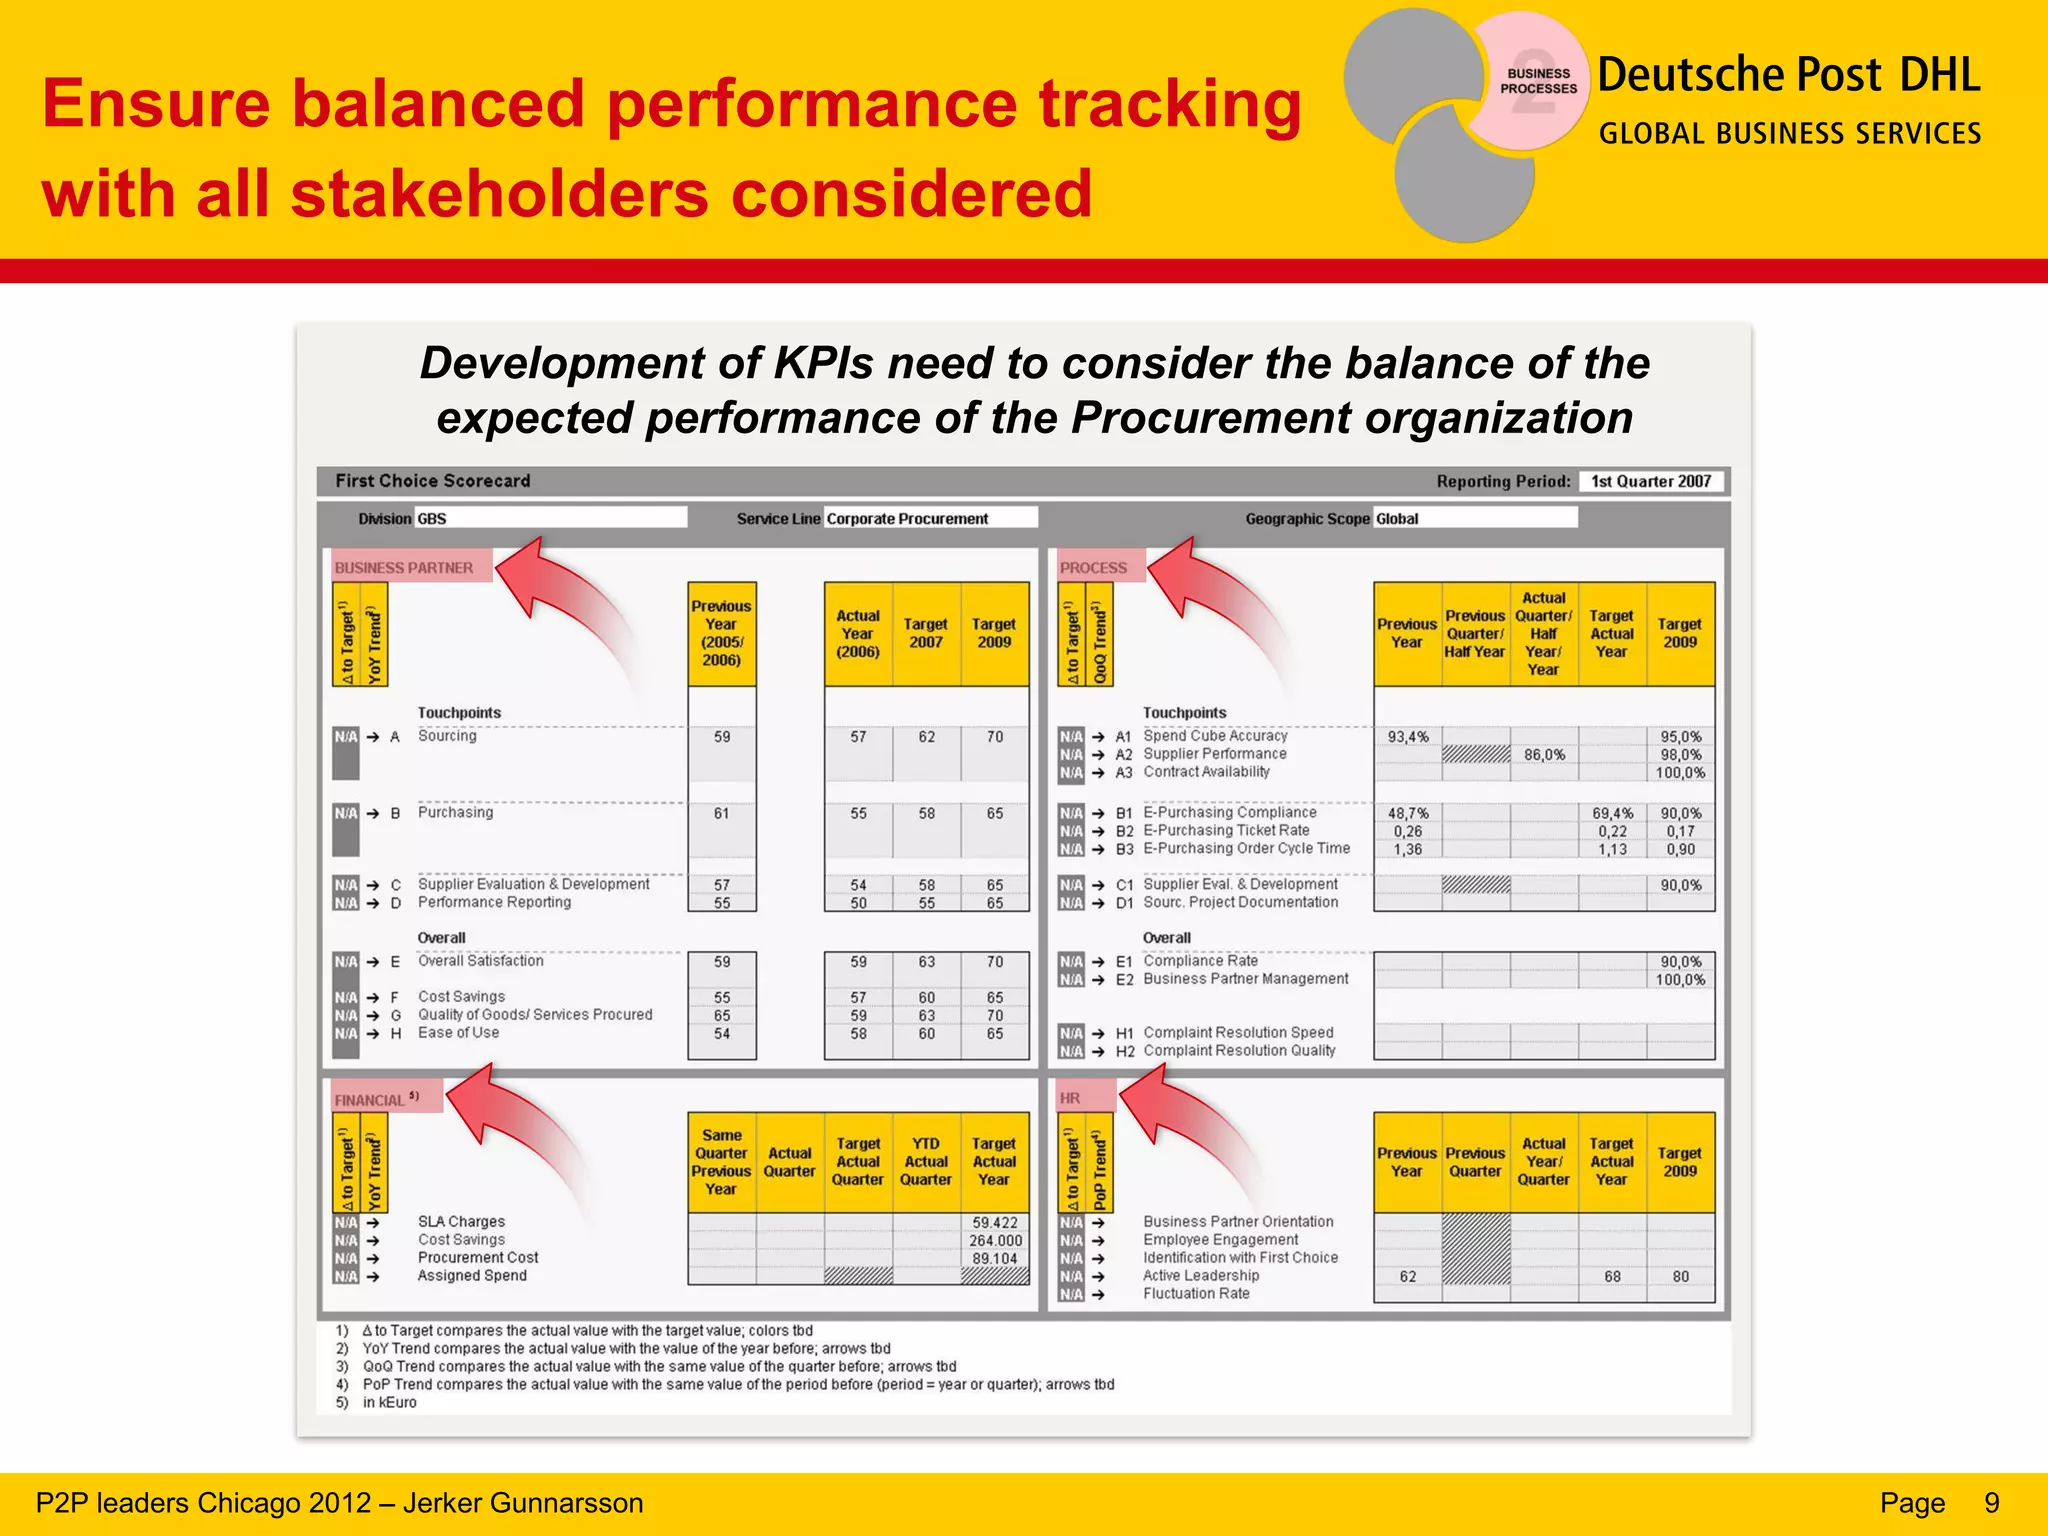
Emphasis on developing KPIs that align with stakeholder expectations for procurement performance.
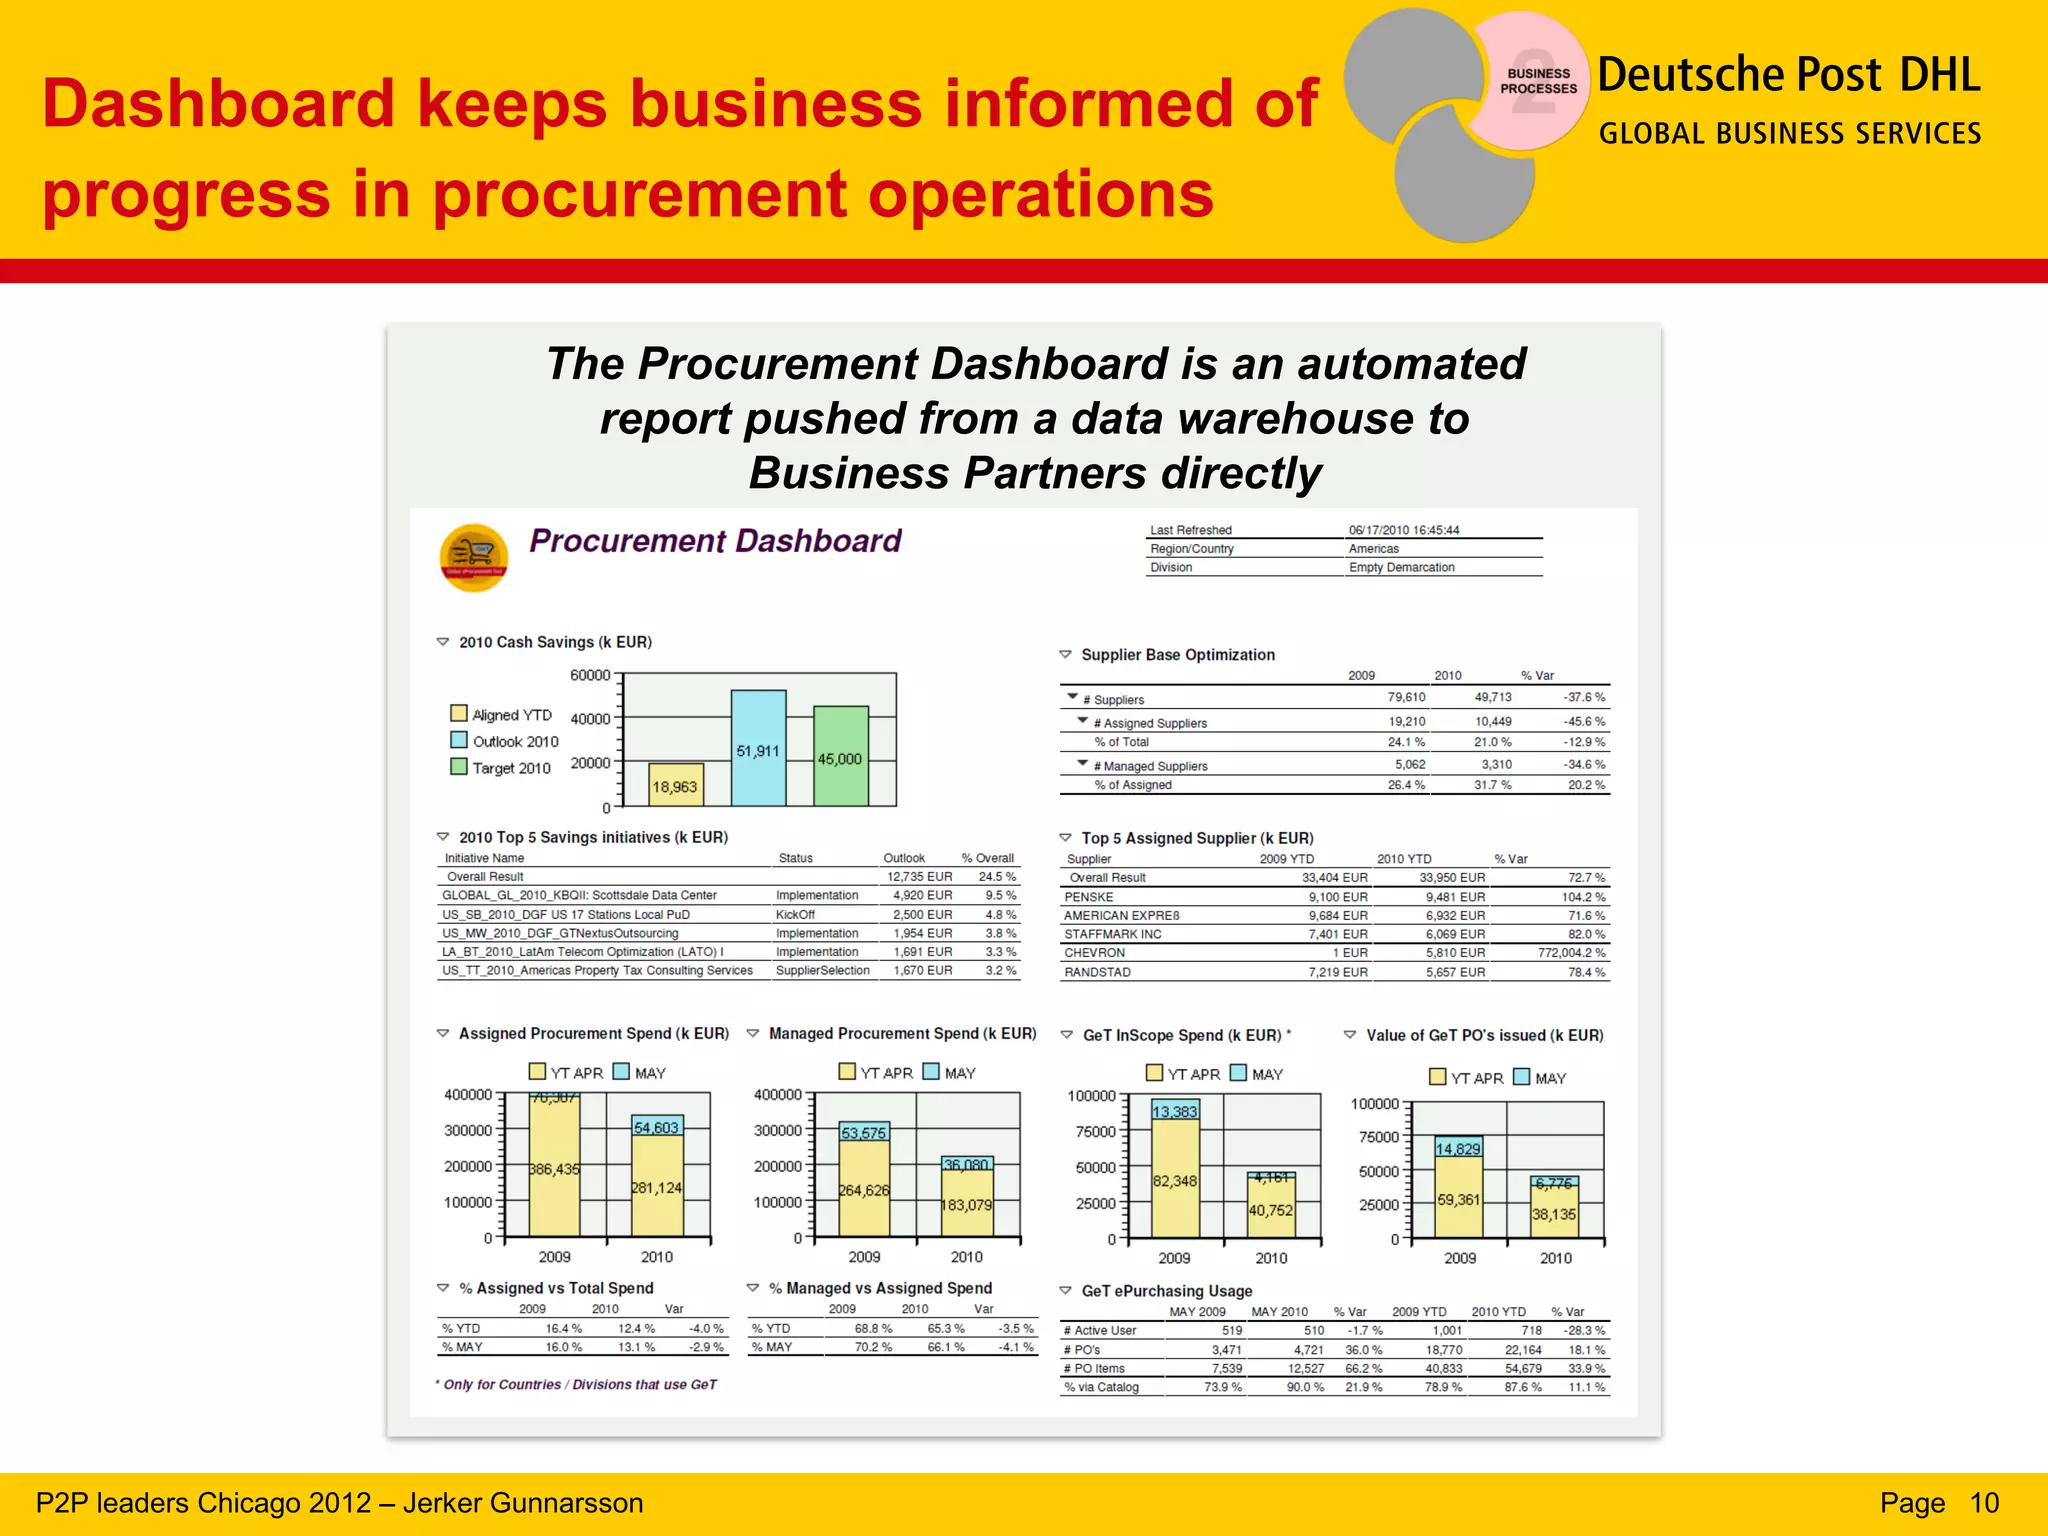
Introduction of an automated dashboard for real-time progress reporting in procurement operations.
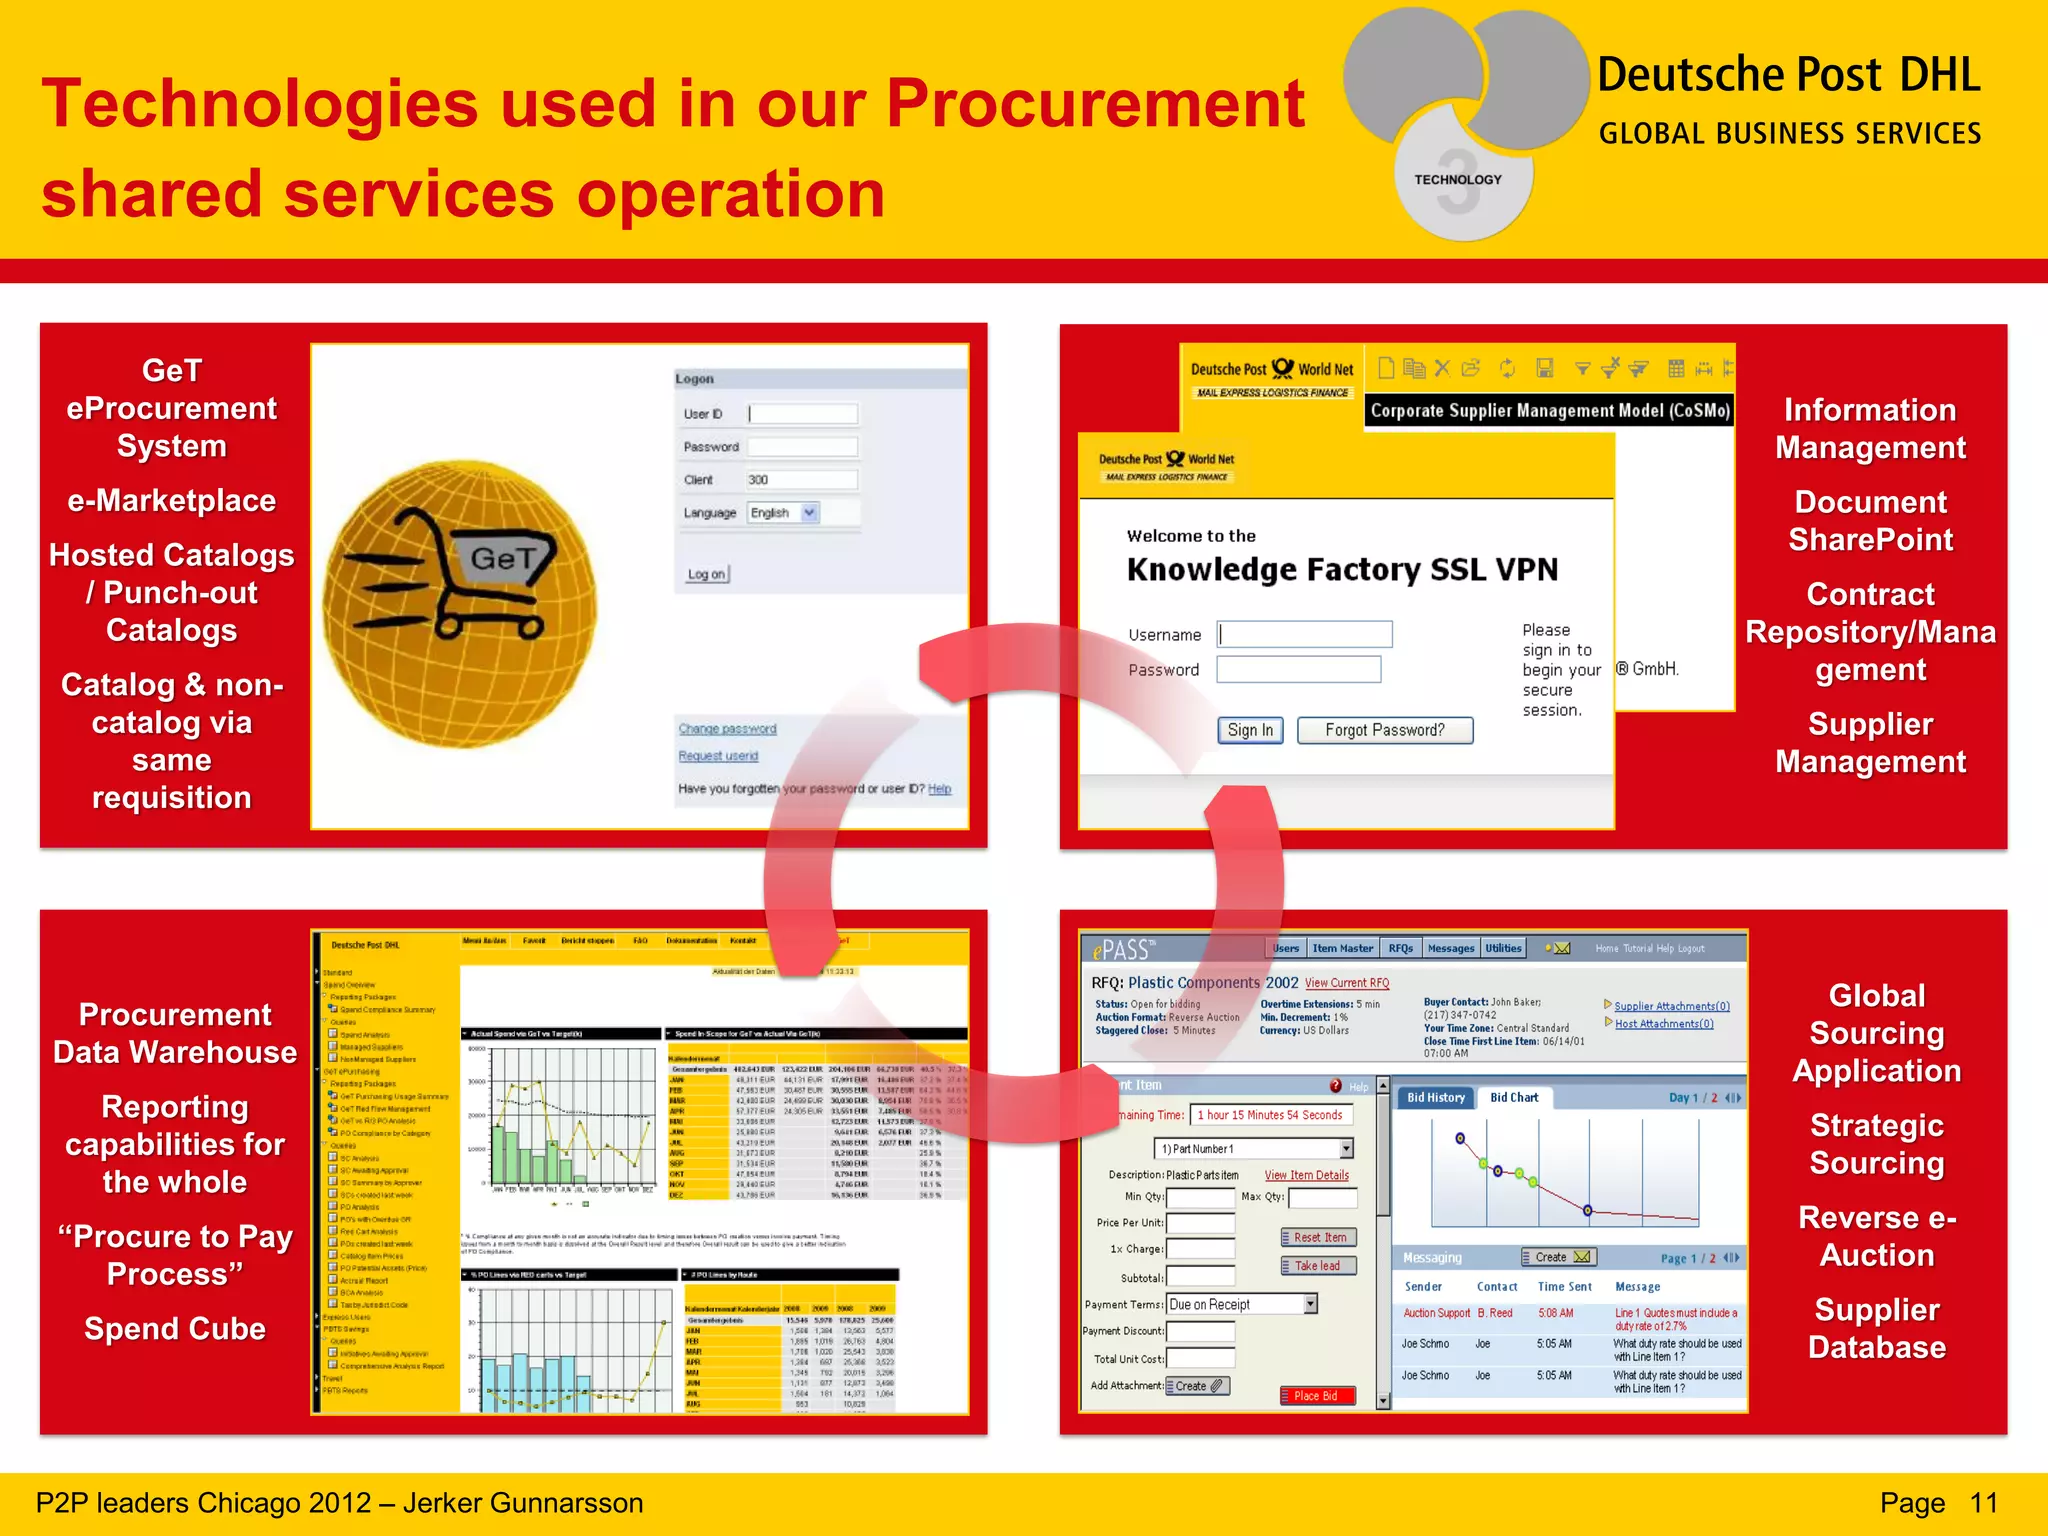
Overview of technologies used in shared services for procurement, emphasizing automation and efficiency tools.
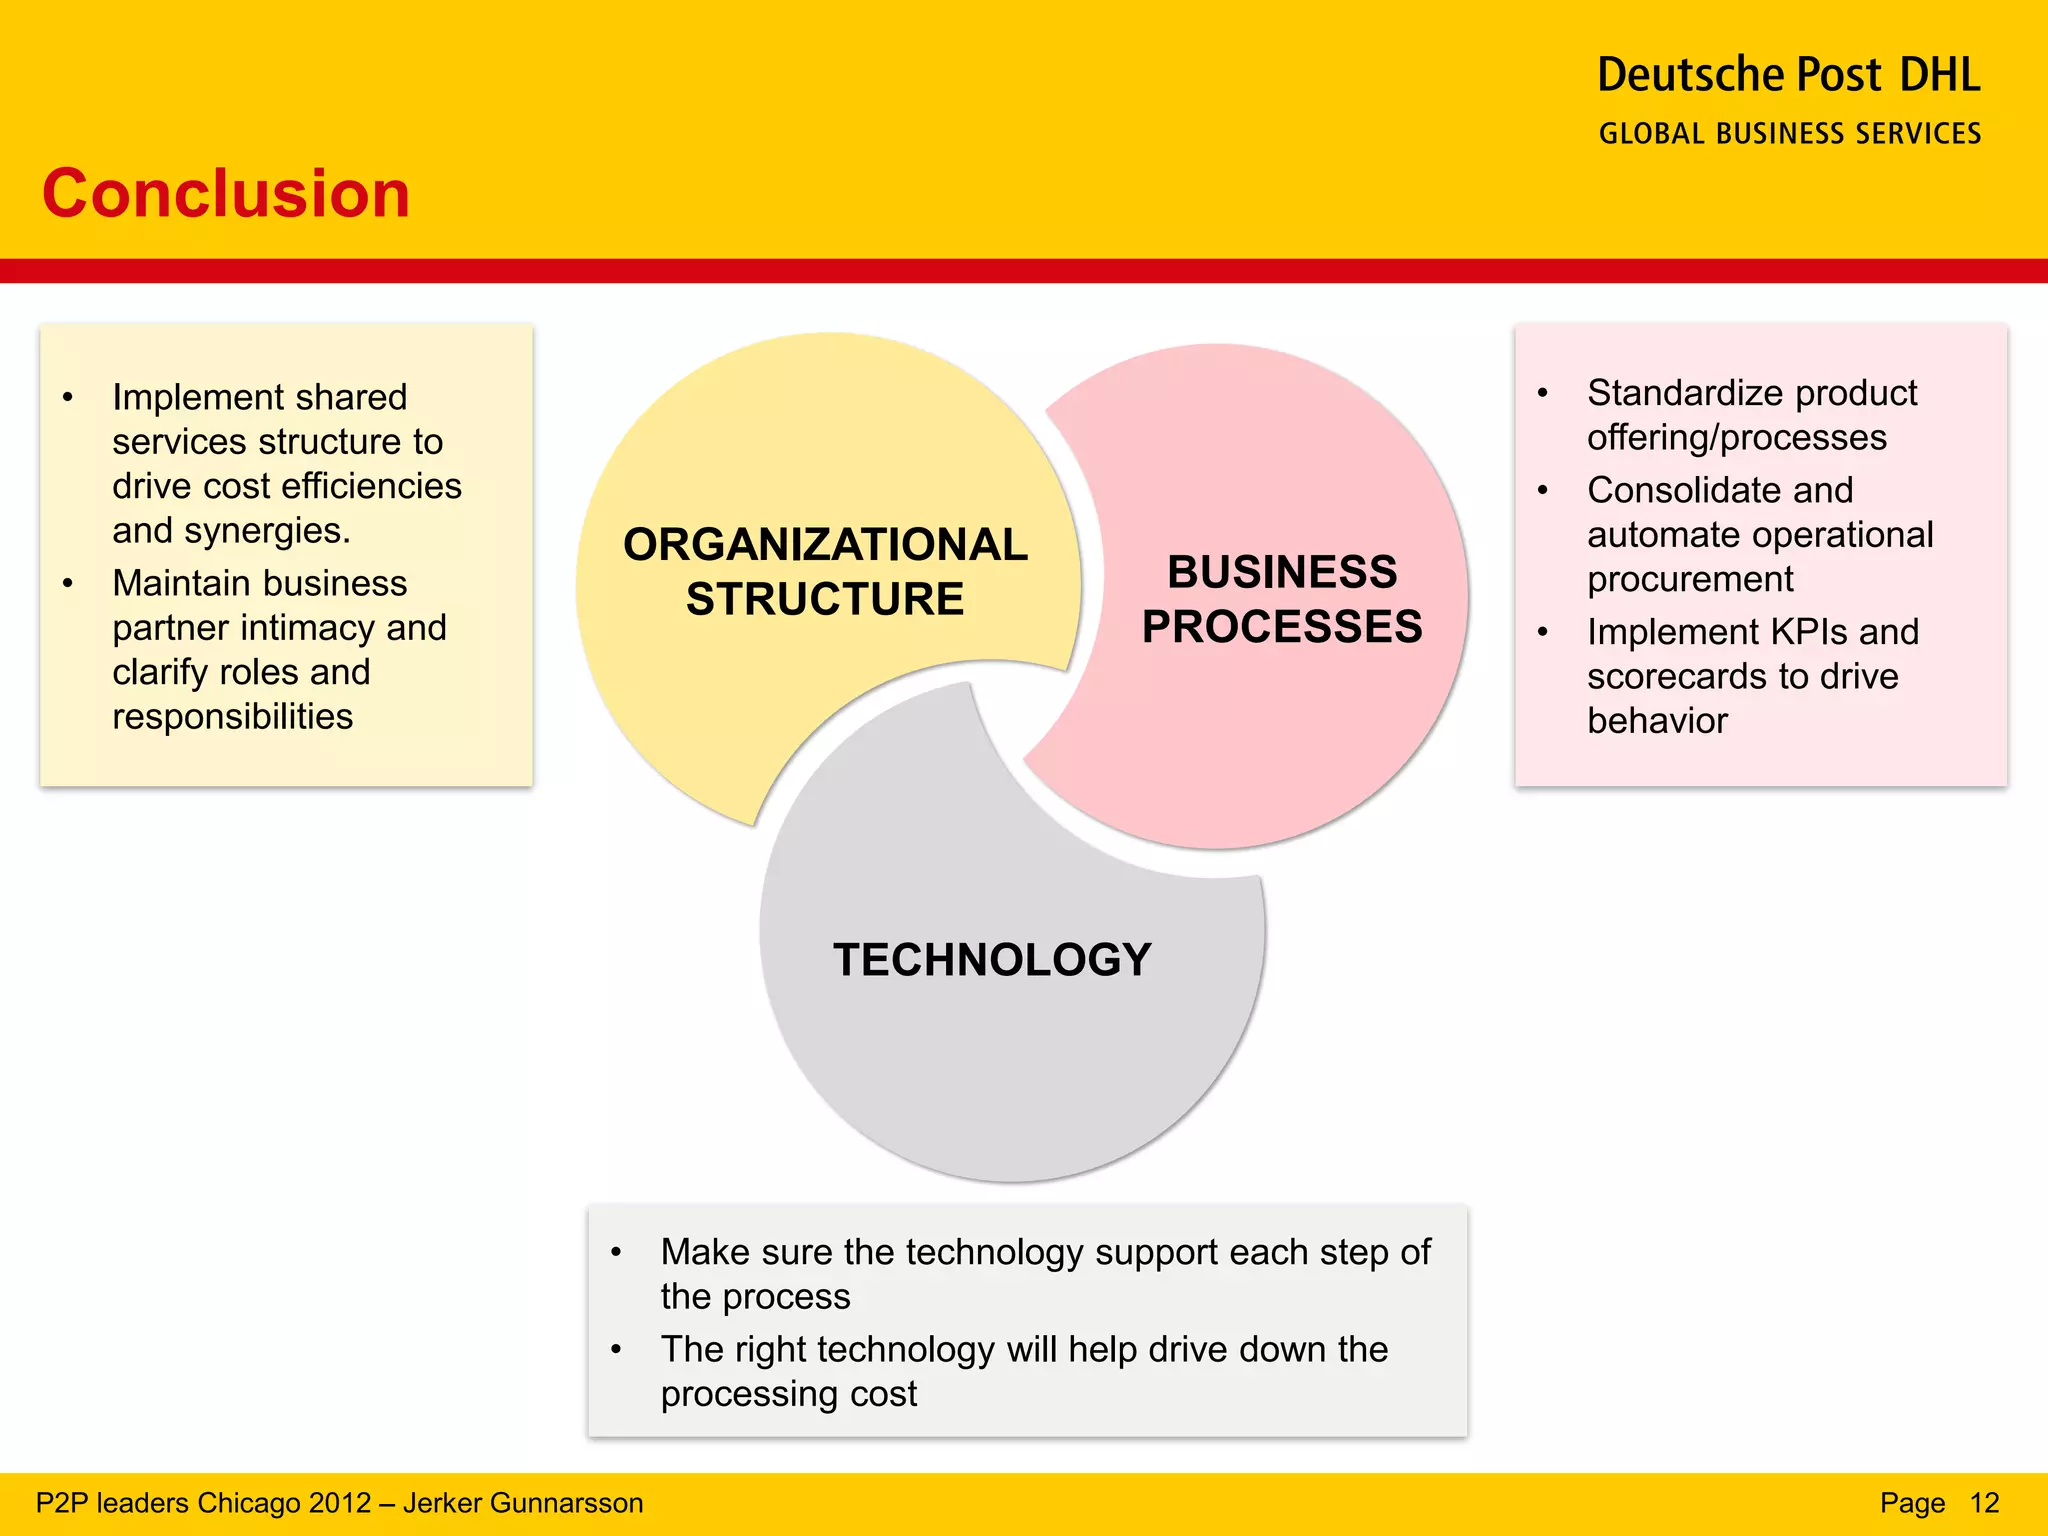
Key conclusions on implementing shared services for efficiency, standardization, and effective use of technology.
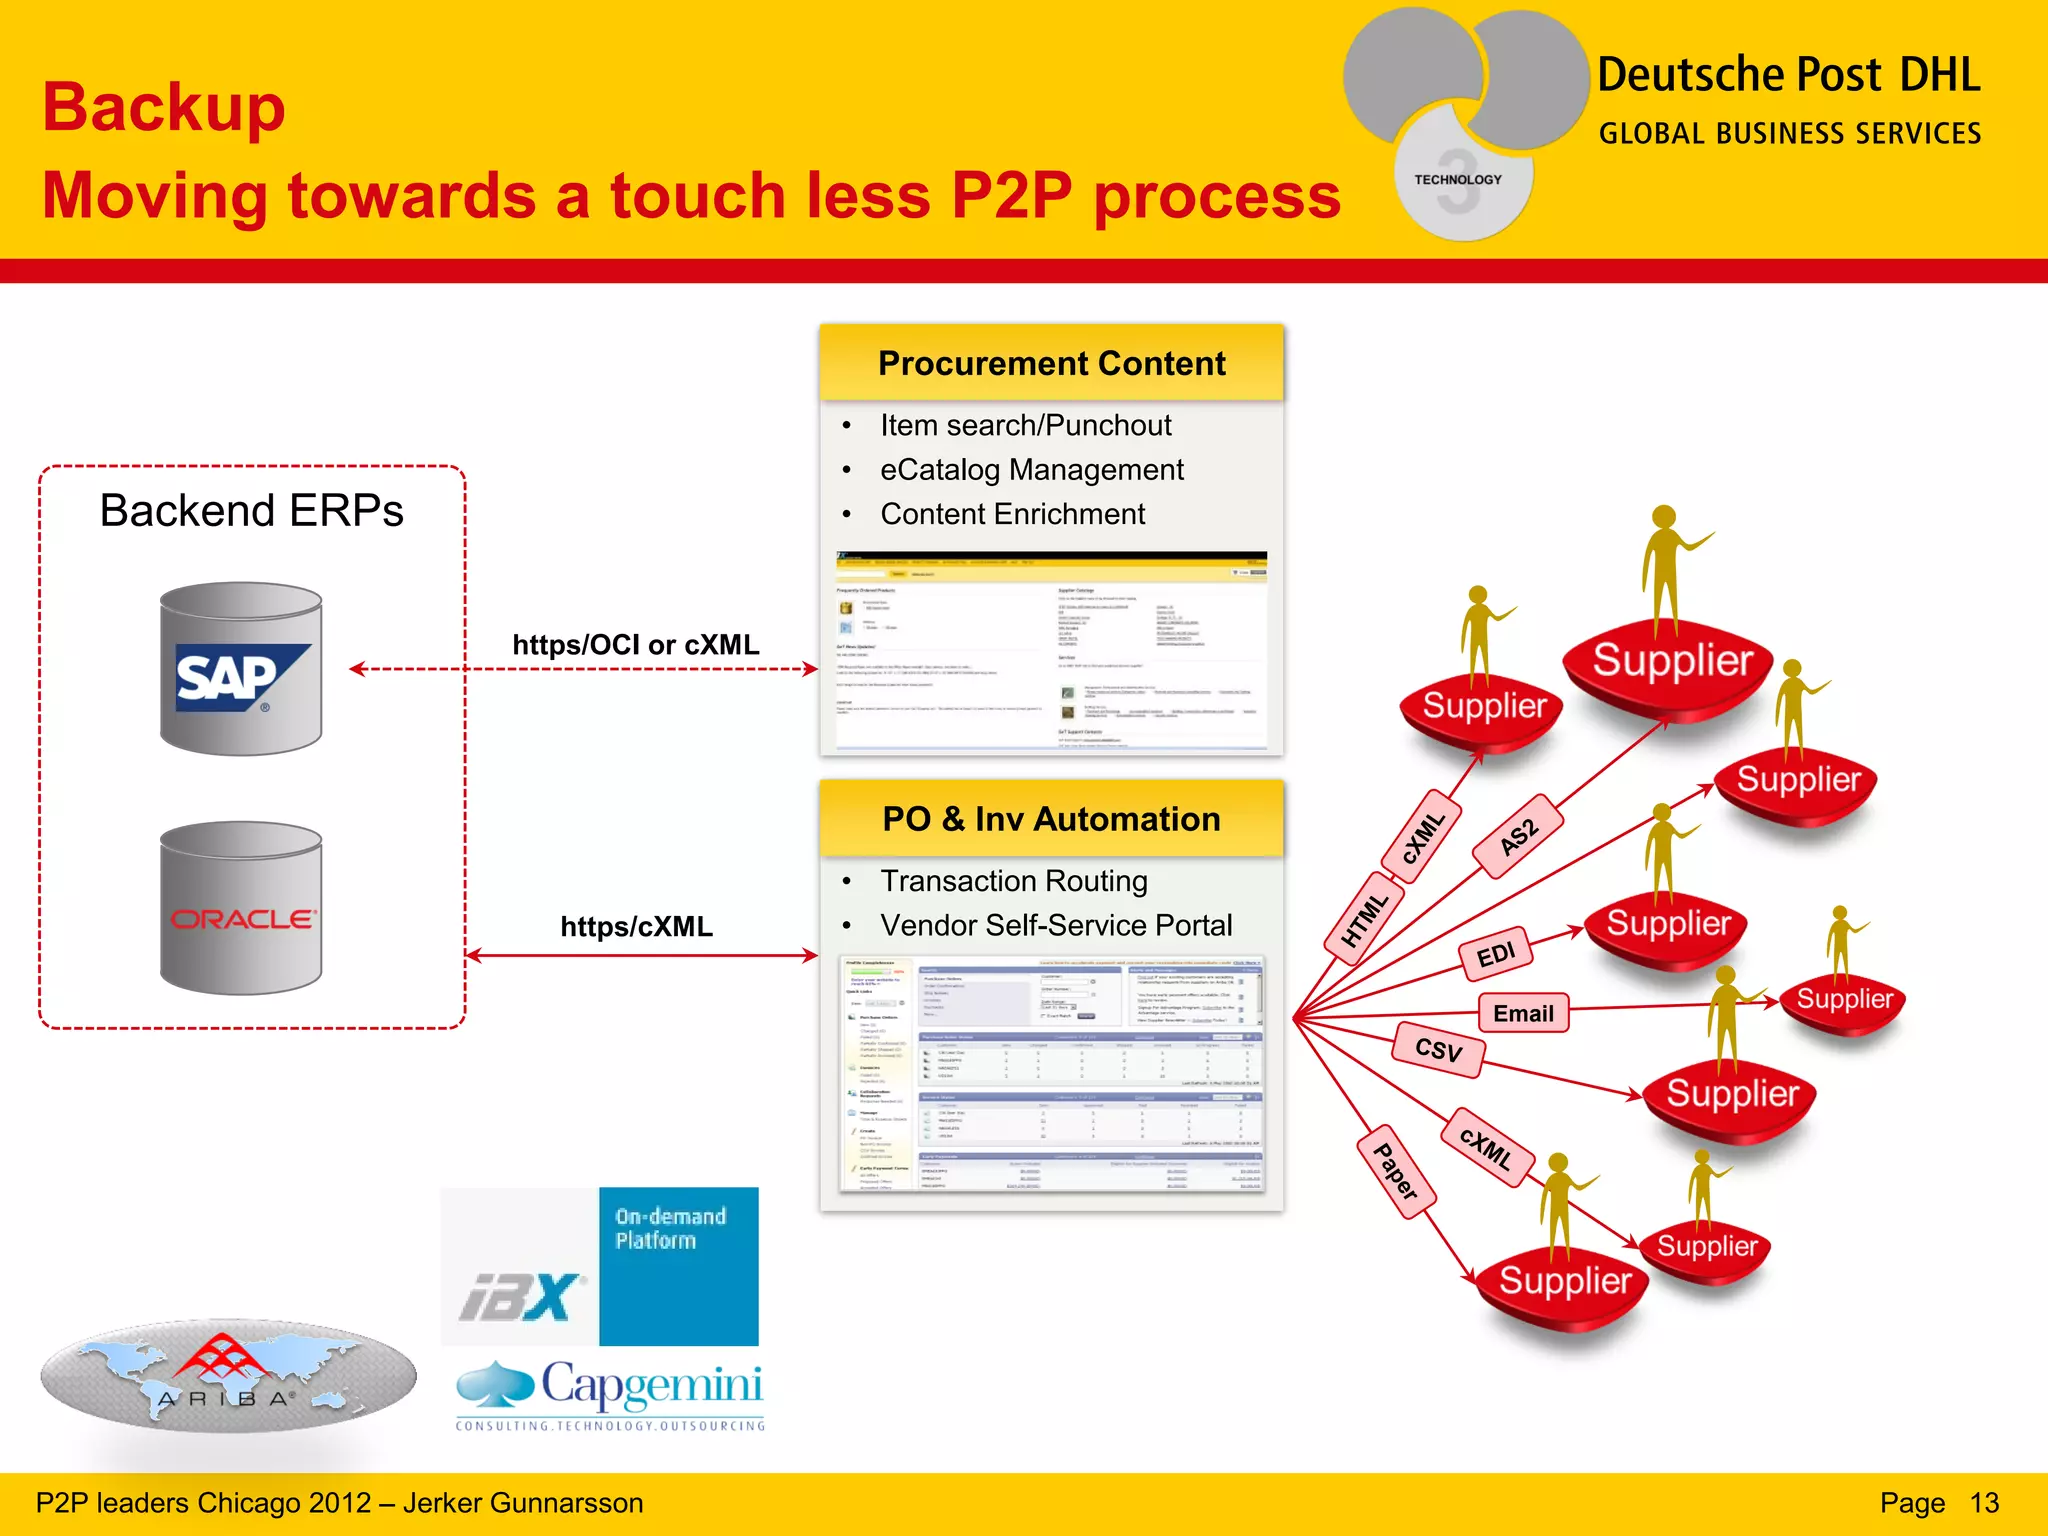
Details on moving to a touchless Procure-to-Pay (P2P) process utilizing backend systems and automation.
Concluding remarks by Jerker Gunnarsson, inviting questions from the audience.


![Company Profile [Eng]](https://cdn.slidesharecdn.com/ss_thumbnails/companyprofilemacnileng-130404022005-phpapp01-thumbnail.jpg?width=640&height=640&fit=bounds)


