Download as PDF, PPTX
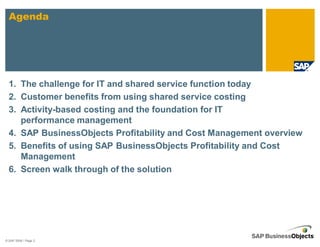
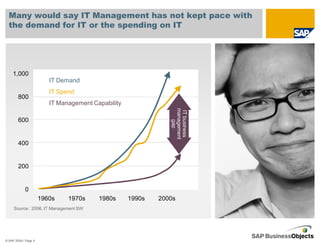
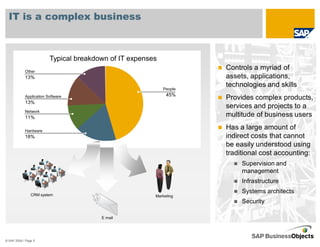
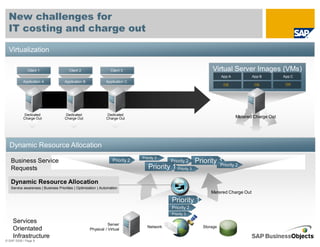
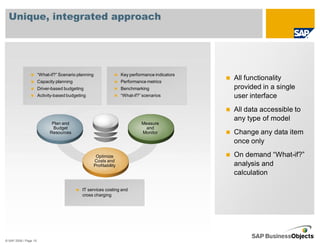
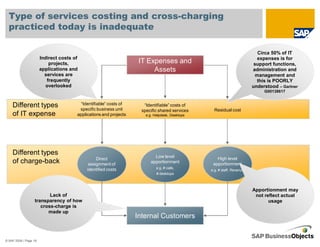
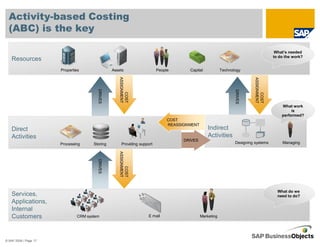
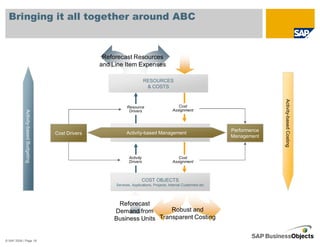
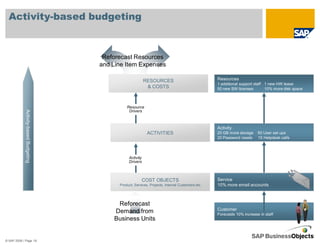
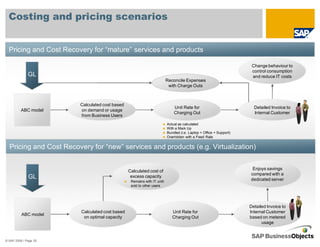
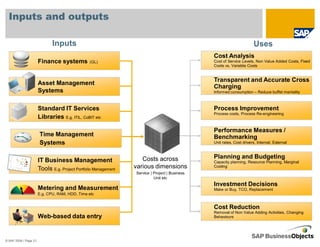
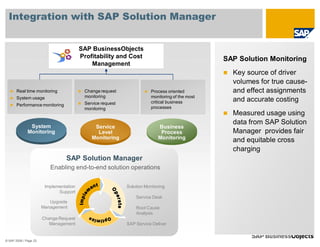
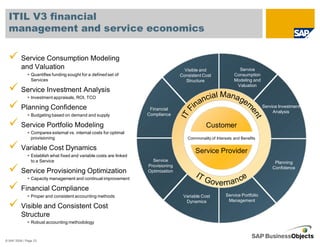
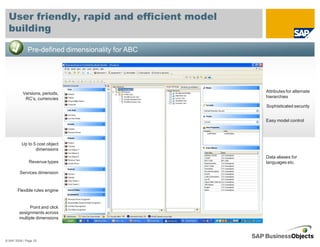
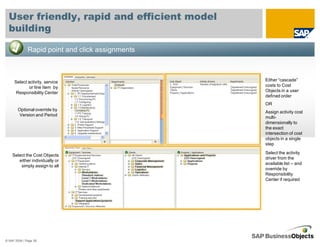
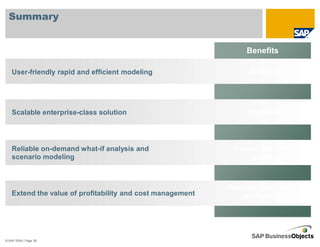
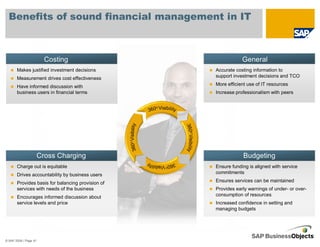
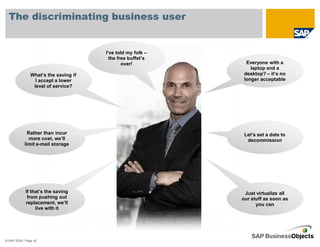
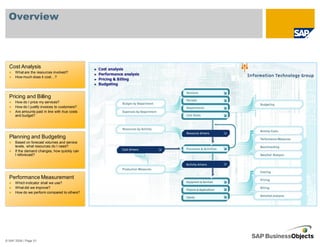
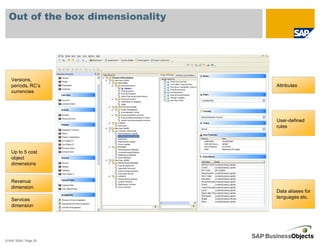
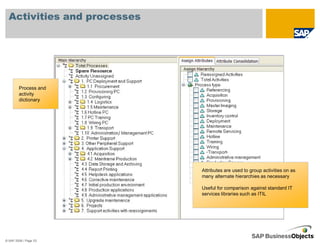
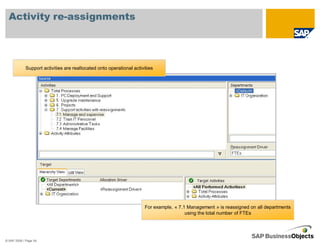
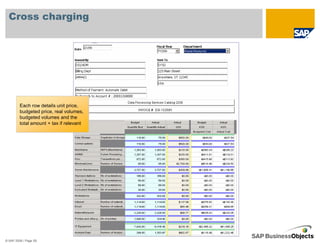
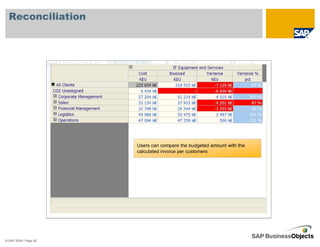
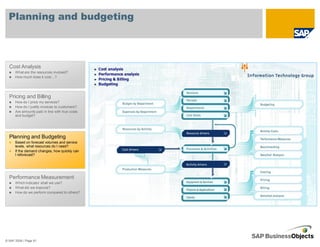
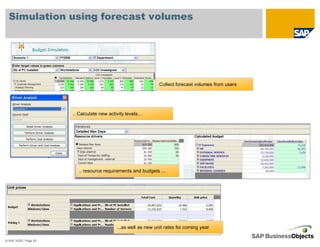
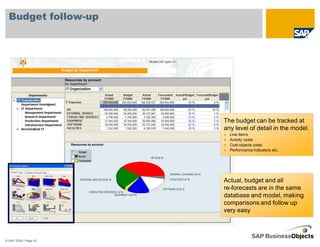
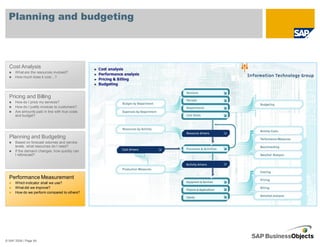
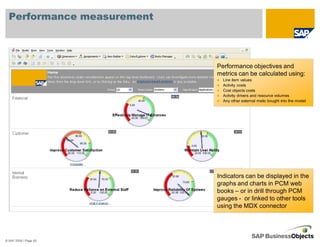
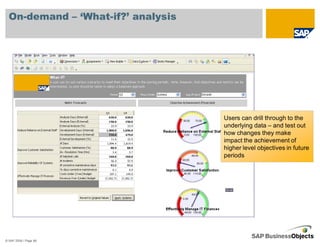

The document discusses the challenges faced by IT and shared service functions in accurately costing services and demonstrating performance. It outlines how activity-based costing can provide the foundation for IT performance management by assigning costs to activities and services. The presentation then provides an overview and benefits of SAP BusinessObjects Profitability and Cost Management, a solution that uses activity-based costing to help IT and shared services better understand costs, improve decision making, and demonstrate value to customers. It concludes with an upcoming screen walkthrough of the solution.