Downloaded 529 times
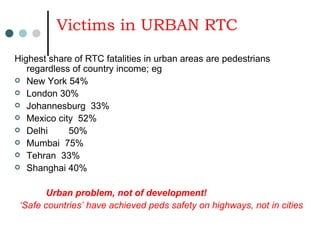
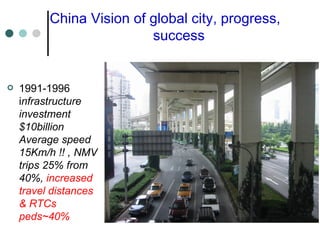
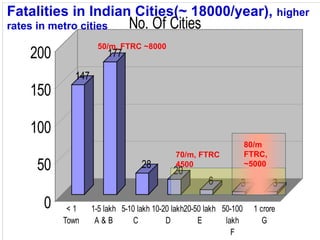
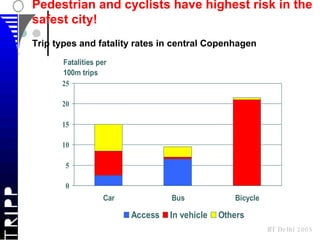
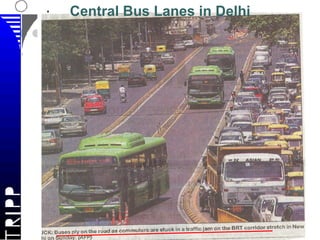
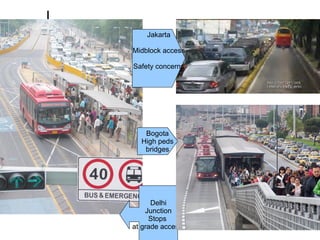

The document analyzes pedestrian safety and urban transport, emphasizing the increasing risks faced by pedestrians, especially in urban areas across various countries, with a focus on India. It highlights the need for improved infrastructure, behavioral changes, and better urban planning to enhance safety for non-motorized transport users. Trends indicate that while vehicle safety has improved, urban pedestrian fatalities remain a significant issue that requires urgent attention and innovative solutions.


