Download as PDF, PPTX


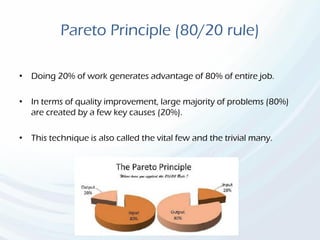


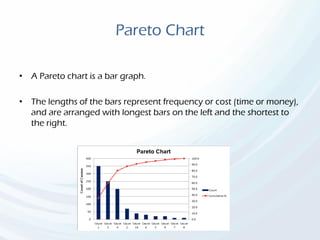
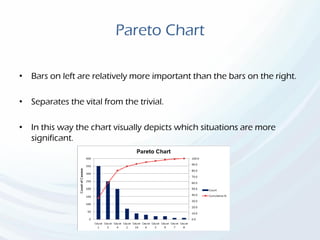
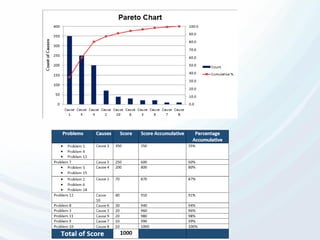

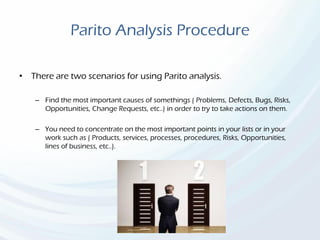
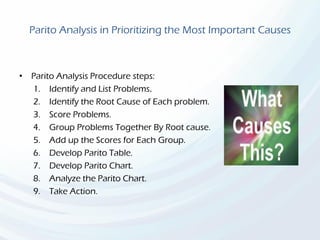


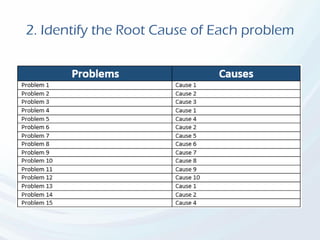
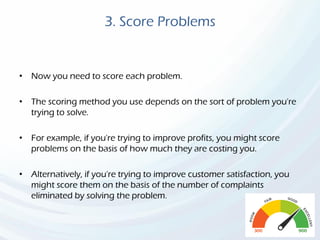
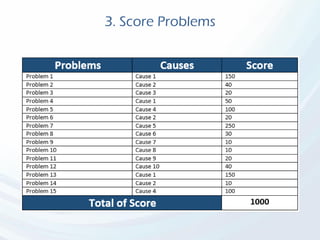
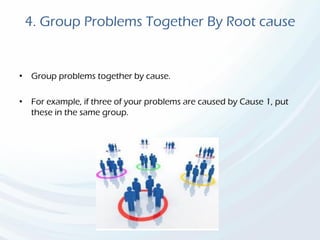
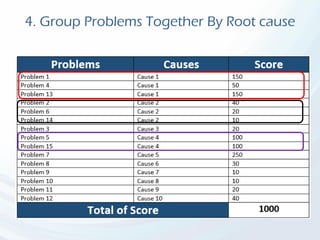
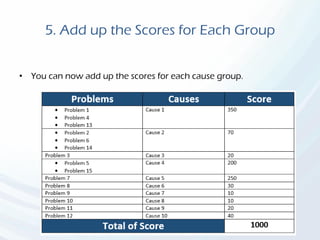
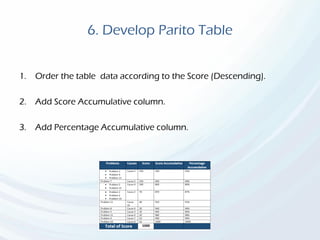
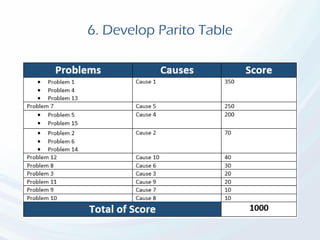
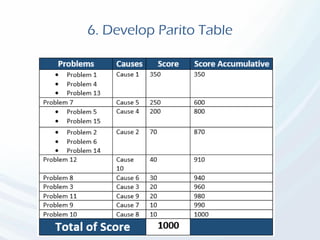
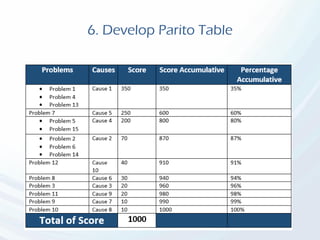
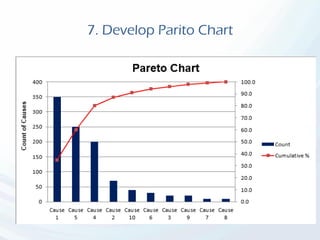
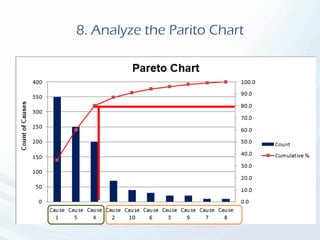


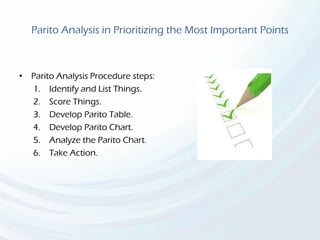
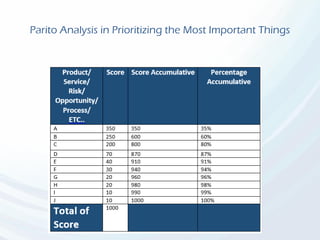
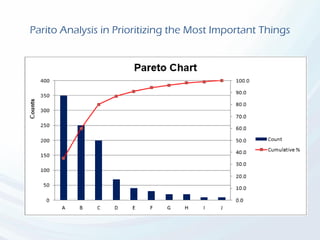
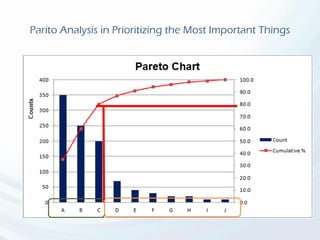


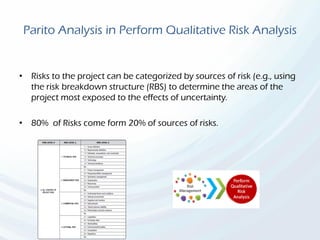

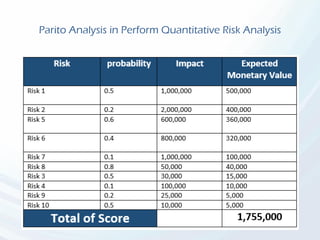
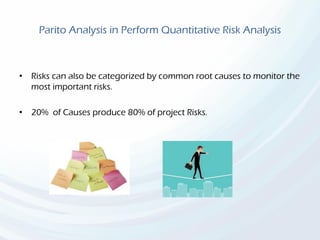
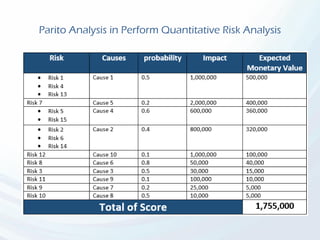
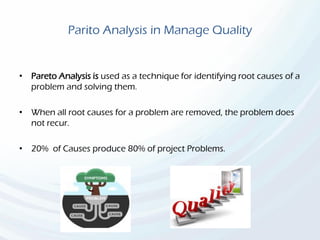
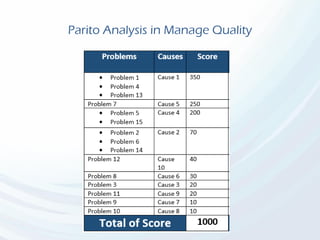

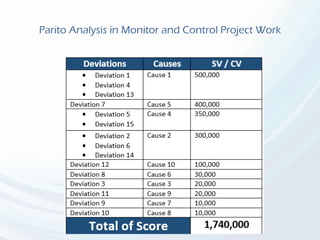
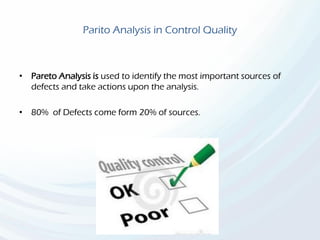
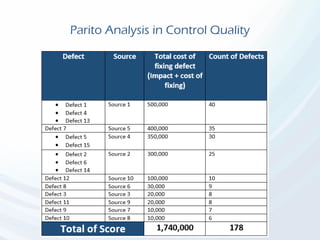
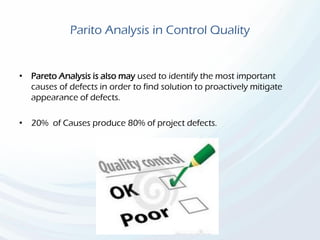
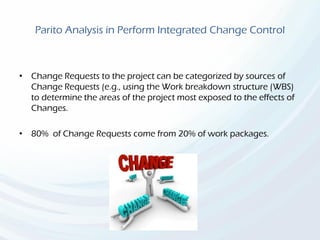
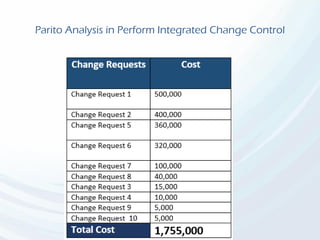
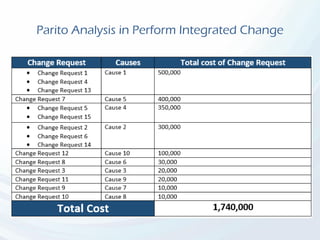


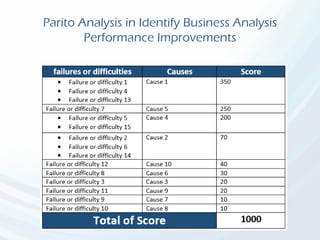


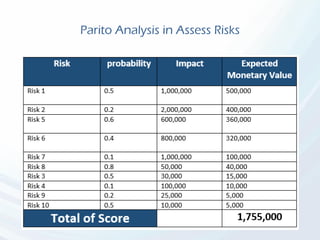


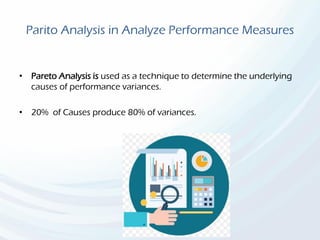

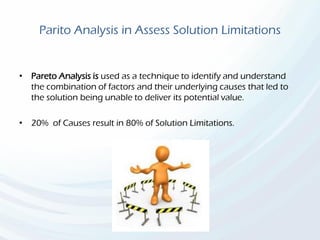
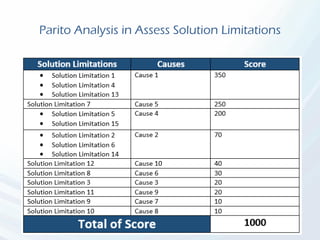

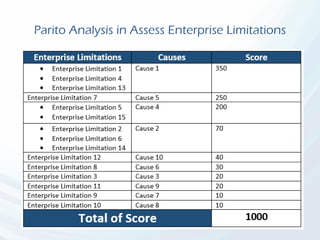

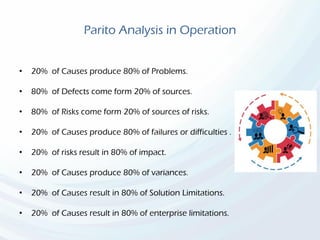


The document discusses Pareto Analysis, emphasizing the 80/20 rule where a small percentage of causes typically lead to a large percentage of effects in various contexts such as project management and business analysis. It outlines the process of Pareto analysis, including identifying problems, scoring them, and prioritizing solutions based on their impact. The text also highlights the importance of focusing on the most significant issues to maximize efficiency and effectiveness in decision-making.


![Intro to Key Performance Indicators [Infographic]](https://cdn.slidesharecdn.com/ss_thumbnails/kpi-infographic-160217090723-thumbnail.jpg?width=640&height=640&fit=bounds)