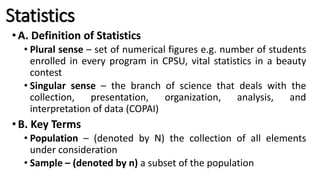
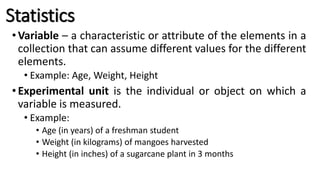
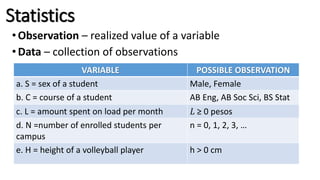
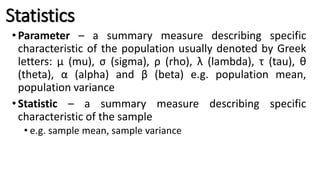
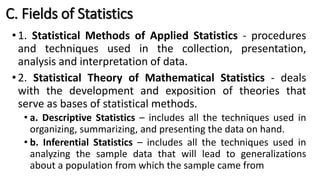
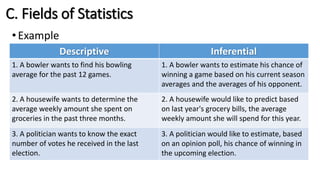
SlideShare a Scribd company logo
1 of 29
Basic Concepts in
Statistics
......DownloadsY2Mate.is - Why You Need to Study Statistics-wV0Ks7aS7YI-720p-1647268556411.mp4
• Why Study Statistics?
• To evaluate printed numerical facts.
• To interpret the results of sampling or to perform statistical
analysis in your work
• To make inferences about the population using information
collected from the sample
• What Do Statisticians Do?
• Gather data
• Summarize data
• Analyze data
• Draw conclusions and report the results of their analysis
Statistics
•A. Definition of Statistics
• Plural sense – set of numerical figures e.g. number of students
enrolled in every program in CPSU, vital statistics in a beauty
contest
• Singular sense – the branch of science that deals with the
collection, presentation, organization, analysis, and
interpretation of data (COPAI)
•B. Key Terms
• Population – (denoted by N) the collection of all elements
under consideration
• Sample – (denoted by n) a subset of the population
Statistics
•Example:
• A manufacturer of kerosene heaters wants to determine if
customers are satisfied with the performance of their heaters.
Toward this goal, 5,000 out of 200,000 customers are contacted
and each is asked, "Are you satisfied with the performance of
the kerosene heater you purchased?" Identify the population
and the sample for this situation.
• Population:
• The collection of 200,000 kerosene heater customers.
• Sample:
• The collection of 5,000 kerosene heater customers who
were interviewed.
Statistics
•Variable – a characteristic or attribute of the elements in a
collection that can assume different values for the different
elements.
• Example: Age, Weight, Height
•Experimental unit is the individual or object on which a
variable is measured.
• Example:
• Age (in years) of a freshman student
• Weight (in kilograms) of mangoes harvested
• Height (in inches) of a sugarcane plant in 3 months
Statistics
•Observation – realized value of a variable
•Data – collection of observations
VARIABLE POSSIBLE OBSERVATION
a. S = sex of a student Male, Female
b. C = course of a student AB Eng, AB Soc Sci, BS Stat
c. L = amount spent on load per month 𝐿 ≥ 0 pesos
d. N =number of enrolled students per
campus
n = 0, 1, 2, 3, …
e. H = height of a volleyball player h > 0 cm
Statistics
•Parameter – a summary measure describing specific
characteristic of the population usually denoted by Greek
letters: μ (mu), σ (sigma), ρ (rho), λ (lambda), τ (tau), θ
(theta), α (alpha) and β (beta) e.g. population mean,
population variance
•Statistic – a summary measure describing specific
characteristic of the sample
• e.g. sample mean, sample variance
Statistics
•Example: In order to estimate the true proportion of
students at a certain college who smoke cigarettes, the
administration polled a sample of 200 students and
determined that the proportion of students from the
sample who smoke cigarettes is 0.12. Identify the a)
population, b) sample, c) parameter, and d) statistic.
• a) Population: The set of students at a certain college.
• b) Sample: The set of 200 students who were interviewed.
• c) Parameter: The population proportion of students in a certain college
who smoke cigarettes.
• d) Statistic: (0.12) the proportion of students in the sample who smoke
cigarettes.
C. Fields of Statistics
•1. Statistical Methods of Applied Statistics - procedures
and techniques used in the collection, presentation,
analysis and interpretation of data.
•2. Statistical Theory of Mathematical Statistics - deals
with the development and exposition of theories that
serve as bases of statistical methods.
• a. Descriptive Statistics – includes all the techniques used in
organizing, summarizing, and presenting the data on hand.
• b. Inferential Statistics – includes all the techniques used in
analyzing the sample data that will lead to generalizations
about a population from which the sample came from
C. Fields of Statistics
•Example
Descriptive Inferential
1. A bowler wants to find his bowling
average for the past 12 games.
1. A bowler wants to estimate his chance of
winning a game based on his current season
averages and the averages of his opponent.
2. A housewife wants to determine the
average weekly amount she spent on
groceries in the past three months.
2. A housewife would like to predict based
on last year's grocery bills, the average
weekly amount she will spend for this year.
3. A politician wants to know the exact
number of votes he received in the last
election.
3. A politician would like to estimate, based
on an opinion poll, his chance of winning in
the upcoming election.
D. Measurement
•Measurement - the process of determining the value
or label of a variable based on what has been
observed
•Example:
• Age (in years)
• Weight (in kilograms)
• Height (in inches)
• Sex (Male or Female)
Types of Variables
•1. Qualitative variable
•A variable that yields categorical response
•Describes the quality or character of something
• Example: Eye color, First Name, Favorite Movie
•2. Quantitative Variable
•A variable that takes on numerical values representing
an amount or quantity
•Describes the amount or number of something
• Example: Weight, Height, Number of cars
Types of Variables
•a. Discrete - a variable which can assume finite, or, at
most, countably infinite number of values; usually
measured by counting or enumeration.
•Can assume only certain values, and there are
usually gaps between values.
•Example: Number of students enrolled in GEC 4,
Number of cars parked at the front of Admin building
Types of Variables
•b. Continuous - a variable which can assume
infinitely many values corresponding to a line
interval without gaps, interruptions, or jumps.
•Can assume any value within a specified range.
•Measurable (measured using a continuous scale such
as kilos, centimeters, grams)
•Example: Height in inches, Income in pesos, Weight in
kilograms
Levels of Measurement
•1. Nominal Level (Classificatory Scale)
•The nominal level is the weakest level of measurement
where numbers or symbols are used simply for
categorizing subjects into different groups. The
categories must be distinct, non-overlapping and
exhaustive
•Examples: Sex M-Male F-Female
• Marital status 1-Single 2-Married 3-Widowed 4-Separated
Levels of Measurement
•Interval Level – is that which has the properties of the
nominal and ordinal levels, and in addition, the
distances between any two numbers on the scale are
of known sizes. An interval scale must have a
common and constant unit of measurement.
Furthermore, the unit of measurement is arbitrary
and there is no “true zero” point.
•Examples:
• IQ
• Test Result
Levels of Measurement
•4. Ratio Level - measurement contains all the
properties of the interval level, and in addition, it has
a “true zero” point. This is the strongest level of
measurement.
•Examples:
• Daily Allowance
• Weight (in kg)
• Age (in years)
• Number of correct answers in an exam
Let’s try this
•I. In the following situations, let’s determine the
population, sample, parameter and statistic.
•1. In order to estimate the true proportion of students at
a certain college who smoke cigarettes, the
administration polled a sample of 200 students and
determined that the proportion of students from the
sample who smoke cigarettes is 0.12.
• Identify the
• a) variable, b) population,
• c) sample, d) parameter, and e) statistic.
Let’s try this
•Solution:
•a. Variable: Whether or not a student smoke
•b. Population: The set of students at a certain college.
•c. Sample: The set of 200 students who were
interviewed.
•d. Parameter: The population proportion of students in a
certain college who smoke cigarettes.
•e. Statistic: (0.12) the proportion of students in the
sample who smoke cigarettes.
Let’s try this
• 2. A politician who is running for the office of mayor of a city with
25,000 registered voters commissions on a survey. In the survey,
48% of the 200 registered voters interviewed say they plan to vote
for her.
• Solution:
a. Variable: Whether or not a voter will vote the running political for
Mayor
b. Population: The group of 25,000 registered voters
c. Sample: The group of 200 registered voters who were interviewed
d. Parameter: The percentage of registered voters in the population
who plan to vote for her.
e. Statistic: (48%) The percentage of registered voters in the sample
who plan to vote for her.
Let’s try this
• II. Let’s determine whether the following statements belong to
the field of descriptive statistics or inferential statistics.
• 1. A badminton player wants to know his average score for the past 10
games.
• Solution: Descriptive statistics (Data is only gathered and summarized)
• 2. Janine wants to determine the variability of her six exam scores in
algebra.
• Solution: Descriptive statistics (Data is only gathered and summarized)
• 3. Based on last year’s electricity bills, Mrs. Venegas would like to forecast
the average monthly electricity bill she will pay for the next year based on
her average monthly bill in the past year.
• Solution: Inferential statistics (Data is analyzed to make a
forecast)
Let’s try this
• III. Let’s classify the following by a) type of variable and b) level of
measurement. If the variable is quantitative, determine whether
it is discrete or continuous.
Types of Variable Level of Measurement
Example: Degree Program (AB Social Science, AB English
Language, BS Statistics)
Qualitative Nominal
Example: Weight of women (in kg) before they took the
diet
Quantitative,
Continuous
Ratio
1. Height (in inches)
2. Sizes of shirts (i.e. XS, S, M, L, XL)
3. Zipcode (i.e. 6111 – Kabankalan)
4. Civil Status
5. Number of siblings
Let’s try this
• III. Let’s classify the following by a) type of variable and b) level of
measurement. If the variable is quantitative, determine whether
it is discrete or continuous.
•Solution:
• 1) Quantitative, Continuous, Ratio
• 2) Qualitative, Ordinal
• 3) Qualitative, Nominal
• 4) Qualitative, Nominal
• 5) Quantitative, Discrete, Ratio
Let’s Try Some More
•I. In the following situation, let’s determine the
variable, population, sample, parameter and
statistic.
•Mr. Donaldo Chan, a candidate for Vice Mayor in Orion,
Bataan wants to find out if there is a need to intensify his
campaign efforts against his opponents. He requested
the services of a group of students to interview 1,000 of
the 3,000 registered voters of Orion, Bataan. The survey
results showed that 75% of the 1,000 voters in the
sample will vote for him as vice-mayor. Identify the
following.
Let’s Try Some More
•I. In the following situation, let’s determine the
variable, population, sample, parameter and
statistic.
a. Variable: Whether or not a voter will vote for Mr. Chan as Vice Mayor
b. Population: The collection of 3,000 registered voters of Orion, Batangas
c. Sample: The collection of 1,000 registered voters of Orion, Batangas
d. Parameter: The percentage of registered voters in the population who
voted for Mr. Chan as Vice-Mayor
e. Statistic: The percentage of registered voters in the sample who voted
for Mr. Chan as Vice-Mayor
Let’s Try Some More
•II. Let’s determine whether the following statements
belong to the field of descriptive statistics or inferential
statistics.
a. A car manufacturer wishes to estimate the average lifetime of batteries by testing a
sample of 50 batteries. Answer: _________
b. A shipping company wishes to estimate the number of passengers traveling via their
ships next year using their data on the number of passengers in the past three years.
Answer: __________________
c. A marketing research group wishes to determine the number of families not eating
three times a day in the sample used for their survey. Answer: ________________
d. A politician wants to determine the total number of votes his rival obtained in the past
election based on his copies of the tally sheet of electoral returns Answer: __________
e. A politician wants to determine the total number of votes his rival obtained in the
sample used in the exit poll. Answer: _________________
Let’s Try Some More
•III. Let’s classify the following by a) type of variable and b)
level of measurement. If the variable is quantitative,
determine whether it is discrete or continuous.
Type of Variable Level of Measurement
Example: Weight of women (in kg) before they took the
diet
Quantitative, Continuous Ratio
1. Score in a ten-item quiz
2. Teacher’s performance rating (Excellent, Very Good,
Good, Satisfactory, Needs Improvement)
3. Total kilos of papaya harvests
4. Brand of cellphone
5. Body Temperature (in Celsius)
End of this topic

More Related Content

Similar to STAT 1 - Basic-Concepts-in-Statistics.pptx

Ch # 1 Introduction to Statistic.pptx
Ch # 1 Introduction to Statistic.pptxCh # 1 Introduction to Statistic.pptx
Ch # 1 Introduction to Statistic.pptxKokab Manzoor
 
Introduction to Statistics-prelimanary.pptx
Introduction to Statistics-prelimanary.pptxIntroduction to Statistics-prelimanary.pptx
Introduction to Statistics-prelimanary.pptxUthayaSuriyan4
 
Statistics for Data Analytics
Statistics for Data AnalyticsStatistics for Data Analytics
Statistics for Data AnalyticsSSaudia
 
introduction to statistical theory
introduction to statistical theoryintroduction to statistical theory
introduction to statistical theoryUnsa Shakir
 
1.-Lecture-Notes-in-Statistics-POWERPOINT.pptx
1.-Lecture-Notes-in-Statistics-POWERPOINT.pptx1.-Lecture-Notes-in-Statistics-POWERPOINT.pptx
1.-Lecture-Notes-in-Statistics-POWERPOINT.pptxAngelineAbella2
 
Types of Statistics.pptx
Types of Statistics.pptxTypes of Statistics.pptx
Types of Statistics.pptxANKURARYA23
 
Biostatisitics.pptx
Biostatisitics.pptxBiostatisitics.pptx
Biostatisitics.pptxFatima117039
 
Topic 1 ELEMENTARY STATISTICS.pptx
Topic 1 ELEMENTARY STATISTICS.pptxTopic 1 ELEMENTARY STATISTICS.pptx
Topic 1 ELEMENTARY STATISTICS.pptxmoisespadillacpsu19
 
BASIC CONCEPTS in STAT 1 [Autosaved].pptx
BASIC CONCEPTS in STAT 1 [Autosaved].pptxBASIC CONCEPTS in STAT 1 [Autosaved].pptx
BASIC CONCEPTS in STAT 1 [Autosaved].pptxJhunafilRas2
 
LEVEL OF MEASUREMENTS_2.ppt
LEVEL OF MEASUREMENTS_2.pptLEVEL OF MEASUREMENTS_2.ppt
LEVEL OF MEASUREMENTS_2.pptchusematelephone
 
Introduction to basics of bio statistics.
Introduction to basics of bio statistics.Introduction to basics of bio statistics.
Introduction to basics of bio statistics.AB Rajar
 

Similar to STAT 1 - Basic-Concepts-in-Statistics.pptx (20)

Ch # 1 Introduction to Statistic.pptx
Ch # 1 Introduction to Statistic.pptxCh # 1 Introduction to Statistic.pptx
Ch # 1 Introduction to Statistic.pptx
 
statistics Lesson 1
statistics Lesson 1statistics Lesson 1
statistics Lesson 1
 
Bs1
Bs1Bs1
Bs1
 
Biostatistics ppt
Biostatistics  pptBiostatistics  ppt
Biostatistics ppt
 
Introduction to Statistics-prelimanary.pptx
Introduction to Statistics-prelimanary.pptxIntroduction to Statistics-prelimanary.pptx
Introduction to Statistics-prelimanary.pptx
 
Statistics for Data Analytics
Statistics for Data AnalyticsStatistics for Data Analytics
Statistics for Data Analytics
 
introduction to statistical theory
introduction to statistical theoryintroduction to statistical theory
introduction to statistical theory
 
1.-Lecture-Notes-in-Statistics-POWERPOINT.pptx
1.-Lecture-Notes-in-Statistics-POWERPOINT.pptx1.-Lecture-Notes-in-Statistics-POWERPOINT.pptx
1.-Lecture-Notes-in-Statistics-POWERPOINT.pptx
 
chap1.ppt
chap1.pptchap1.ppt
chap1.ppt
 
Qm 0809
Qm 0809 Qm 0809
Qm 0809
 
Types of Statistics.pptx
Types of Statistics.pptxTypes of Statistics.pptx
Types of Statistics.pptx
 
AF-20-Module.pdf
AF-20-Module.pdfAF-20-Module.pdf
AF-20-Module.pdf
 
Biostatisitics.pptx
Biostatisitics.pptxBiostatisitics.pptx
Biostatisitics.pptx
 
Topic 1 ELEMENTARY STATISTICS.pptx
Topic 1 ELEMENTARY STATISTICS.pptxTopic 1 ELEMENTARY STATISTICS.pptx
Topic 1 ELEMENTARY STATISTICS.pptx
 
BASIC CONCEPTS in STAT 1 [Autosaved].pptx
BASIC CONCEPTS in STAT 1 [Autosaved].pptxBASIC CONCEPTS in STAT 1 [Autosaved].pptx
BASIC CONCEPTS in STAT 1 [Autosaved].pptx
 
stat.pptx
stat.pptxstat.pptx
stat.pptx
 
Adv.-Statistics-2.pptx
Adv.-Statistics-2.pptxAdv.-Statistics-2.pptx
Adv.-Statistics-2.pptx
 
Chapter 1 and 2
Chapter 1 and 2 Chapter 1 and 2
Chapter 1 and 2
 
LEVEL OF MEASUREMENTS_2.ppt
LEVEL OF MEASUREMENTS_2.pptLEVEL OF MEASUREMENTS_2.ppt
LEVEL OF MEASUREMENTS_2.ppt
 
Introduction to basics of bio statistics.
Introduction to basics of bio statistics.Introduction to basics of bio statistics.
Introduction to basics of bio statistics.
 

Recently uploaded

Employee wellbeing at the workplace.pptx
Employee wellbeing at the workplace.pptxEmployee wellbeing at the workplace.pptx
Employee wellbeing at the workplace.pptxNirmalaLoungPoorunde1
 
Presiding Officer Training module 2024 lok sabha elections
Presiding Officer Training module 2024 lok sabha electionsPresiding Officer Training module 2024 lok sabha elections
Presiding Officer Training module 2024 lok sabha electionsanshu789521
 
Introduction to AI in Higher Education_draft.pptx
Introduction to AI in Higher Education_draft.pptxIntroduction to AI in Higher Education_draft.pptx
Introduction to AI in Higher Education_draft.pptxpboyjonauth
 
Q4-W6-Restating Informational Text Grade 3
Q4-W6-Restating Informational Text Grade 3Q4-W6-Restating Informational Text Grade 3
Q4-W6-Restating Informational Text Grade 3JemimahLaneBuaron
 
Crayon Activity Handout For the Crayon A
Crayon Activity Handout For the Crayon ACrayon Activity Handout For the Crayon A
Crayon Activity Handout For the Crayon AUnboundStockton
 
A Critique of the Proposed National Education Policy Reform
A Critique of the Proposed National Education Policy ReformA Critique of the Proposed National Education Policy Reform
A Critique of the Proposed National Education Policy ReformChameera Dedduwage
 
Concept of Vouching. B.Com(Hons) /B.Compdf
Concept of Vouching. B.Com(Hons) /B.CompdfConcept of Vouching. B.Com(Hons) /B.Compdf
Concept of Vouching. B.Com(Hons) /B.CompdfUmakantAnnand
 
Organic Name Reactions for the students and aspirants of Chemistry12th.pptx
Organic Name Reactions  for the students and aspirants of Chemistry12th.pptxOrganic Name Reactions  for the students and aspirants of Chemistry12th.pptx
Organic Name Reactions for the students and aspirants of Chemistry12th.pptxVS Mahajan Coaching Centre
 
Sanyam Choudhary Chemistry practical.pdf
Sanyam Choudhary Chemistry practical.pdfSanyam Choudhary Chemistry practical.pdf
Sanyam Choudhary Chemistry practical.pdfsanyamsingh5019
 
The basics of sentences session 2pptx copy.pptx
The basics of sentences session 2pptx copy.pptxThe basics of sentences session 2pptx copy.pptx
The basics of sentences session 2pptx copy.pptxheathfieldcps1
 
Incoming and Outgoing Shipments in 1 STEP Using Odoo 17
Incoming and Outgoing Shipments in 1 STEP Using Odoo 17Incoming and Outgoing Shipments in 1 STEP Using Odoo 17
Incoming and Outgoing Shipments in 1 STEP Using Odoo 17Celine George
 
The Most Excellent Way | 1 Corinthians 13
The Most Excellent Way | 1 Corinthians 13The Most Excellent Way | 1 Corinthians 13
The Most Excellent Way | 1 Corinthians 13Steve Thomason
 
BASLIQ CURRENT LOOKBOOK LOOKBOOK(1) (1).pdf
BASLIQ CURRENT LOOKBOOK  LOOKBOOK(1) (1).pdfBASLIQ CURRENT LOOKBOOK  LOOKBOOK(1) (1).pdf
BASLIQ CURRENT LOOKBOOK LOOKBOOK(1) (1).pdfSoniaTolstoy
 
Solving Puzzles Benefits Everyone (English).pptx
Solving Puzzles Benefits Everyone (English).pptxSolving Puzzles Benefits Everyone (English).pptx
Solving Puzzles Benefits Everyone (English).pptxOH TEIK BIN
 
Contemporary philippine arts from the regions_PPT_Module_12 [Autosaved] (1).pptx
Contemporary philippine arts from the regions_PPT_Module_12 [Autosaved] (1).pptxContemporary philippine arts from the regions_PPT_Module_12 [Autosaved] (1).pptx
Contemporary philippine arts from the regions_PPT_Module_12 [Autosaved] (1).pptxRoyAbrique
 
Arihant handbook biology for class 11 .pdf
Arihant handbook biology for class 11 .pdfArihant handbook biology for class 11 .pdf
Arihant handbook biology for class 11 .pdfchloefrazer622
 
Call Girls in Dwarka Mor Delhi Contact Us 9654467111
Call Girls in Dwarka Mor Delhi Contact Us 9654467111Call Girls in Dwarka Mor Delhi Contact Us 9654467111
Call Girls in Dwarka Mor Delhi Contact Us 9654467111Sapana Sha
 
MENTAL STATUS EXAMINATION format.docx
MENTAL     STATUS EXAMINATION format.docxMENTAL     STATUS EXAMINATION format.docx
MENTAL STATUS EXAMINATION format.docxPoojaSen20
 

Recently uploaded (20)

Employee wellbeing at the workplace.pptx
Employee wellbeing at the workplace.pptxEmployee wellbeing at the workplace.pptx
Employee wellbeing at the workplace.pptx
 
Staff of Color (SOC) Retention Efforts DDSD
Staff of Color (SOC) Retention Efforts DDSDStaff of Color (SOC) Retention Efforts DDSD
Staff of Color (SOC) Retention Efforts DDSD
 
Presiding Officer Training module 2024 lok sabha elections
Presiding Officer Training module 2024 lok sabha electionsPresiding Officer Training module 2024 lok sabha elections
Presiding Officer Training module 2024 lok sabha elections
 
Introduction to AI in Higher Education_draft.pptx
Introduction to AI in Higher Education_draft.pptxIntroduction to AI in Higher Education_draft.pptx
Introduction to AI in Higher Education_draft.pptx
 
Q4-W6-Restating Informational Text Grade 3
Q4-W6-Restating Informational Text Grade 3Q4-W6-Restating Informational Text Grade 3
Q4-W6-Restating Informational Text Grade 3
 
Crayon Activity Handout For the Crayon A
Crayon Activity Handout For the Crayon ACrayon Activity Handout For the Crayon A
Crayon Activity Handout For the Crayon A
 
A Critique of the Proposed National Education Policy Reform
A Critique of the Proposed National Education Policy ReformA Critique of the Proposed National Education Policy Reform
A Critique of the Proposed National Education Policy Reform
 
Concept of Vouching. B.Com(Hons) /B.Compdf
Concept of Vouching. B.Com(Hons) /B.CompdfConcept of Vouching. B.Com(Hons) /B.Compdf
Concept of Vouching. B.Com(Hons) /B.Compdf
 
Model Call Girl in Tilak Nagar Delhi reach out to us at 🔝9953056974🔝
Model Call Girl in Tilak Nagar Delhi reach out to us at 🔝9953056974🔝Model Call Girl in Tilak Nagar Delhi reach out to us at 🔝9953056974🔝
Model Call Girl in Tilak Nagar Delhi reach out to us at 🔝9953056974🔝
 
Organic Name Reactions for the students and aspirants of Chemistry12th.pptx
Organic Name Reactions  for the students and aspirants of Chemistry12th.pptxOrganic Name Reactions  for the students and aspirants of Chemistry12th.pptx
Organic Name Reactions for the students and aspirants of Chemistry12th.pptx
 
Sanyam Choudhary Chemistry practical.pdf
Sanyam Choudhary Chemistry practical.pdfSanyam Choudhary Chemistry practical.pdf
Sanyam Choudhary Chemistry practical.pdf
 
The basics of sentences session 2pptx copy.pptx
The basics of sentences session 2pptx copy.pptxThe basics of sentences session 2pptx copy.pptx
The basics of sentences session 2pptx copy.pptx
 
Incoming and Outgoing Shipments in 1 STEP Using Odoo 17
Incoming and Outgoing Shipments in 1 STEP Using Odoo 17Incoming and Outgoing Shipments in 1 STEP Using Odoo 17
Incoming and Outgoing Shipments in 1 STEP Using Odoo 17
 
The Most Excellent Way | 1 Corinthians 13
The Most Excellent Way | 1 Corinthians 13The Most Excellent Way | 1 Corinthians 13
The Most Excellent Way | 1 Corinthians 13
 
BASLIQ CURRENT LOOKBOOK LOOKBOOK(1) (1).pdf
BASLIQ CURRENT LOOKBOOK  LOOKBOOK(1) (1).pdfBASLIQ CURRENT LOOKBOOK  LOOKBOOK(1) (1).pdf
BASLIQ CURRENT LOOKBOOK LOOKBOOK(1) (1).pdf
 
Solving Puzzles Benefits Everyone (English).pptx
Solving Puzzles Benefits Everyone (English).pptxSolving Puzzles Benefits Everyone (English).pptx
Solving Puzzles Benefits Everyone (English).pptx
 
Contemporary philippine arts from the regions_PPT_Module_12 [Autosaved] (1).pptx
Contemporary philippine arts from the regions_PPT_Module_12 [Autosaved] (1).pptxContemporary philippine arts from the regions_PPT_Module_12 [Autosaved] (1).pptx
Contemporary philippine arts from the regions_PPT_Module_12 [Autosaved] (1).pptx
 
Arihant handbook biology for class 11 .pdf
Arihant handbook biology for class 11 .pdfArihant handbook biology for class 11 .pdf
Arihant handbook biology for class 11 .pdf
 
Call Girls in Dwarka Mor Delhi Contact Us 9654467111
Call Girls in Dwarka Mor Delhi Contact Us 9654467111Call Girls in Dwarka Mor Delhi Contact Us 9654467111
Call Girls in Dwarka Mor Delhi Contact Us 9654467111
 
MENTAL STATUS EXAMINATION format.docx
MENTAL     STATUS EXAMINATION format.docxMENTAL     STATUS EXAMINATION format.docx
MENTAL STATUS EXAMINATION format.docx
 

STAT 1 - Basic-Concepts-in-Statistics.pptx

  • 1. Basic Concepts in Statistics ......DownloadsY2Mate.is - Why You Need to Study Statistics-wV0Ks7aS7YI-720p-1647268556411.mp4
  • 2. • Why Study Statistics? • To evaluate printed numerical facts. • To interpret the results of sampling or to perform statistical analysis in your work • To make inferences about the population using information collected from the sample • What Do Statisticians Do? • Gather data • Summarize data • Analyze data • Draw conclusions and report the results of their analysis
  • 3. Statistics •A. Definition of Statistics • Plural sense – set of numerical figures e.g. number of students enrolled in every program in CPSU, vital statistics in a beauty contest • Singular sense – the branch of science that deals with the collection, presentation, organization, analysis, and interpretation of data (COPAI) •B. Key Terms • Population – (denoted by N) the collection of all elements under consideration • Sample – (denoted by n) a subset of the population
  • 4. Statistics •Example: • A manufacturer of kerosene heaters wants to determine if customers are satisfied with the performance of their heaters. Toward this goal, 5,000 out of 200,000 customers are contacted and each is asked, "Are you satisfied with the performance of the kerosene heater you purchased?" Identify the population and the sample for this situation. • Population: • The collection of 200,000 kerosene heater customers. • Sample: • The collection of 5,000 kerosene heater customers who were interviewed.
  • 5. Statistics •Variable – a characteristic or attribute of the elements in a collection that can assume different values for the different elements. • Example: Age, Weight, Height •Experimental unit is the individual or object on which a variable is measured. • Example: • Age (in years) of a freshman student • Weight (in kilograms) of mangoes harvested • Height (in inches) of a sugarcane plant in 3 months
  • 6. Statistics •Observation – realized value of a variable •Data – collection of observations VARIABLE POSSIBLE OBSERVATION a. S = sex of a student Male, Female b. C = course of a student AB Eng, AB Soc Sci, BS Stat c. L = amount spent on load per month 𝐿 ≥ 0 pesos d. N =number of enrolled students per campus n = 0, 1, 2, 3, … e. H = height of a volleyball player h > 0 cm
  • 7. Statistics •Parameter – a summary measure describing specific characteristic of the population usually denoted by Greek letters: μ (mu), σ (sigma), ρ (rho), λ (lambda), τ (tau), θ (theta), α (alpha) and β (beta) e.g. population mean, population variance •Statistic – a summary measure describing specific characteristic of the sample • e.g. sample mean, sample variance
  • 8.
  • 9. Statistics •Example: In order to estimate the true proportion of students at a certain college who smoke cigarettes, the administration polled a sample of 200 students and determined that the proportion of students from the sample who smoke cigarettes is 0.12. Identify the a) population, b) sample, c) parameter, and d) statistic. • a) Population: The set of students at a certain college. • b) Sample: The set of 200 students who were interviewed. • c) Parameter: The population proportion of students in a certain college who smoke cigarettes. • d) Statistic: (0.12) the proportion of students in the sample who smoke cigarettes.
  • 10. C. Fields of Statistics •1. Statistical Methods of Applied Statistics - procedures and techniques used in the collection, presentation, analysis and interpretation of data. •2. Statistical Theory of Mathematical Statistics - deals with the development and exposition of theories that serve as bases of statistical methods. • a. Descriptive Statistics – includes all the techniques used in organizing, summarizing, and presenting the data on hand. • b. Inferential Statistics – includes all the techniques used in analyzing the sample data that will lead to generalizations about a population from which the sample came from
  • 11. C. Fields of Statistics •Example Descriptive Inferential 1. A bowler wants to find his bowling average for the past 12 games. 1. A bowler wants to estimate his chance of winning a game based on his current season averages and the averages of his opponent. 2. A housewife wants to determine the average weekly amount she spent on groceries in the past three months. 2. A housewife would like to predict based on last year's grocery bills, the average weekly amount she will spend for this year. 3. A politician wants to know the exact number of votes he received in the last election. 3. A politician would like to estimate, based on an opinion poll, his chance of winning in the upcoming election.
  • 12. D. Measurement •Measurement - the process of determining the value or label of a variable based on what has been observed •Example: • Age (in years) • Weight (in kilograms) • Height (in inches) • Sex (Male or Female)
  • 13. Types of Variables •1. Qualitative variable •A variable that yields categorical response •Describes the quality or character of something • Example: Eye color, First Name, Favorite Movie •2. Quantitative Variable •A variable that takes on numerical values representing an amount or quantity •Describes the amount or number of something • Example: Weight, Height, Number of cars
  • 14. Types of Variables •a. Discrete - a variable which can assume finite, or, at most, countably infinite number of values; usually measured by counting or enumeration. •Can assume only certain values, and there are usually gaps between values. •Example: Number of students enrolled in GEC 4, Number of cars parked at the front of Admin building
  • 15. Types of Variables •b. Continuous - a variable which can assume infinitely many values corresponding to a line interval without gaps, interruptions, or jumps. •Can assume any value within a specified range. •Measurable (measured using a continuous scale such as kilos, centimeters, grams) •Example: Height in inches, Income in pesos, Weight in kilograms
  • 16. Levels of Measurement •1. Nominal Level (Classificatory Scale) •The nominal level is the weakest level of measurement where numbers or symbols are used simply for categorizing subjects into different groups. The categories must be distinct, non-overlapping and exhaustive •Examples: Sex M-Male F-Female • Marital status 1-Single 2-Married 3-Widowed 4-Separated
  • 17. Levels of Measurement •Interval Level – is that which has the properties of the nominal and ordinal levels, and in addition, the distances between any two numbers on the scale are of known sizes. An interval scale must have a common and constant unit of measurement. Furthermore, the unit of measurement is arbitrary and there is no “true zero” point. •Examples: • IQ • Test Result
  • 18. Levels of Measurement •4. Ratio Level - measurement contains all the properties of the interval level, and in addition, it has a “true zero” point. This is the strongest level of measurement. •Examples: • Daily Allowance • Weight (in kg) • Age (in years) • Number of correct answers in an exam
  • 19. Let’s try this •I. In the following situations, let’s determine the population, sample, parameter and statistic. •1. In order to estimate the true proportion of students at a certain college who smoke cigarettes, the administration polled a sample of 200 students and determined that the proportion of students from the sample who smoke cigarettes is 0.12. • Identify the • a) variable, b) population, • c) sample, d) parameter, and e) statistic.
  • 20. Let’s try this •Solution: •a. Variable: Whether or not a student smoke •b. Population: The set of students at a certain college. •c. Sample: The set of 200 students who were interviewed. •d. Parameter: The population proportion of students in a certain college who smoke cigarettes. •e. Statistic: (0.12) the proportion of students in the sample who smoke cigarettes.
  • 21. Let’s try this • 2. A politician who is running for the office of mayor of a city with 25,000 registered voters commissions on a survey. In the survey, 48% of the 200 registered voters interviewed say they plan to vote for her. • Solution: a. Variable: Whether or not a voter will vote the running political for Mayor b. Population: The group of 25,000 registered voters c. Sample: The group of 200 registered voters who were interviewed d. Parameter: The percentage of registered voters in the population who plan to vote for her. e. Statistic: (48%) The percentage of registered voters in the sample who plan to vote for her.
  • 22. Let’s try this • II. Let’s determine whether the following statements belong to the field of descriptive statistics or inferential statistics. • 1. A badminton player wants to know his average score for the past 10 games. • Solution: Descriptive statistics (Data is only gathered and summarized) • 2. Janine wants to determine the variability of her six exam scores in algebra. • Solution: Descriptive statistics (Data is only gathered and summarized) • 3. Based on last year’s electricity bills, Mrs. Venegas would like to forecast the average monthly electricity bill she will pay for the next year based on her average monthly bill in the past year. • Solution: Inferential statistics (Data is analyzed to make a forecast)
  • 23. Let’s try this • III. Let’s classify the following by a) type of variable and b) level of measurement. If the variable is quantitative, determine whether it is discrete or continuous. Types of Variable Level of Measurement Example: Degree Program (AB Social Science, AB English Language, BS Statistics) Qualitative Nominal Example: Weight of women (in kg) before they took the diet Quantitative, Continuous Ratio 1. Height (in inches) 2. Sizes of shirts (i.e. XS, S, M, L, XL) 3. Zipcode (i.e. 6111 – Kabankalan) 4. Civil Status 5. Number of siblings
  • 24. Let’s try this • III. Let’s classify the following by a) type of variable and b) level of measurement. If the variable is quantitative, determine whether it is discrete or continuous. •Solution: • 1) Quantitative, Continuous, Ratio • 2) Qualitative, Ordinal • 3) Qualitative, Nominal • 4) Qualitative, Nominal • 5) Quantitative, Discrete, Ratio
  • 25. Let’s Try Some More •I. In the following situation, let’s determine the variable, population, sample, parameter and statistic. •Mr. Donaldo Chan, a candidate for Vice Mayor in Orion, Bataan wants to find out if there is a need to intensify his campaign efforts against his opponents. He requested the services of a group of students to interview 1,000 of the 3,000 registered voters of Orion, Bataan. The survey results showed that 75% of the 1,000 voters in the sample will vote for him as vice-mayor. Identify the following.
  • 26. Let’s Try Some More •I. In the following situation, let’s determine the variable, population, sample, parameter and statistic. a. Variable: Whether or not a voter will vote for Mr. Chan as Vice Mayor b. Population: The collection of 3,000 registered voters of Orion, Batangas c. Sample: The collection of 1,000 registered voters of Orion, Batangas d. Parameter: The percentage of registered voters in the population who voted for Mr. Chan as Vice-Mayor e. Statistic: The percentage of registered voters in the sample who voted for Mr. Chan as Vice-Mayor
  • 27. Let’s Try Some More •II. Let’s determine whether the following statements belong to the field of descriptive statistics or inferential statistics. a. A car manufacturer wishes to estimate the average lifetime of batteries by testing a sample of 50 batteries. Answer: _________ b. A shipping company wishes to estimate the number of passengers traveling via their ships next year using their data on the number of passengers in the past three years. Answer: __________________ c. A marketing research group wishes to determine the number of families not eating three times a day in the sample used for their survey. Answer: ________________ d. A politician wants to determine the total number of votes his rival obtained in the past election based on his copies of the tally sheet of electoral returns Answer: __________ e. A politician wants to determine the total number of votes his rival obtained in the sample used in the exit poll. Answer: _________________
  • 28. Let’s Try Some More •III. Let’s classify the following by a) type of variable and b) level of measurement. If the variable is quantitative, determine whether it is discrete or continuous. Type of Variable Level of Measurement Example: Weight of women (in kg) before they took the diet Quantitative, Continuous Ratio 1. Score in a ten-item quiz 2. Teacher’s performance rating (Excellent, Very Good, Good, Satisfactory, Needs Improvement) 3. Total kilos of papaya harvests 4. Brand of cellphone 5. Body Temperature (in Celsius)
  • 29. End of this topic