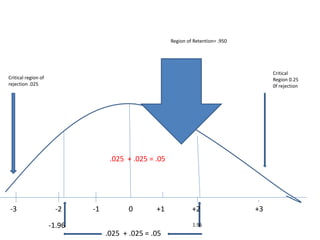
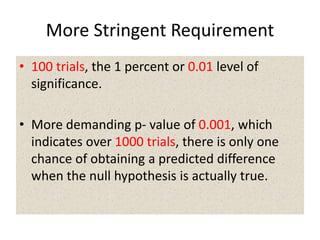
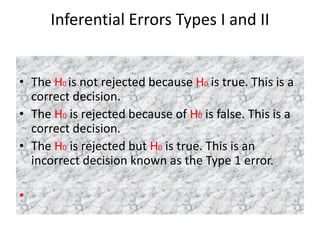
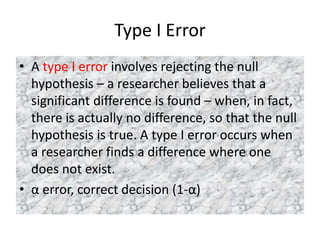
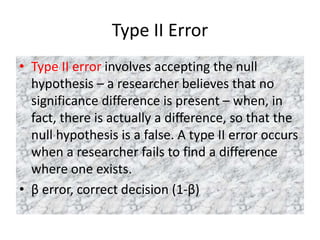
P-Value
Desmond Ayim-Aboagye, Ph.D.
Significance Level
P-Value
• When a statistic is said to be significant at the 0.05
level, for example, the likelihood that the difference it
detected is due to chance (i.e., random error) is less
than 1 in 20.
• In other words, if the experimenter were repeated 100
times, we would expect to observe the same results by
chance– not due to the effect an independent variable
exerts on a dependent measure– 5 time or less.
• No difference is deemed to be reliable one unless it
reaches or is still lower than this conventional 5
percent mark or 0.05 level of significance.
.025 + .025 = .05
-3 -2 -1 0 +1 +2 +3
Critical
Region 0.25
0f rejection
Region of Retention= .950
Critical region of
rejection .025
.025 + .025 = .05
-1.96 1.96
A critical value
• A critical value is a numerical value that is
compared to the value of a calculated test
statistic. When a test statistic is less than a
critical value, the null hypothesis is accepted
or retained. When a test statistic is equal to or
higher than a critical value, then the null
hypothesis is rejected.
A critical value
It is a cut off, a guide to whether a test
statistic is or is not significant
0 +1.0 +1.67 +2.0
Fig. 9.4. One-tailed critical values and critical regions of Two Z
Distributions
-2.0 -1.67 -1.0 0
Fig. 9.4. One-tailed critical values and critical regions of Two Z
Distributions
Two-tailed Significance Test
Two-tailed Significance Tests
promote rigor, as well as satisfy
curiosity when predictions go awry.
Degree of Freedom
• It is a statistical concept
• The degree of freedom in any set of data are the
number of scores that are free to take on any
value once some statistical test is performed.
• It can be known by taking the total number of
available values , that is, SAMPLE SIZE, and then
subtracting the number of population parameters
that will be estimated from the sample.
More Stringent Requirement
• 100 trials, the 1 percent or 0.01 level of
significance.
• More demanding p- value of 0.001, which
indicates over 1000 trials, there is only one
chance of obtaining a predicted difference
when the null hypothesis is actually true.
Most Behavioural Scientists
• Most researchers choose to use .05 level of
significance as the minimum acceptable level
of significance.
• P-values
• P < .05
• P < .01
• P < .001
Inferential Errors Types I and II
• The H0 is not rejected because H0 is true. This is a
correct decision.
• The H0 is rejected because of H0 is false. This is a
correct decision.
• The H0 is rejected but H0 is true. This is an
incorrect decision known as the Type 1 error.
•
Type I Error
• A type I error involves rejecting the null
hypothesis – a researcher believes that a
significant difference is found – when, in fact,
there is actually no difference, so that the null
hypothesis is true. A type I error occurs when
a researcher finds a difference where one
does not exist.
• α error, correct decision (1-α)
Type II Error
• Type II error involves accepting the null
hypothesis – a researcher believes that no
significance difference is present – when, in
fact, there is actually a difference, so that the
null hypothesis is a false. A type II error occurs
when a researcher fails to find a difference
where one exists.
• β error, correct decision (1-β)

Null hypothesis 2

  • 1.
  • 2.
    P-Value • When astatistic is said to be significant at the 0.05 level, for example, the likelihood that the difference it detected is due to chance (i.e., random error) is less than 1 in 20. • In other words, if the experimenter were repeated 100 times, we would expect to observe the same results by chance– not due to the effect an independent variable exerts on a dependent measure– 5 time or less. • No difference is deemed to be reliable one unless it reaches or is still lower than this conventional 5 percent mark or 0.05 level of significance.
  • 3.
    .025 + .025= .05 -3 -2 -1 0 +1 +2 +3 Critical Region 0.25 0f rejection Region of Retention= .950 Critical region of rejection .025 .025 + .025 = .05 -1.96 1.96
  • 4.
    A critical value •A critical value is a numerical value that is compared to the value of a calculated test statistic. When a test statistic is less than a critical value, the null hypothesis is accepted or retained. When a test statistic is equal to or higher than a critical value, then the null hypothesis is rejected.
  • 5.
    A critical value Itis a cut off, a guide to whether a test statistic is or is not significant
  • 6.
    0 +1.0 +1.67+2.0 Fig. 9.4. One-tailed critical values and critical regions of Two Z Distributions
  • 7.
    -2.0 -1.67 -1.00 Fig. 9.4. One-tailed critical values and critical regions of Two Z Distributions
  • 8.
    Two-tailed Significance Test Two-tailedSignificance Tests promote rigor, as well as satisfy curiosity when predictions go awry.
  • 9.
    Degree of Freedom •It is a statistical concept • The degree of freedom in any set of data are the number of scores that are free to take on any value once some statistical test is performed. • It can be known by taking the total number of available values , that is, SAMPLE SIZE, and then subtracting the number of population parameters that will be estimated from the sample.
  • 10.
    More Stringent Requirement •100 trials, the 1 percent or 0.01 level of significance. • More demanding p- value of 0.001, which indicates over 1000 trials, there is only one chance of obtaining a predicted difference when the null hypothesis is actually true.
  • 11.
    Most Behavioural Scientists •Most researchers choose to use .05 level of significance as the minimum acceptable level of significance. • P-values • P < .05 • P < .01 • P < .001
  • 12.
    Inferential Errors TypesI and II • The H0 is not rejected because H0 is true. This is a correct decision. • The H0 is rejected because of H0 is false. This is a correct decision. • The H0 is rejected but H0 is true. This is an incorrect decision known as the Type 1 error. •
  • 13.
    Type I Error •A type I error involves rejecting the null hypothesis – a researcher believes that a significant difference is found – when, in fact, there is actually no difference, so that the null hypothesis is true. A type I error occurs when a researcher finds a difference where one does not exist. • α error, correct decision (1-α)
  • 14.
    Type II Error •Type II error involves accepting the null hypothesis – a researcher believes that no significance difference is present – when, in fact, there is actually a difference, so that the null hypothesis is a false. A type II error occurs when a researcher fails to find a difference where one exists. • β error, correct decision (1-β)