Download as PDF, PPTX

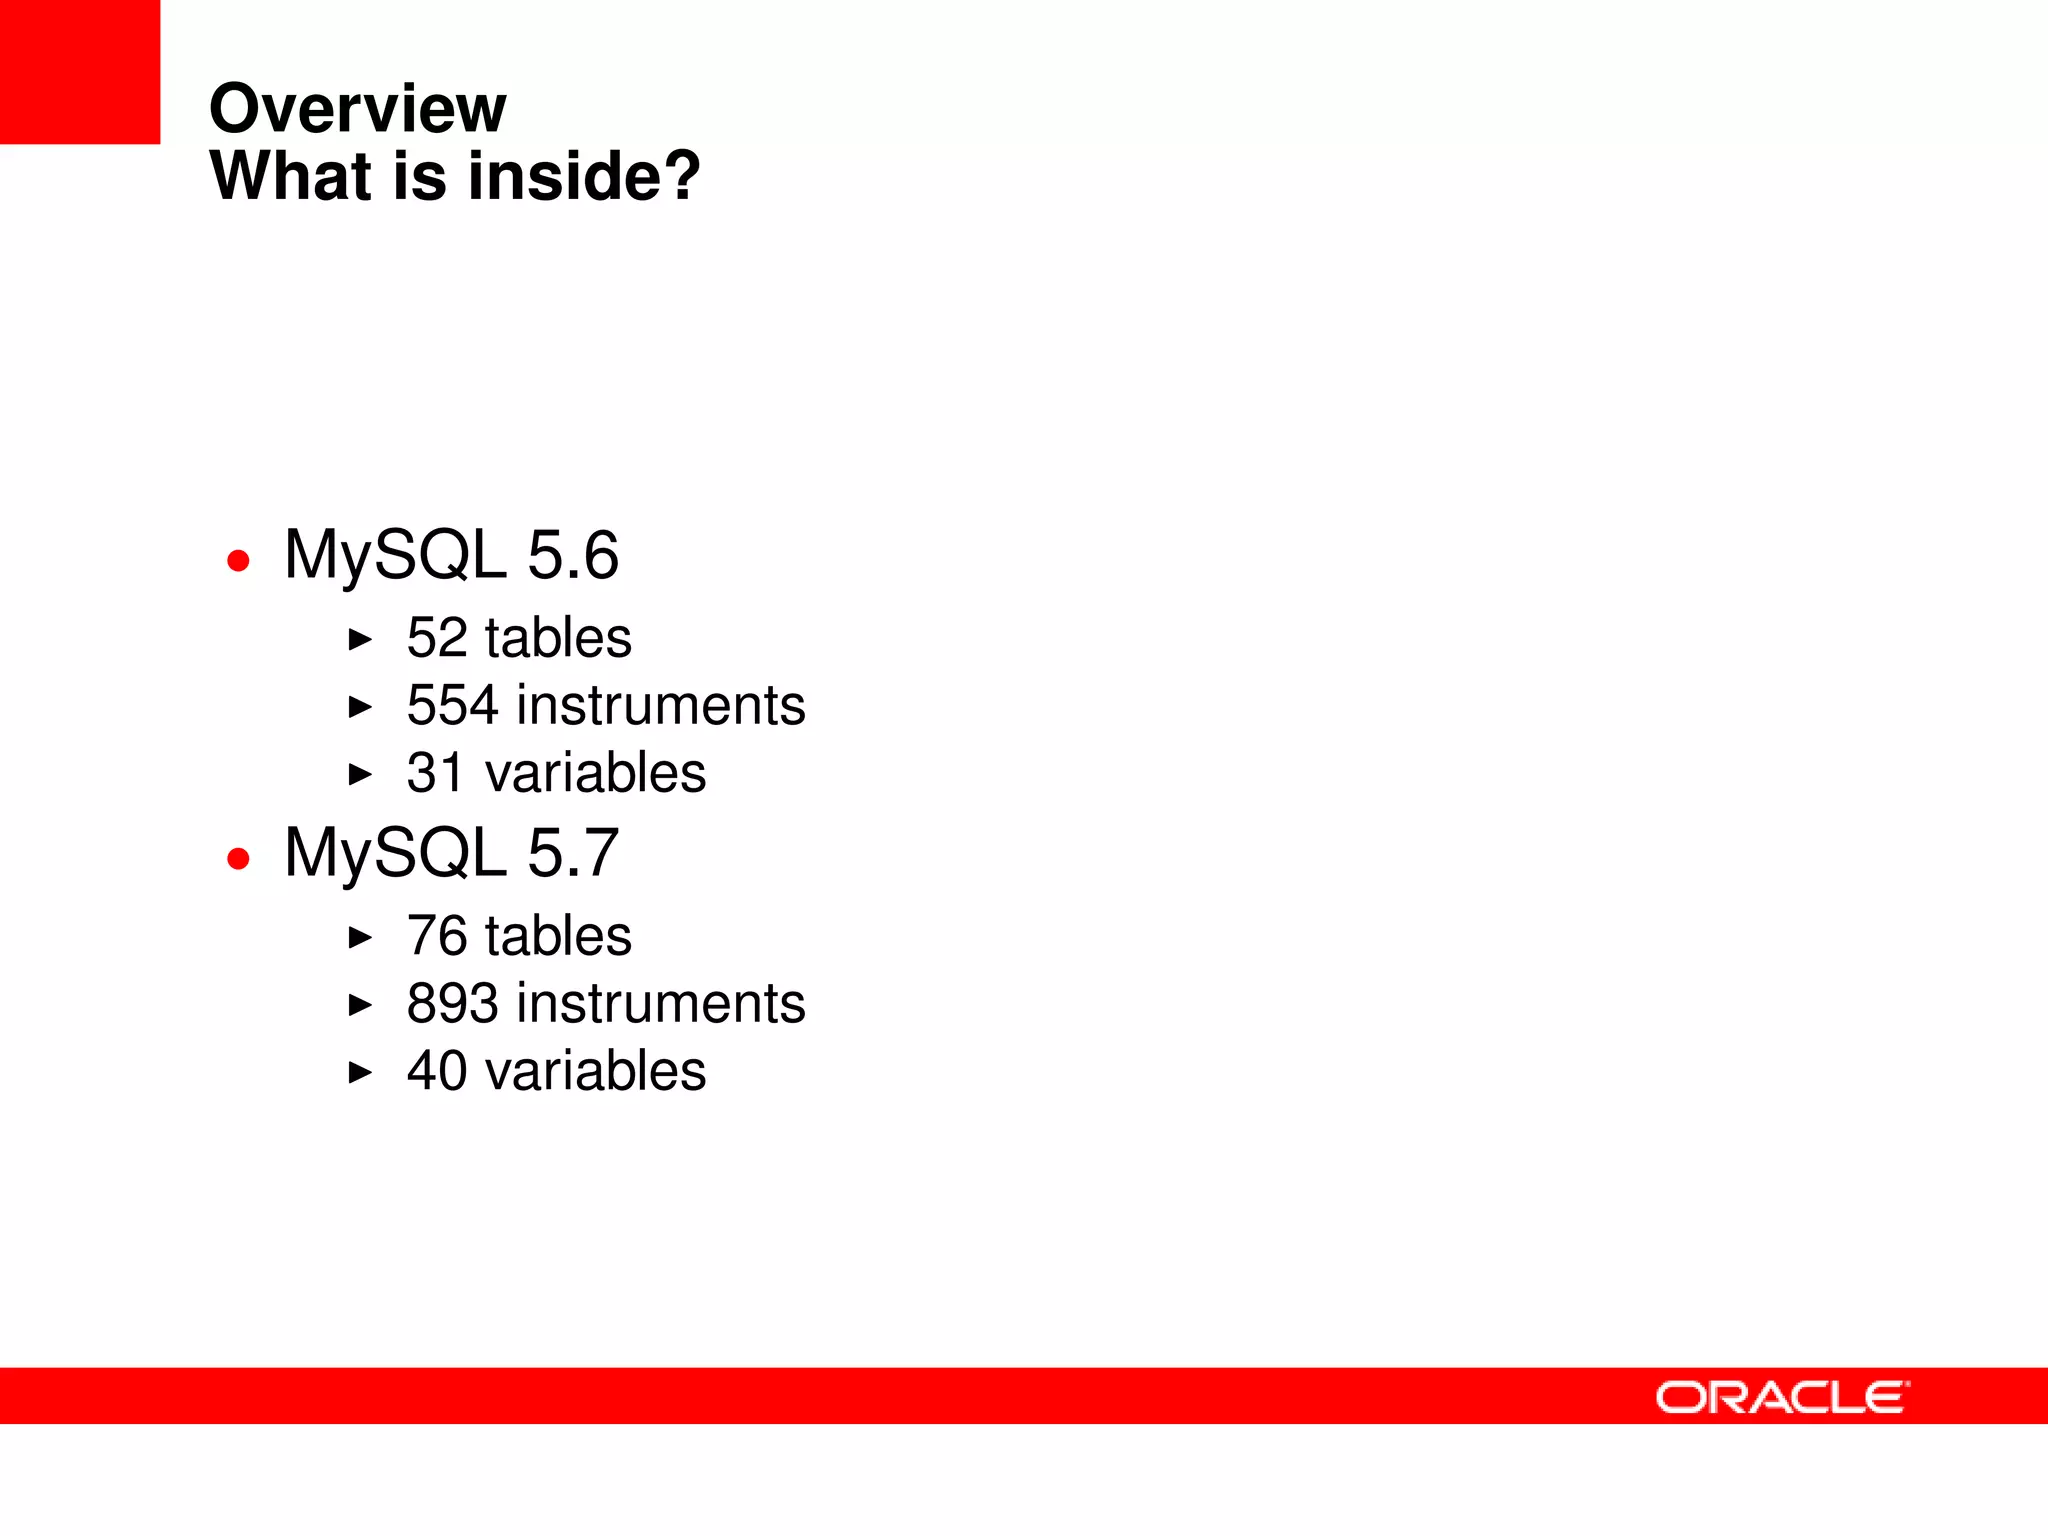
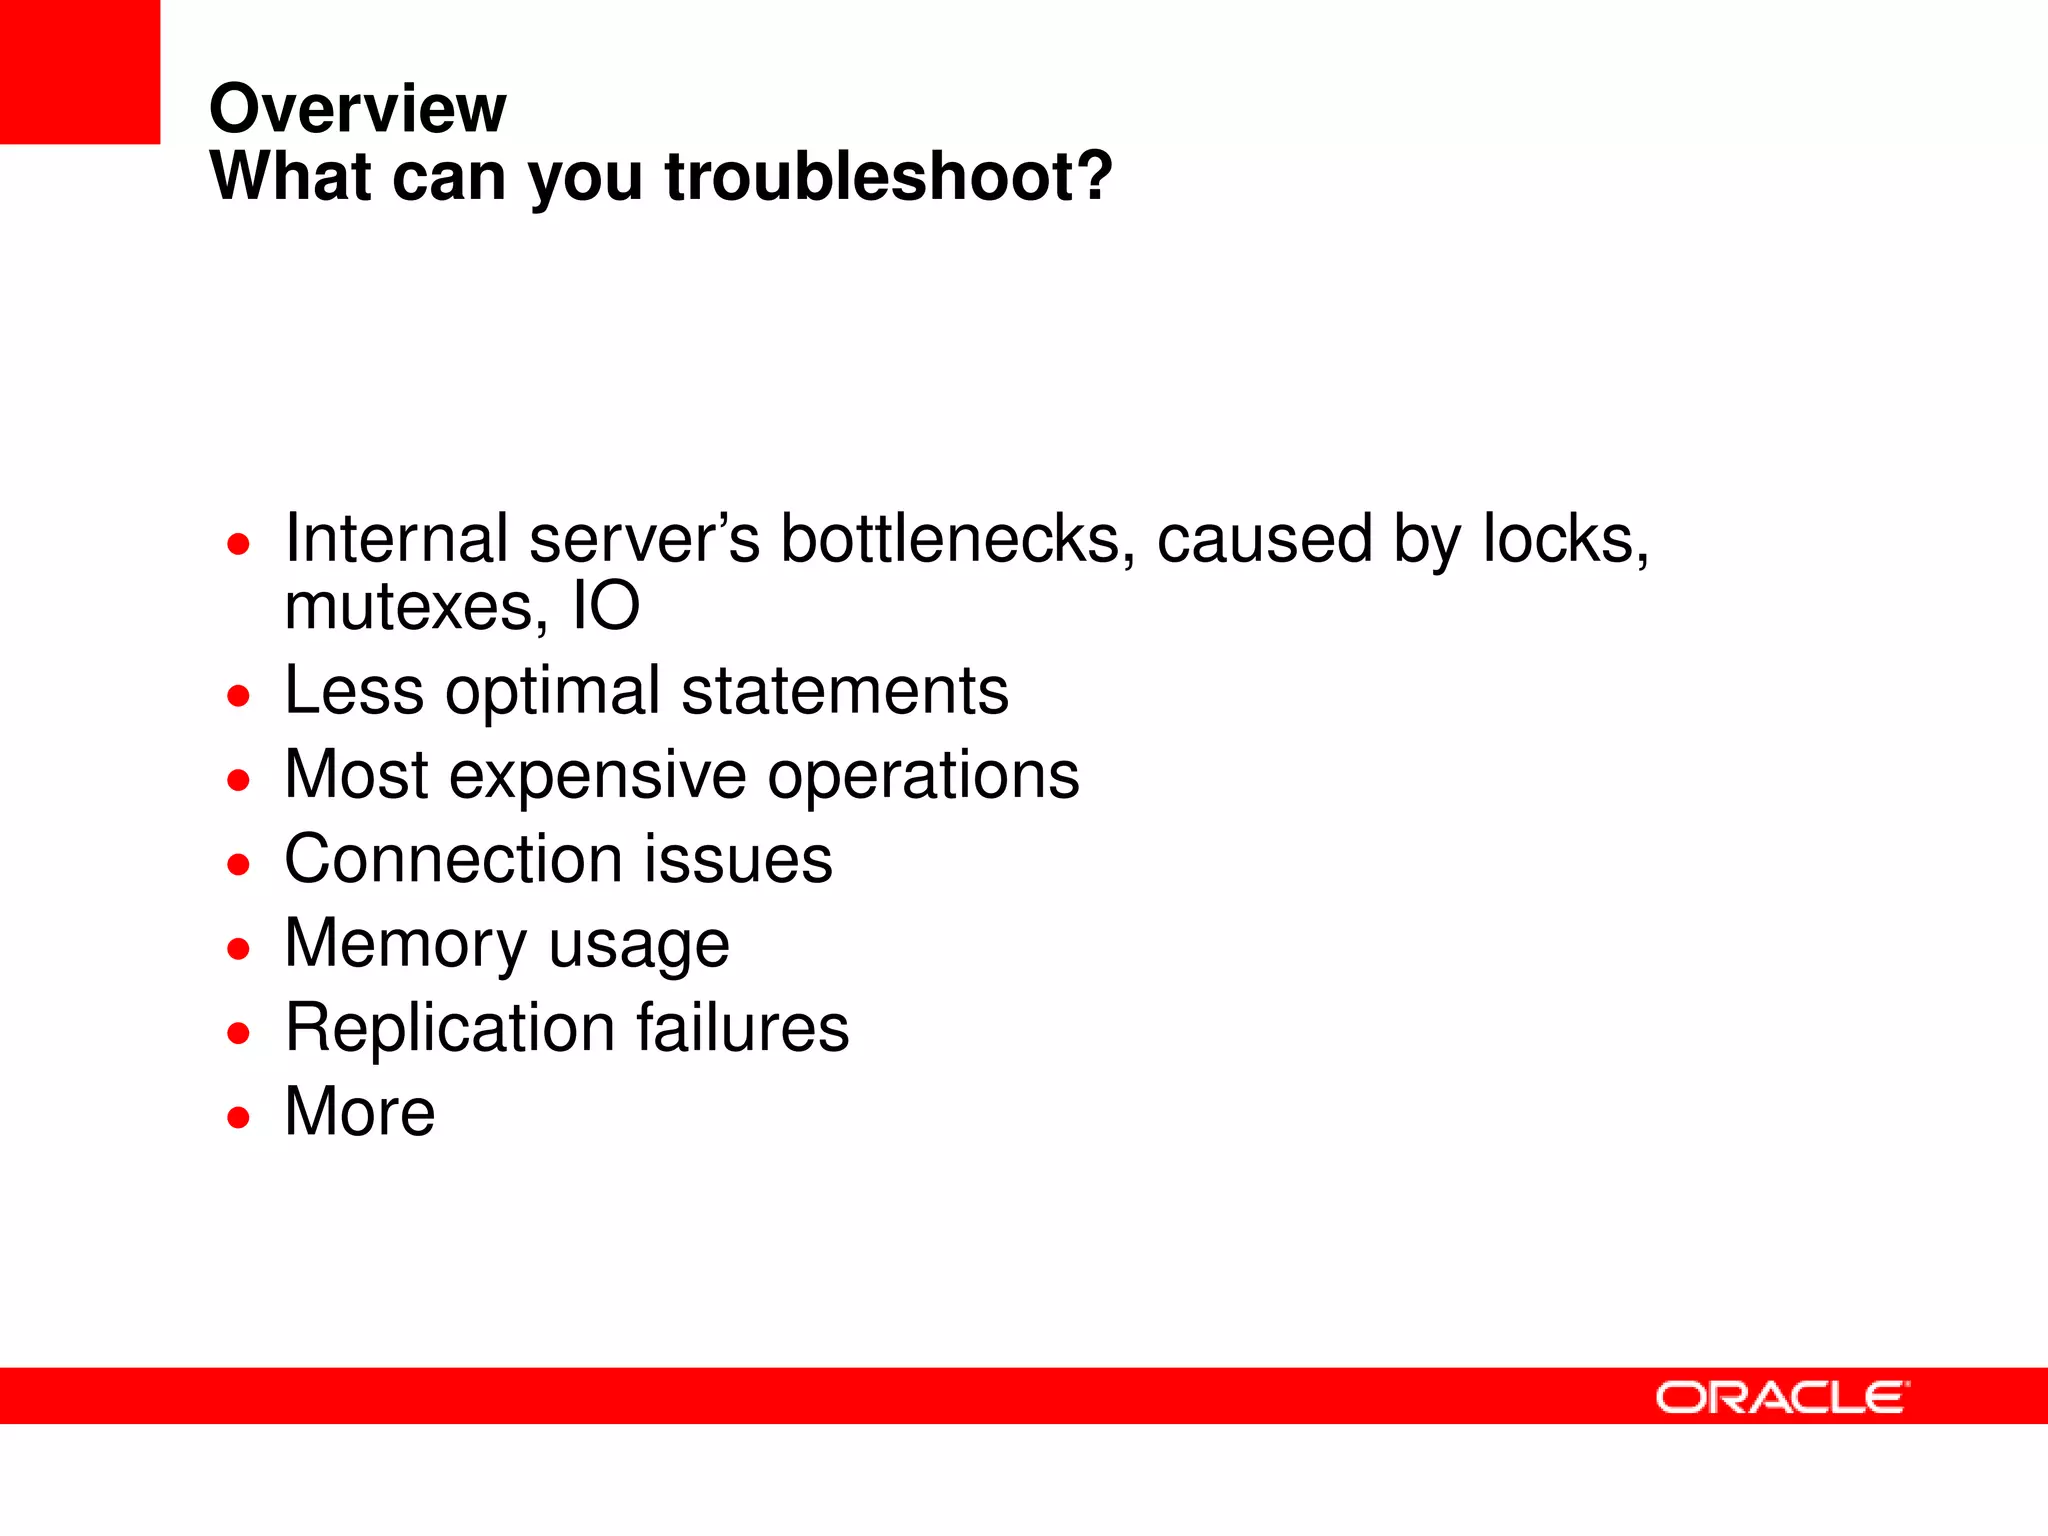
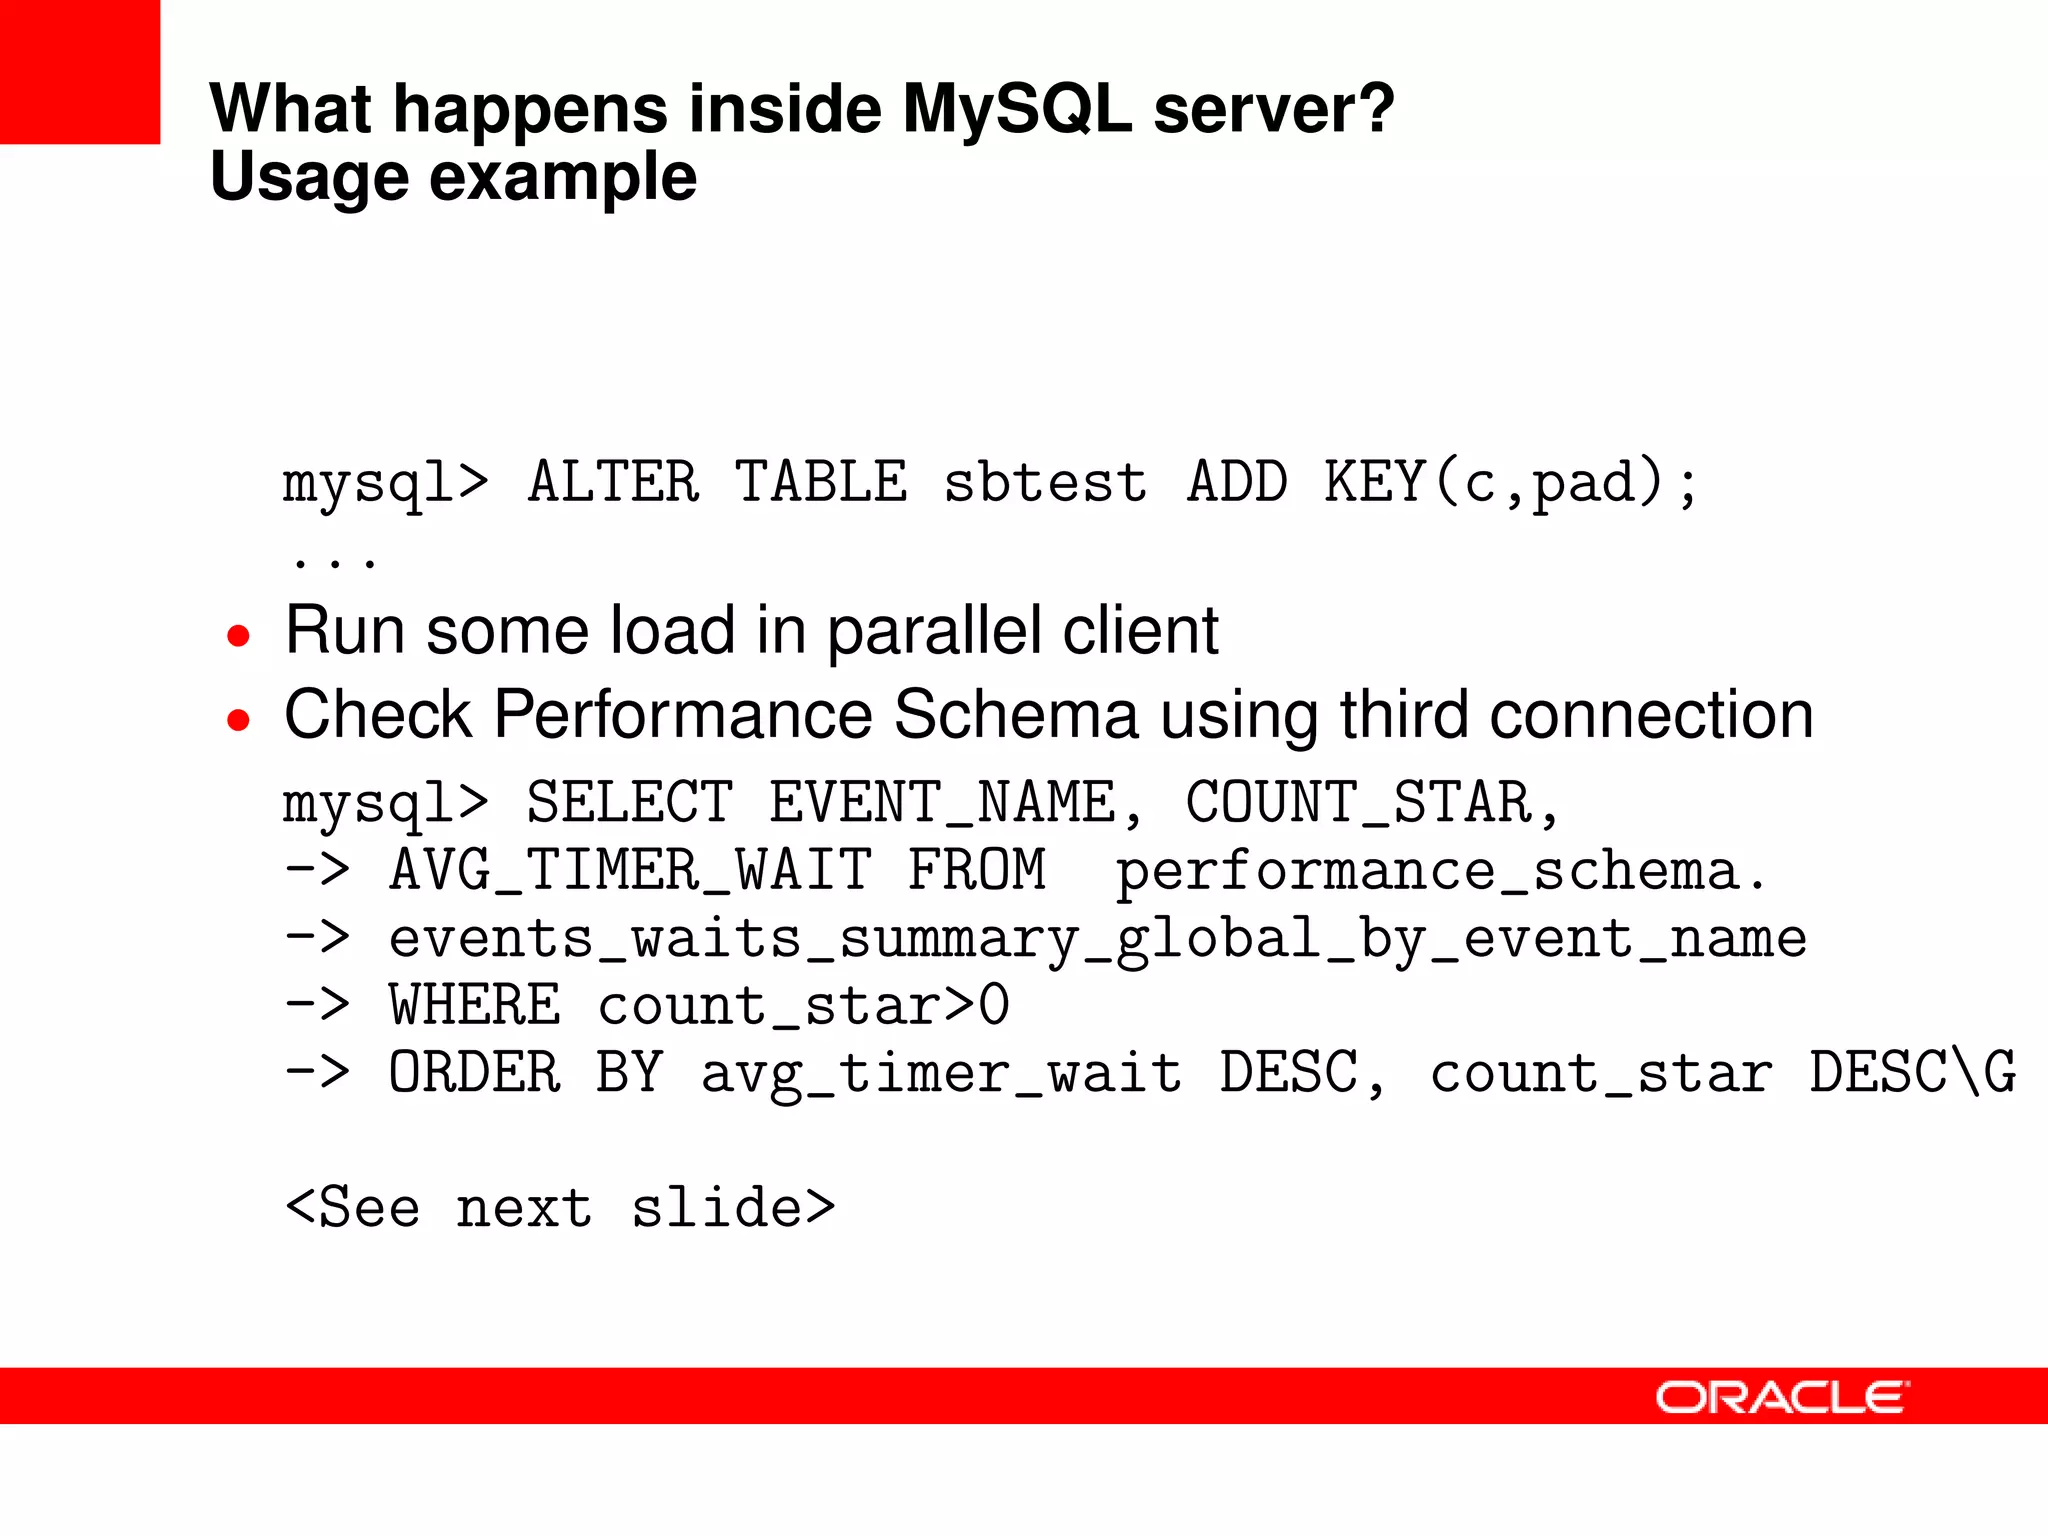
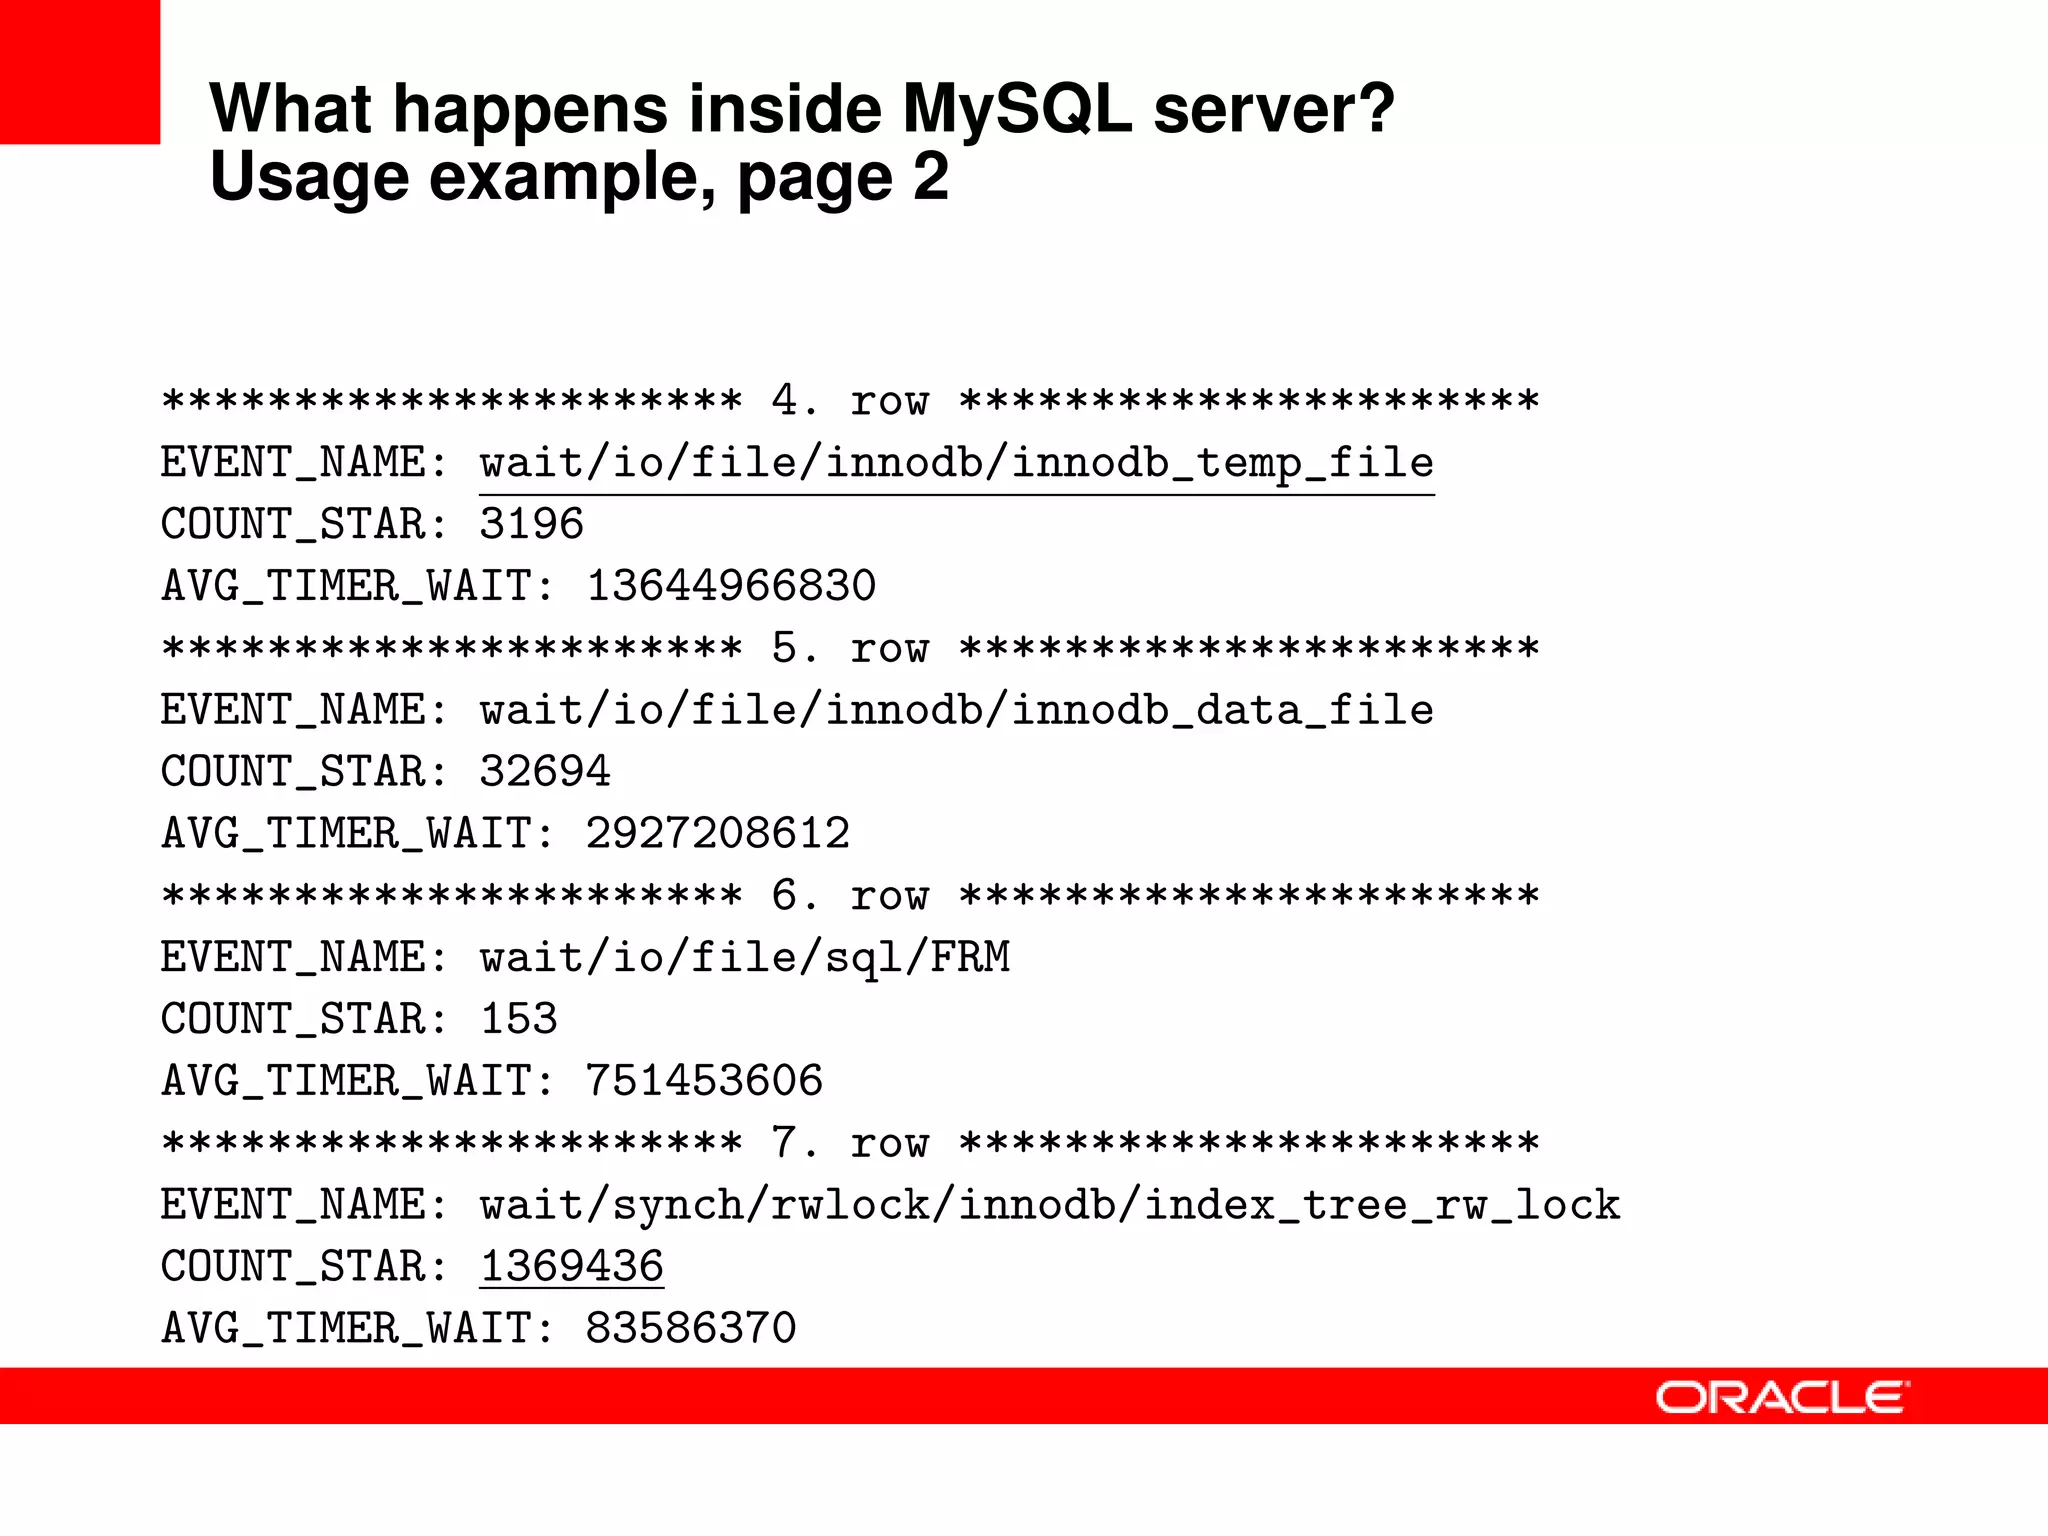
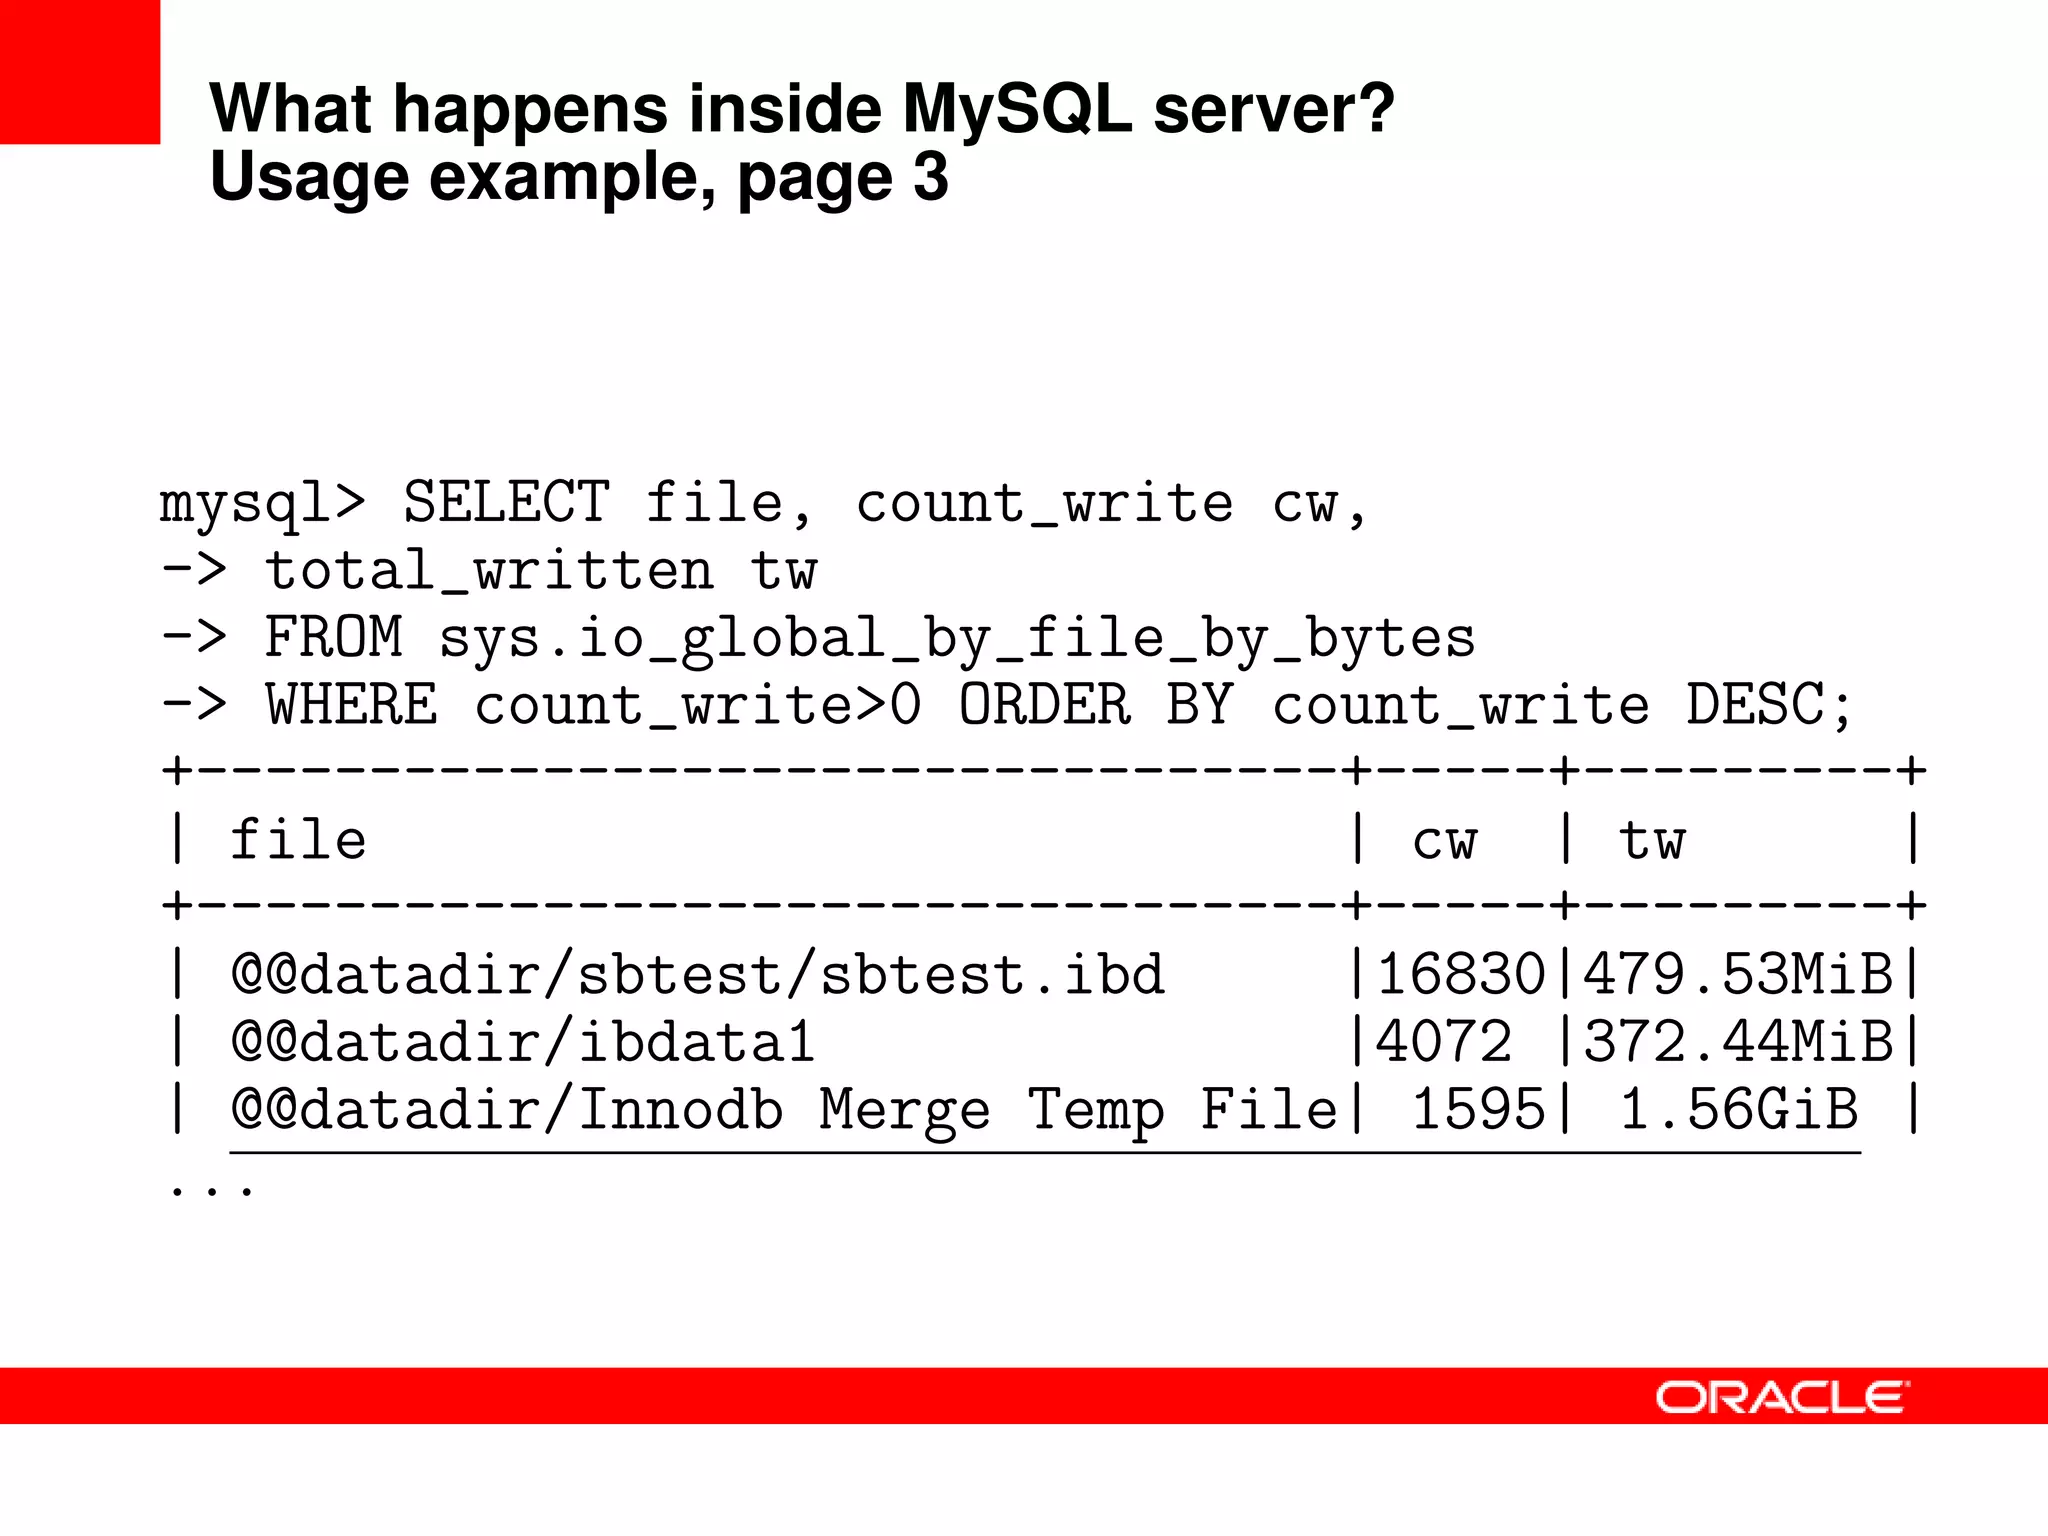
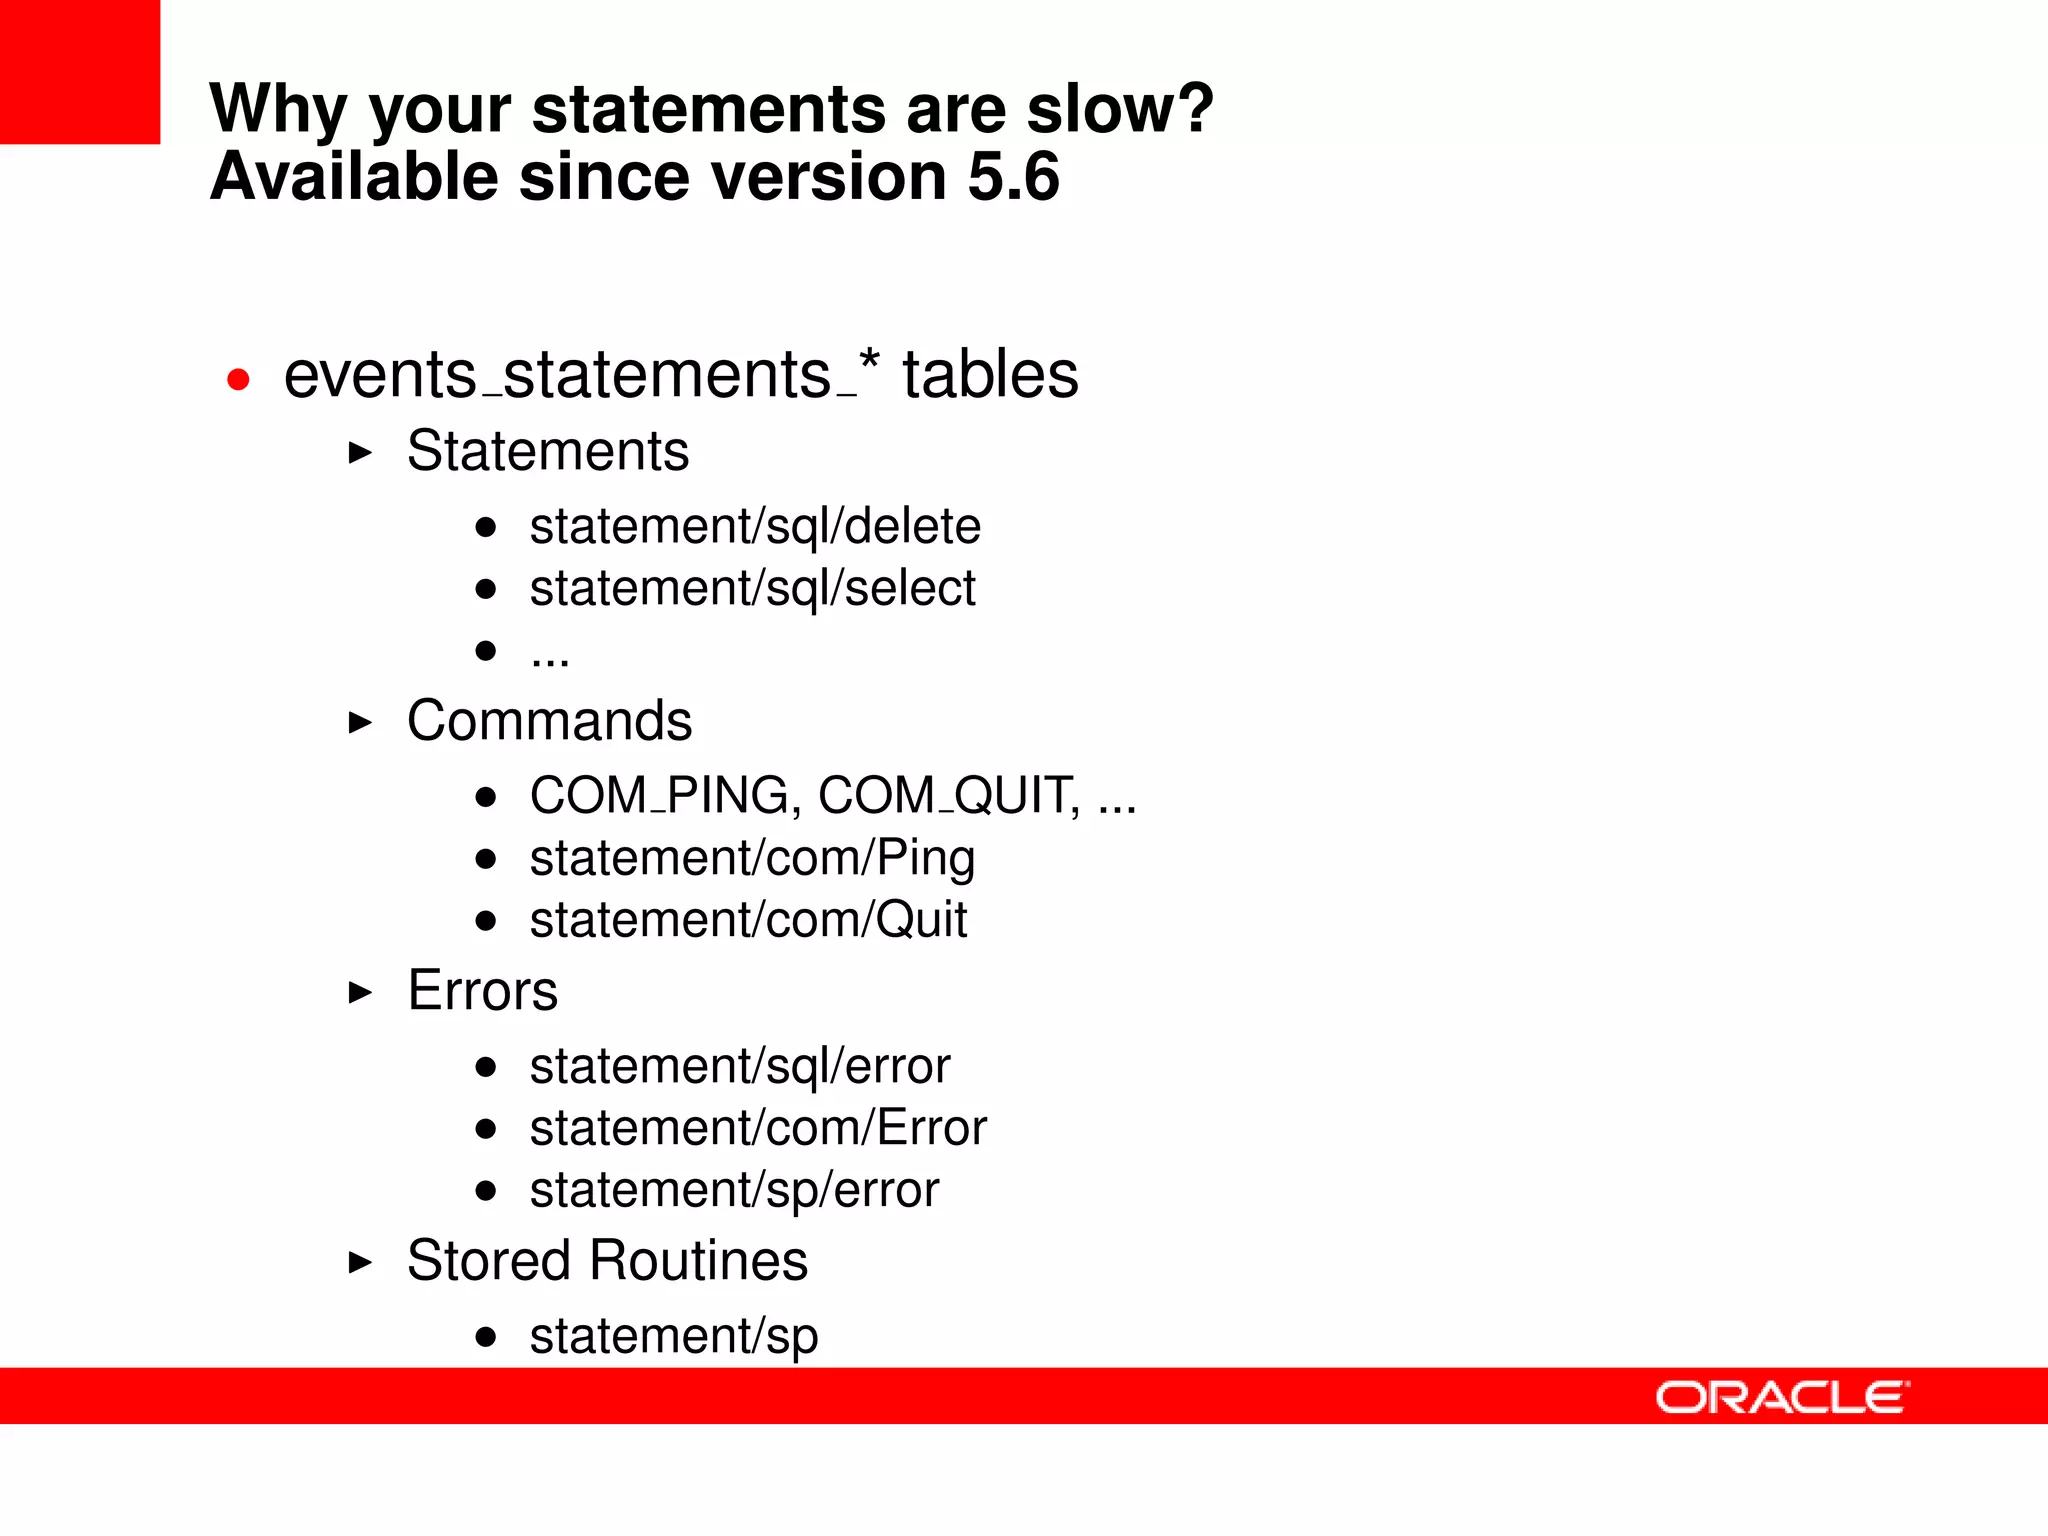
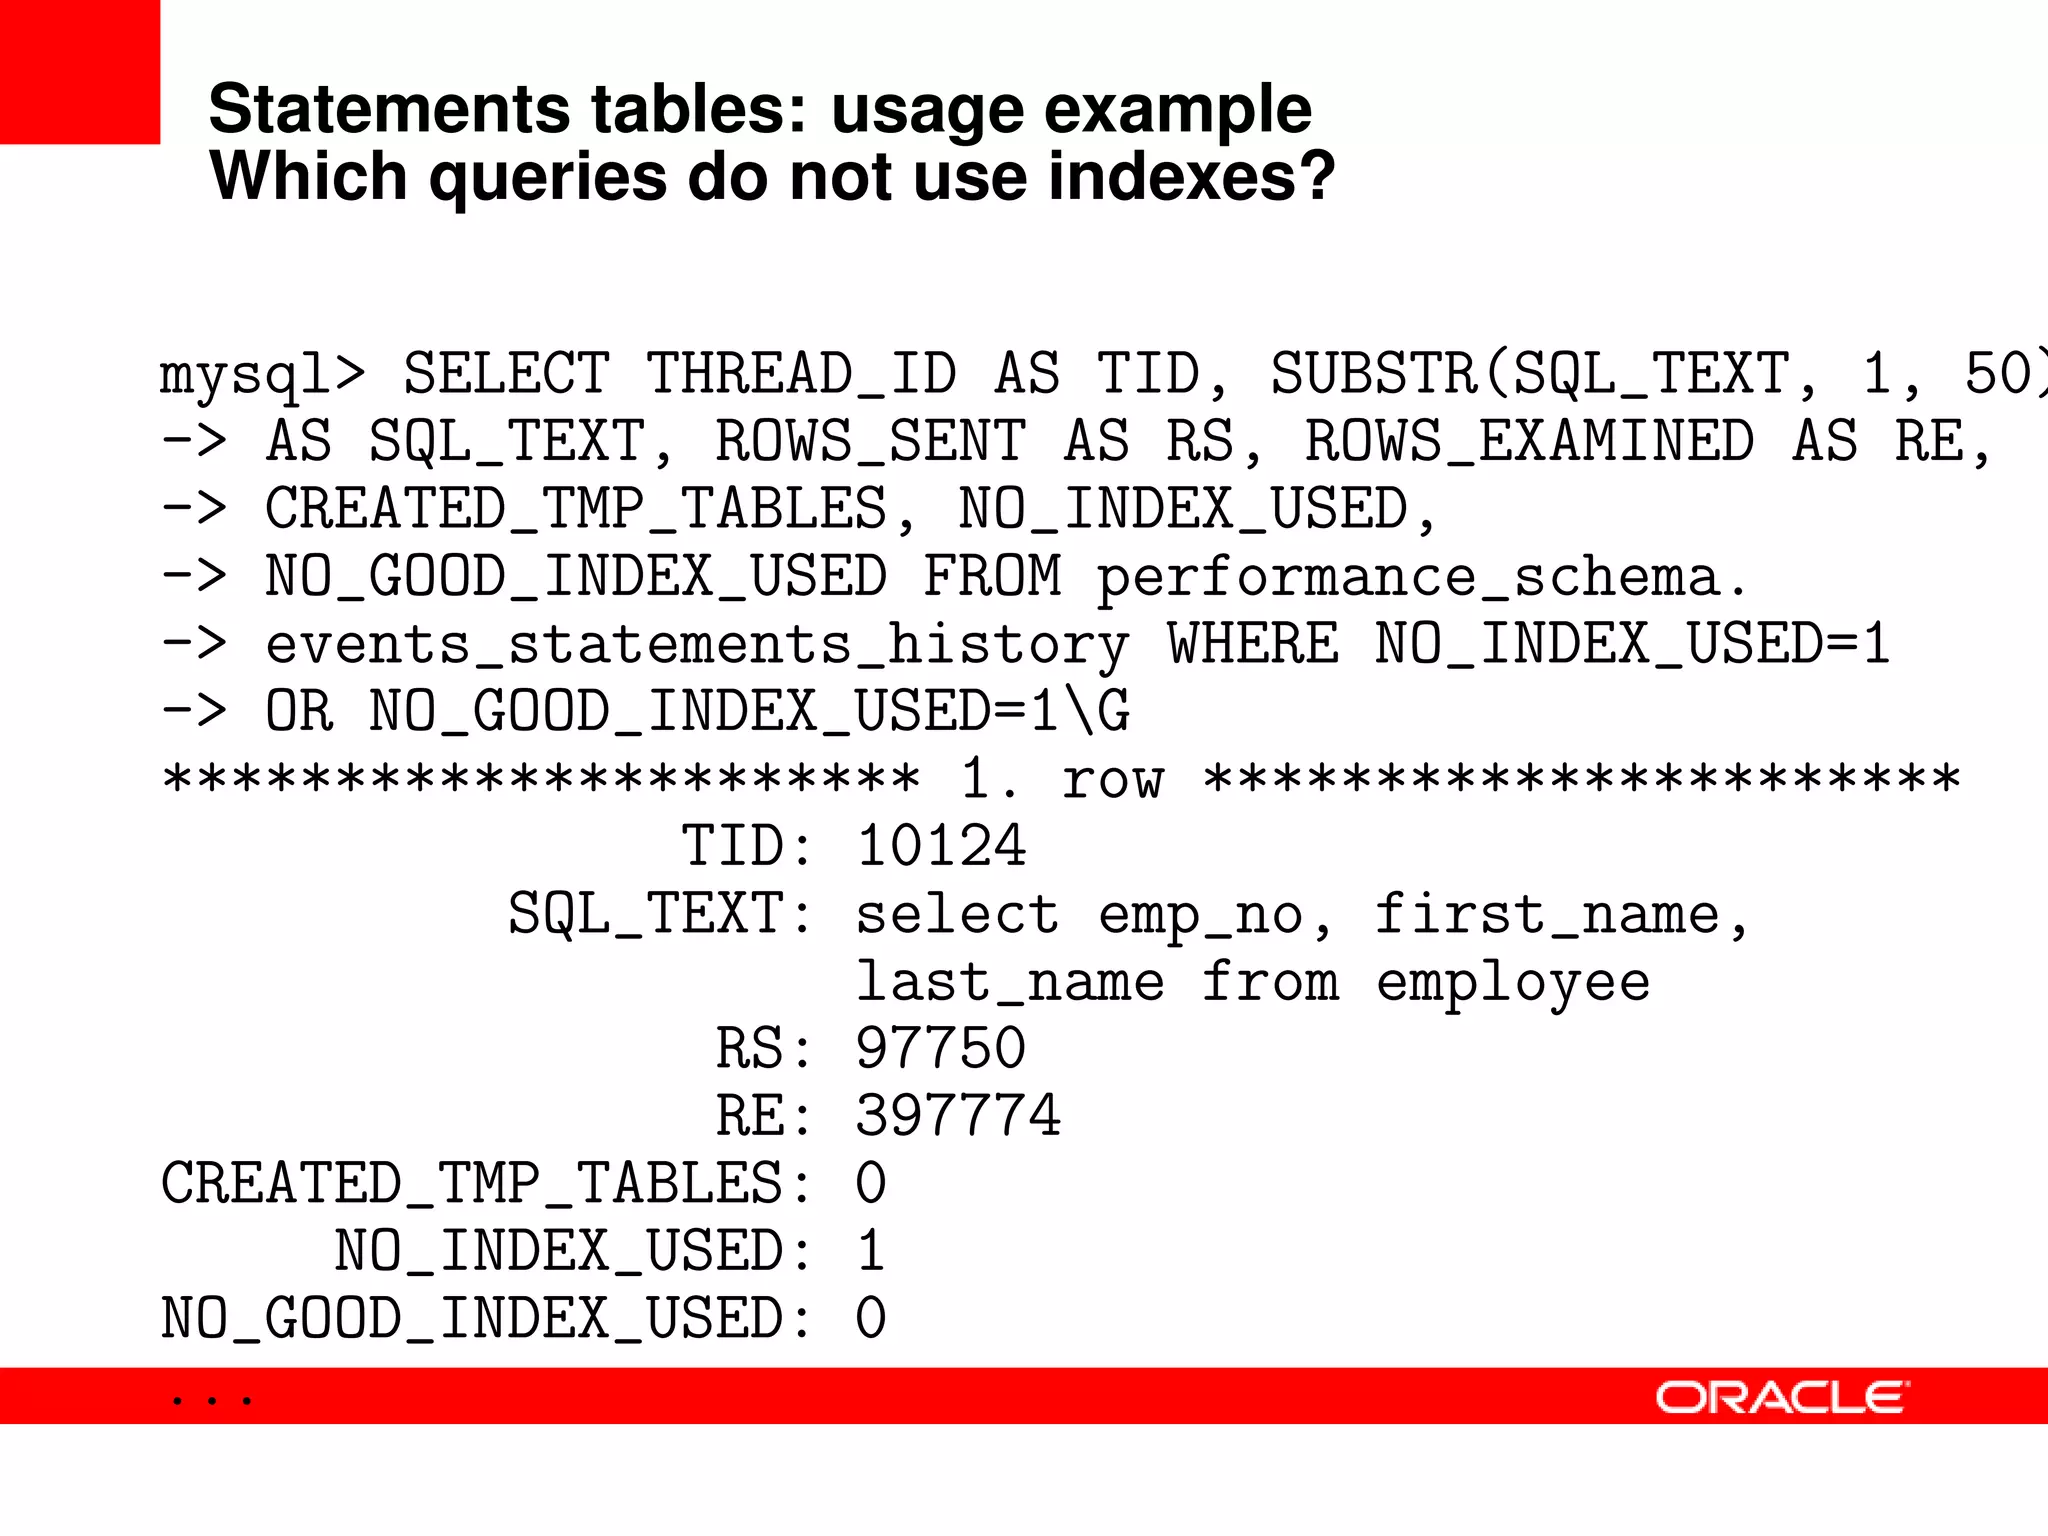
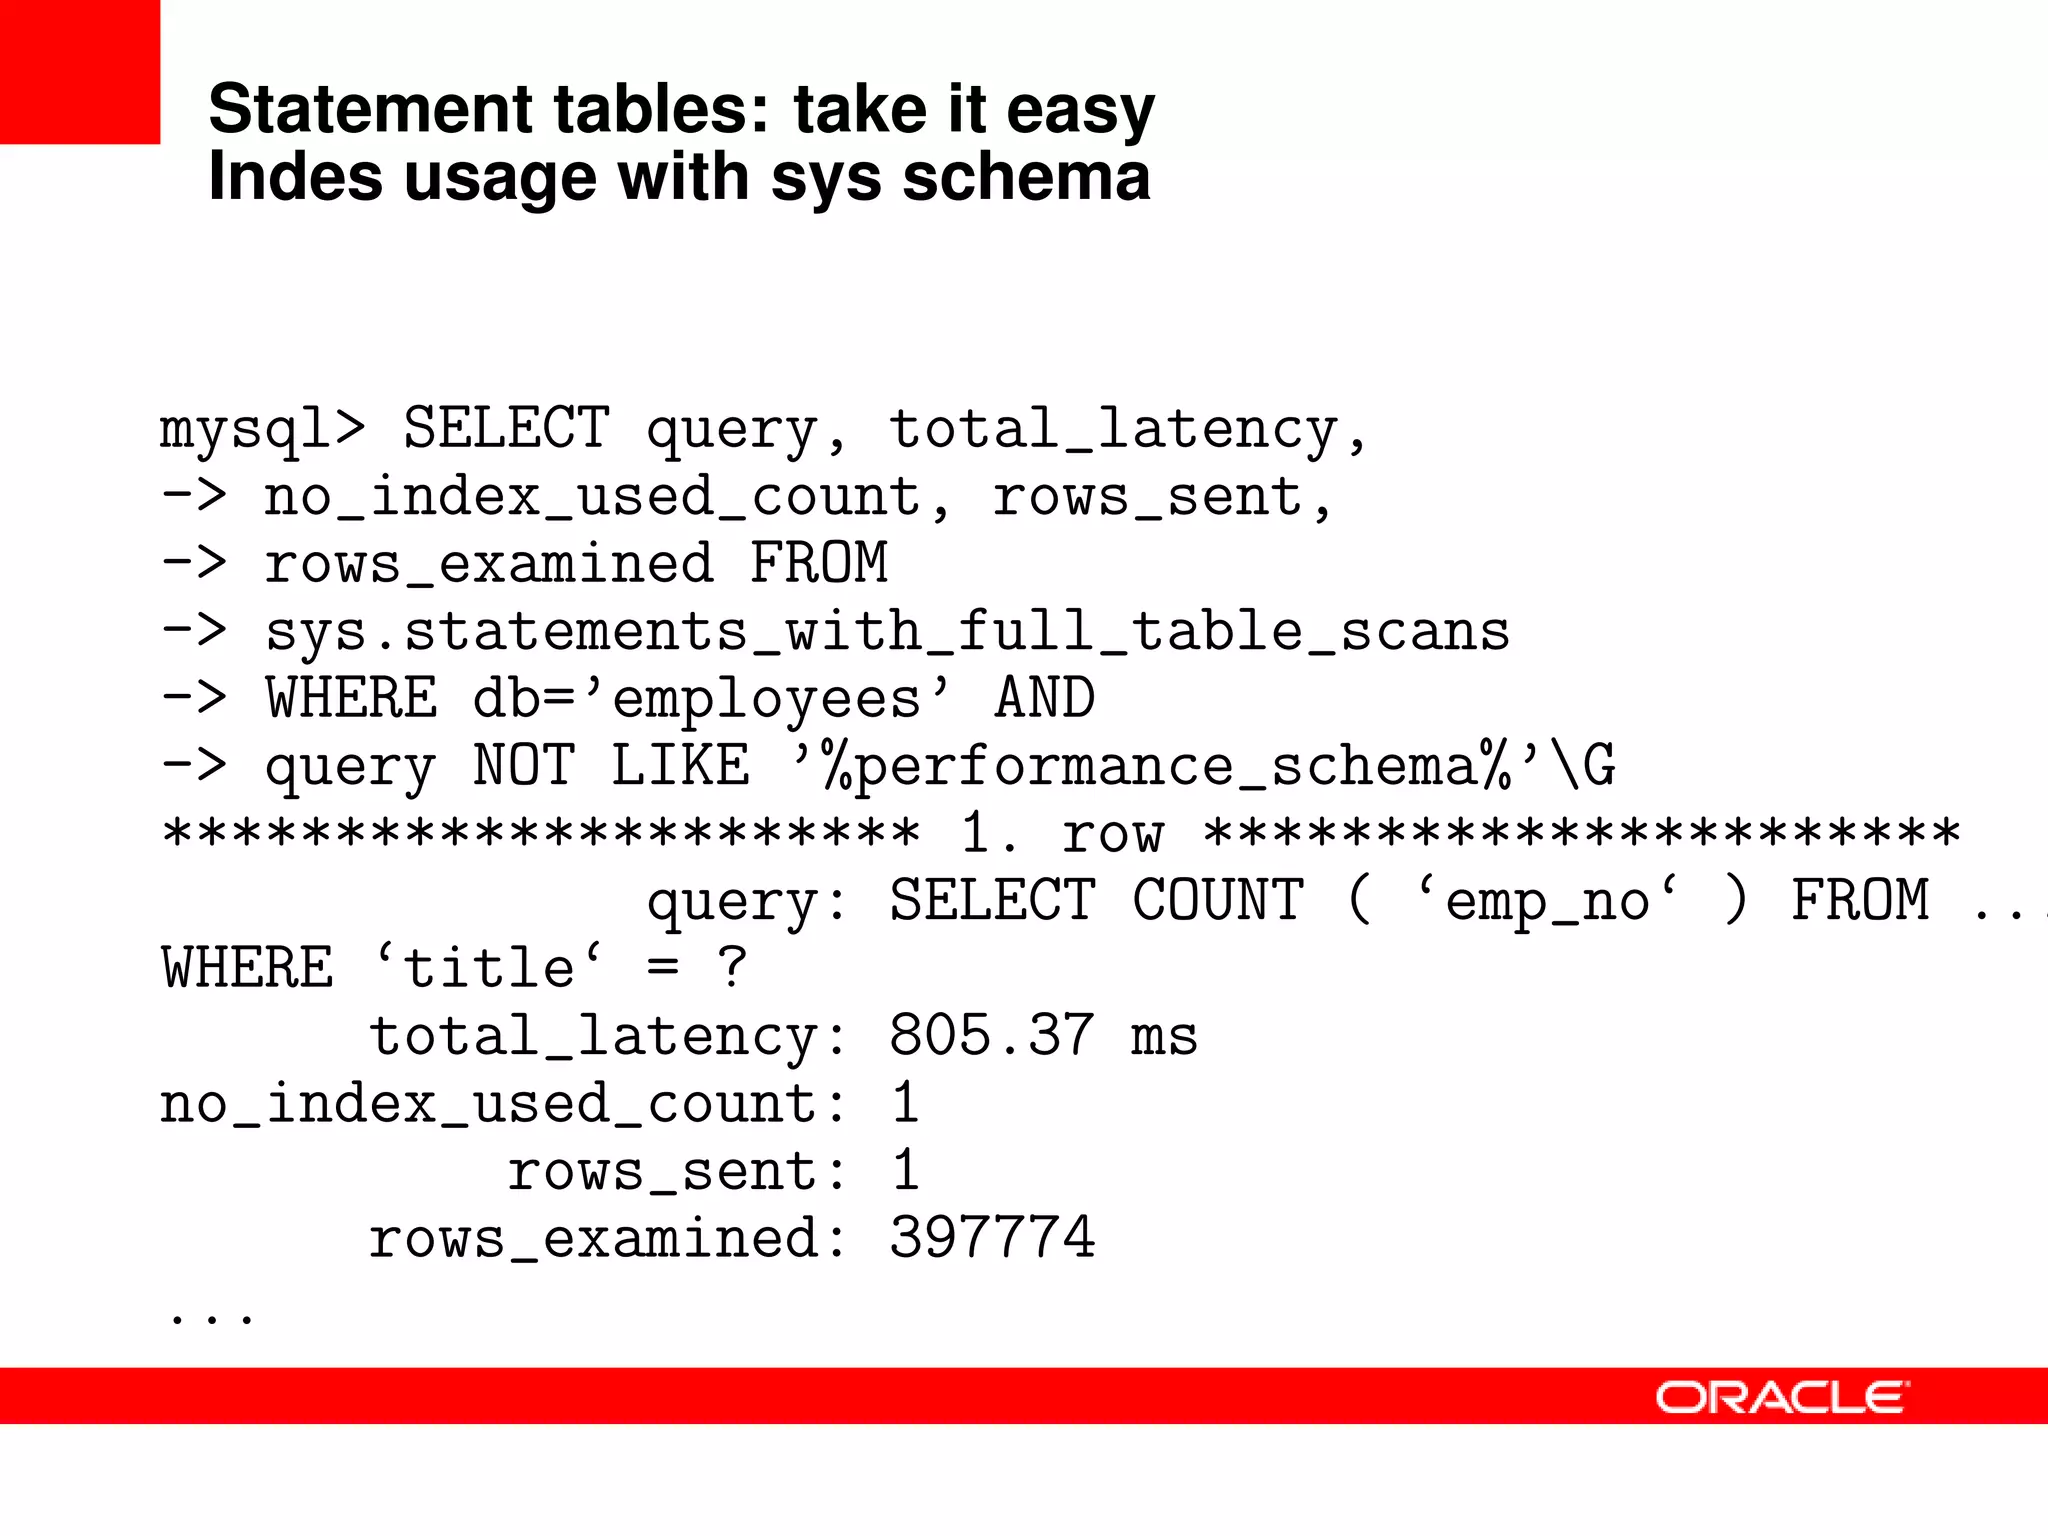
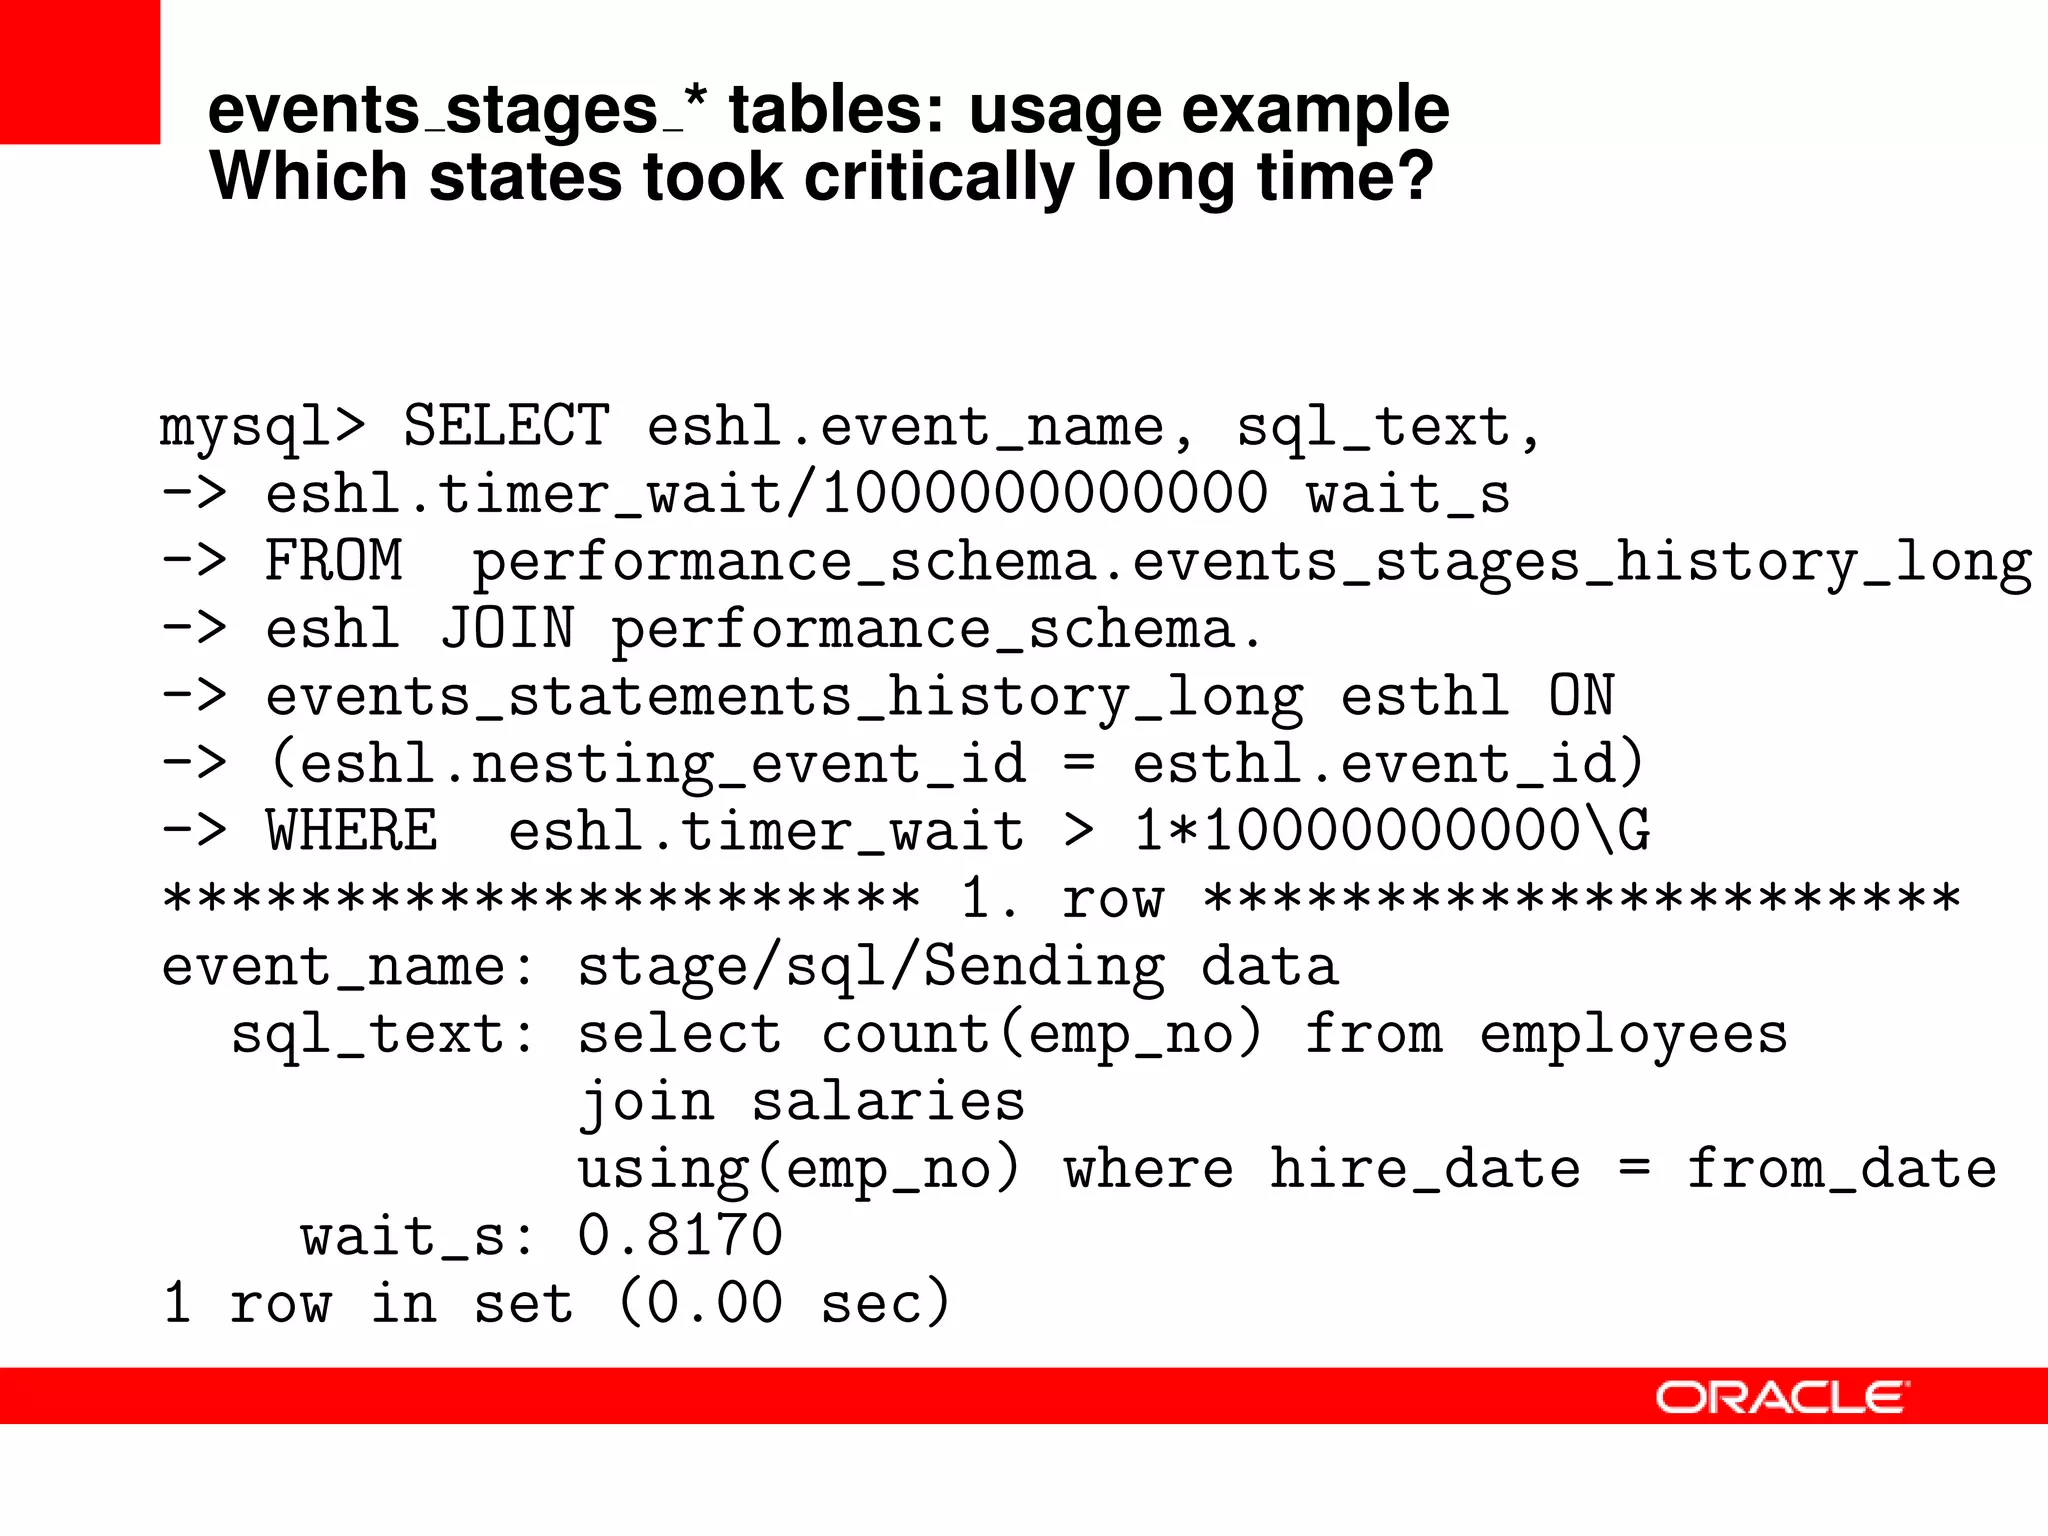
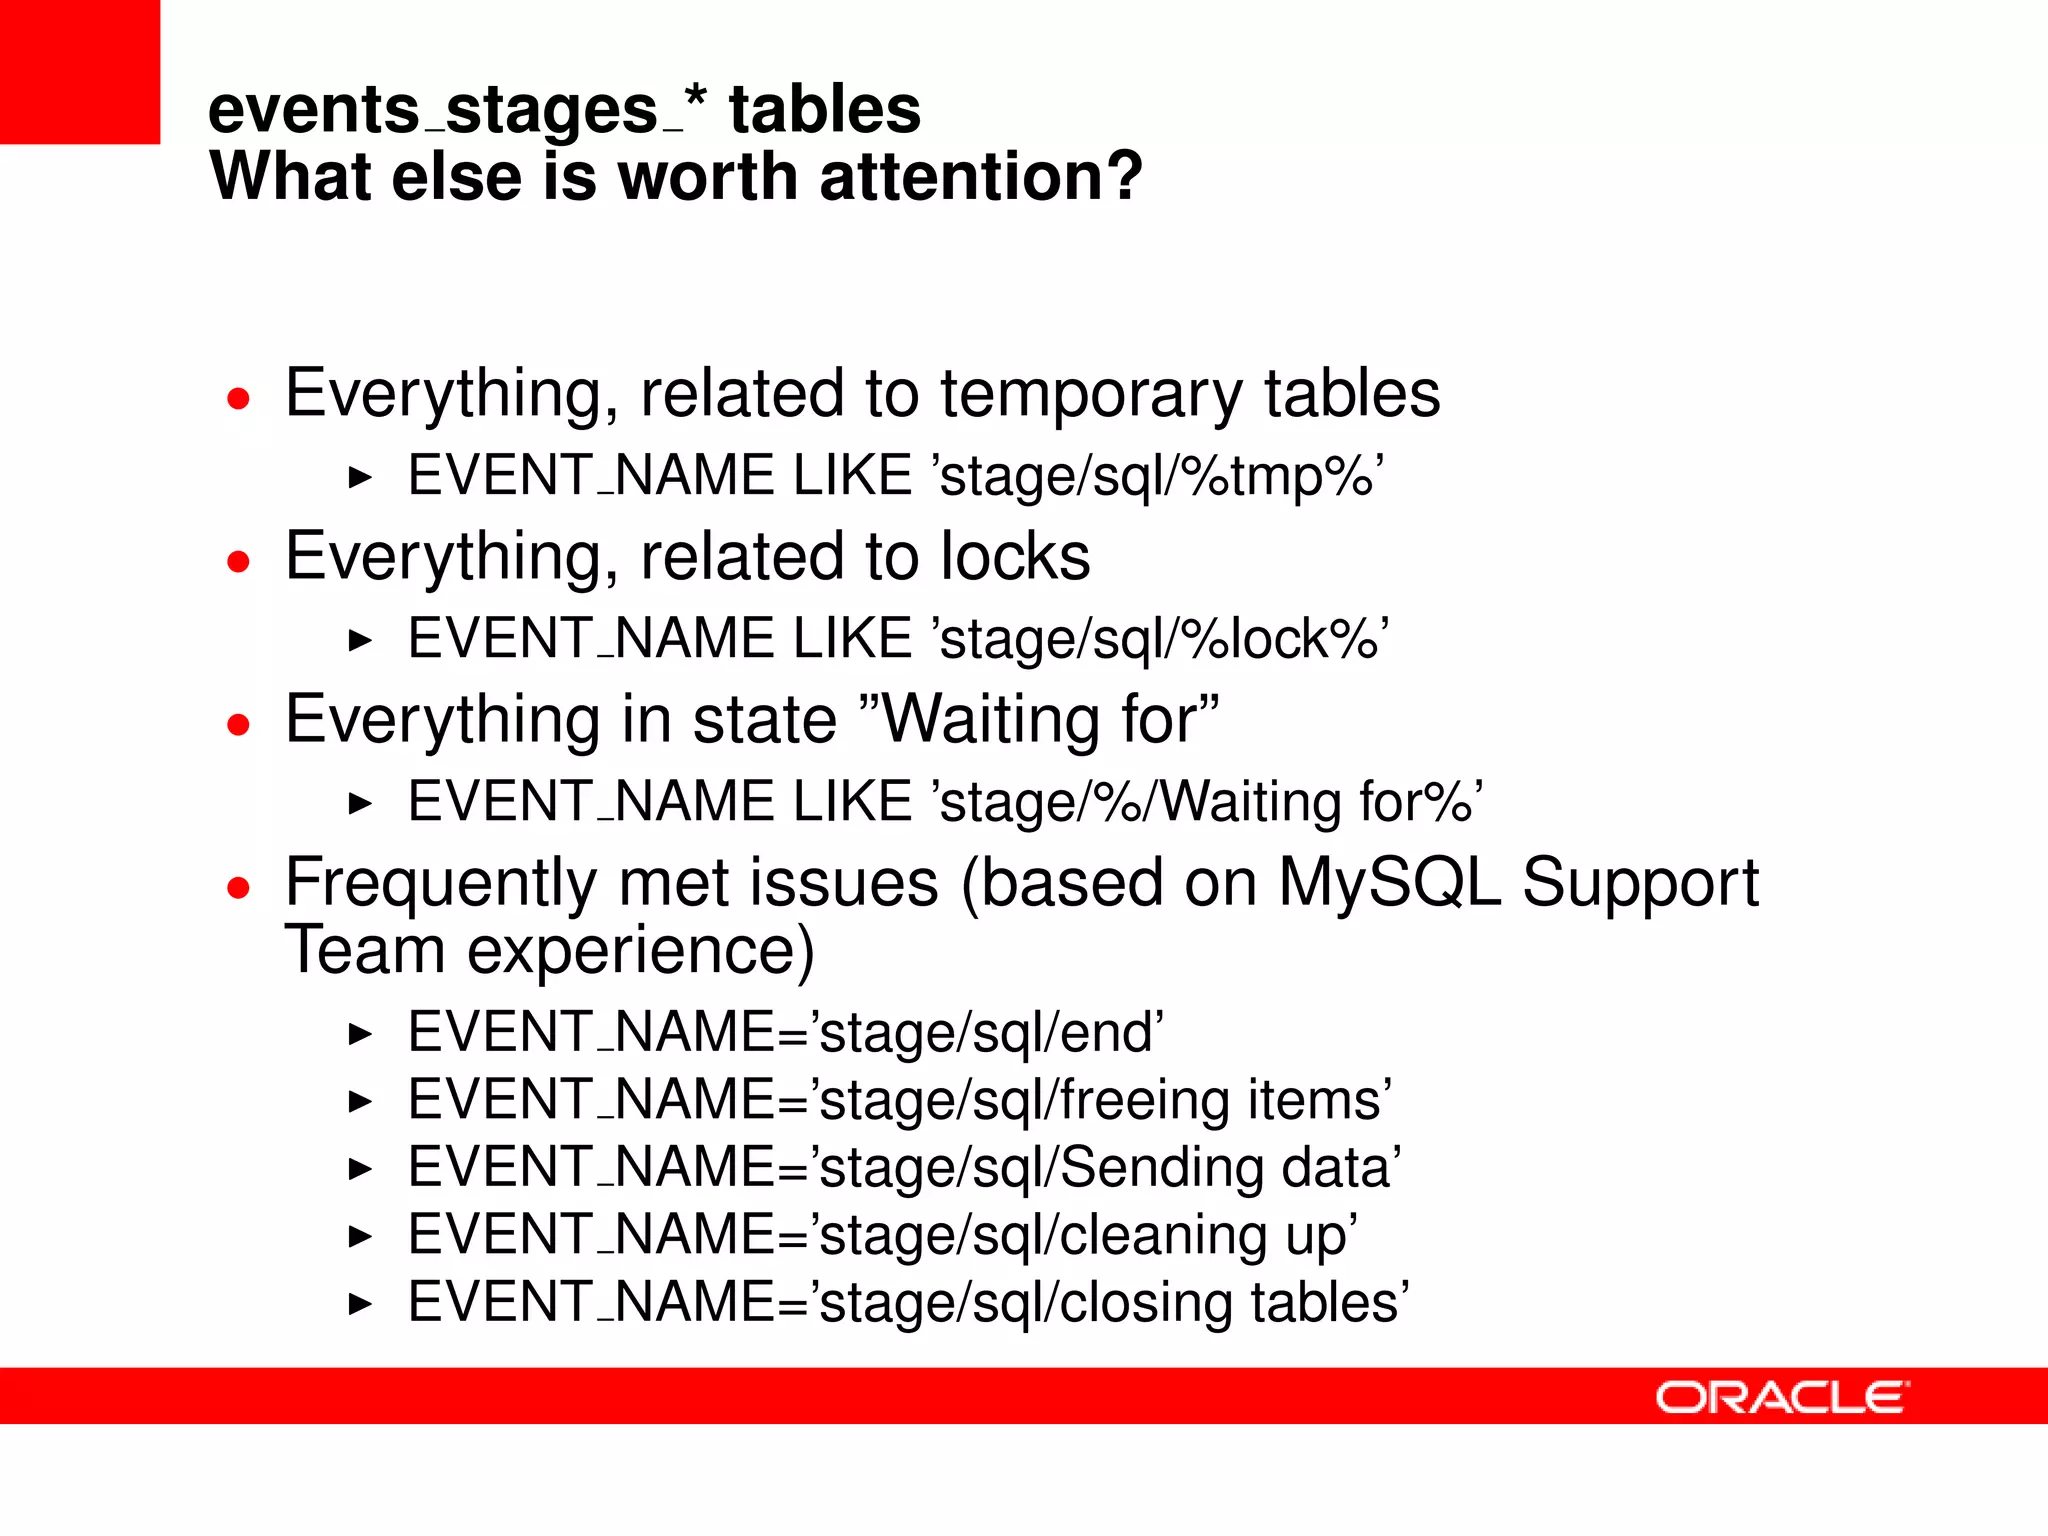
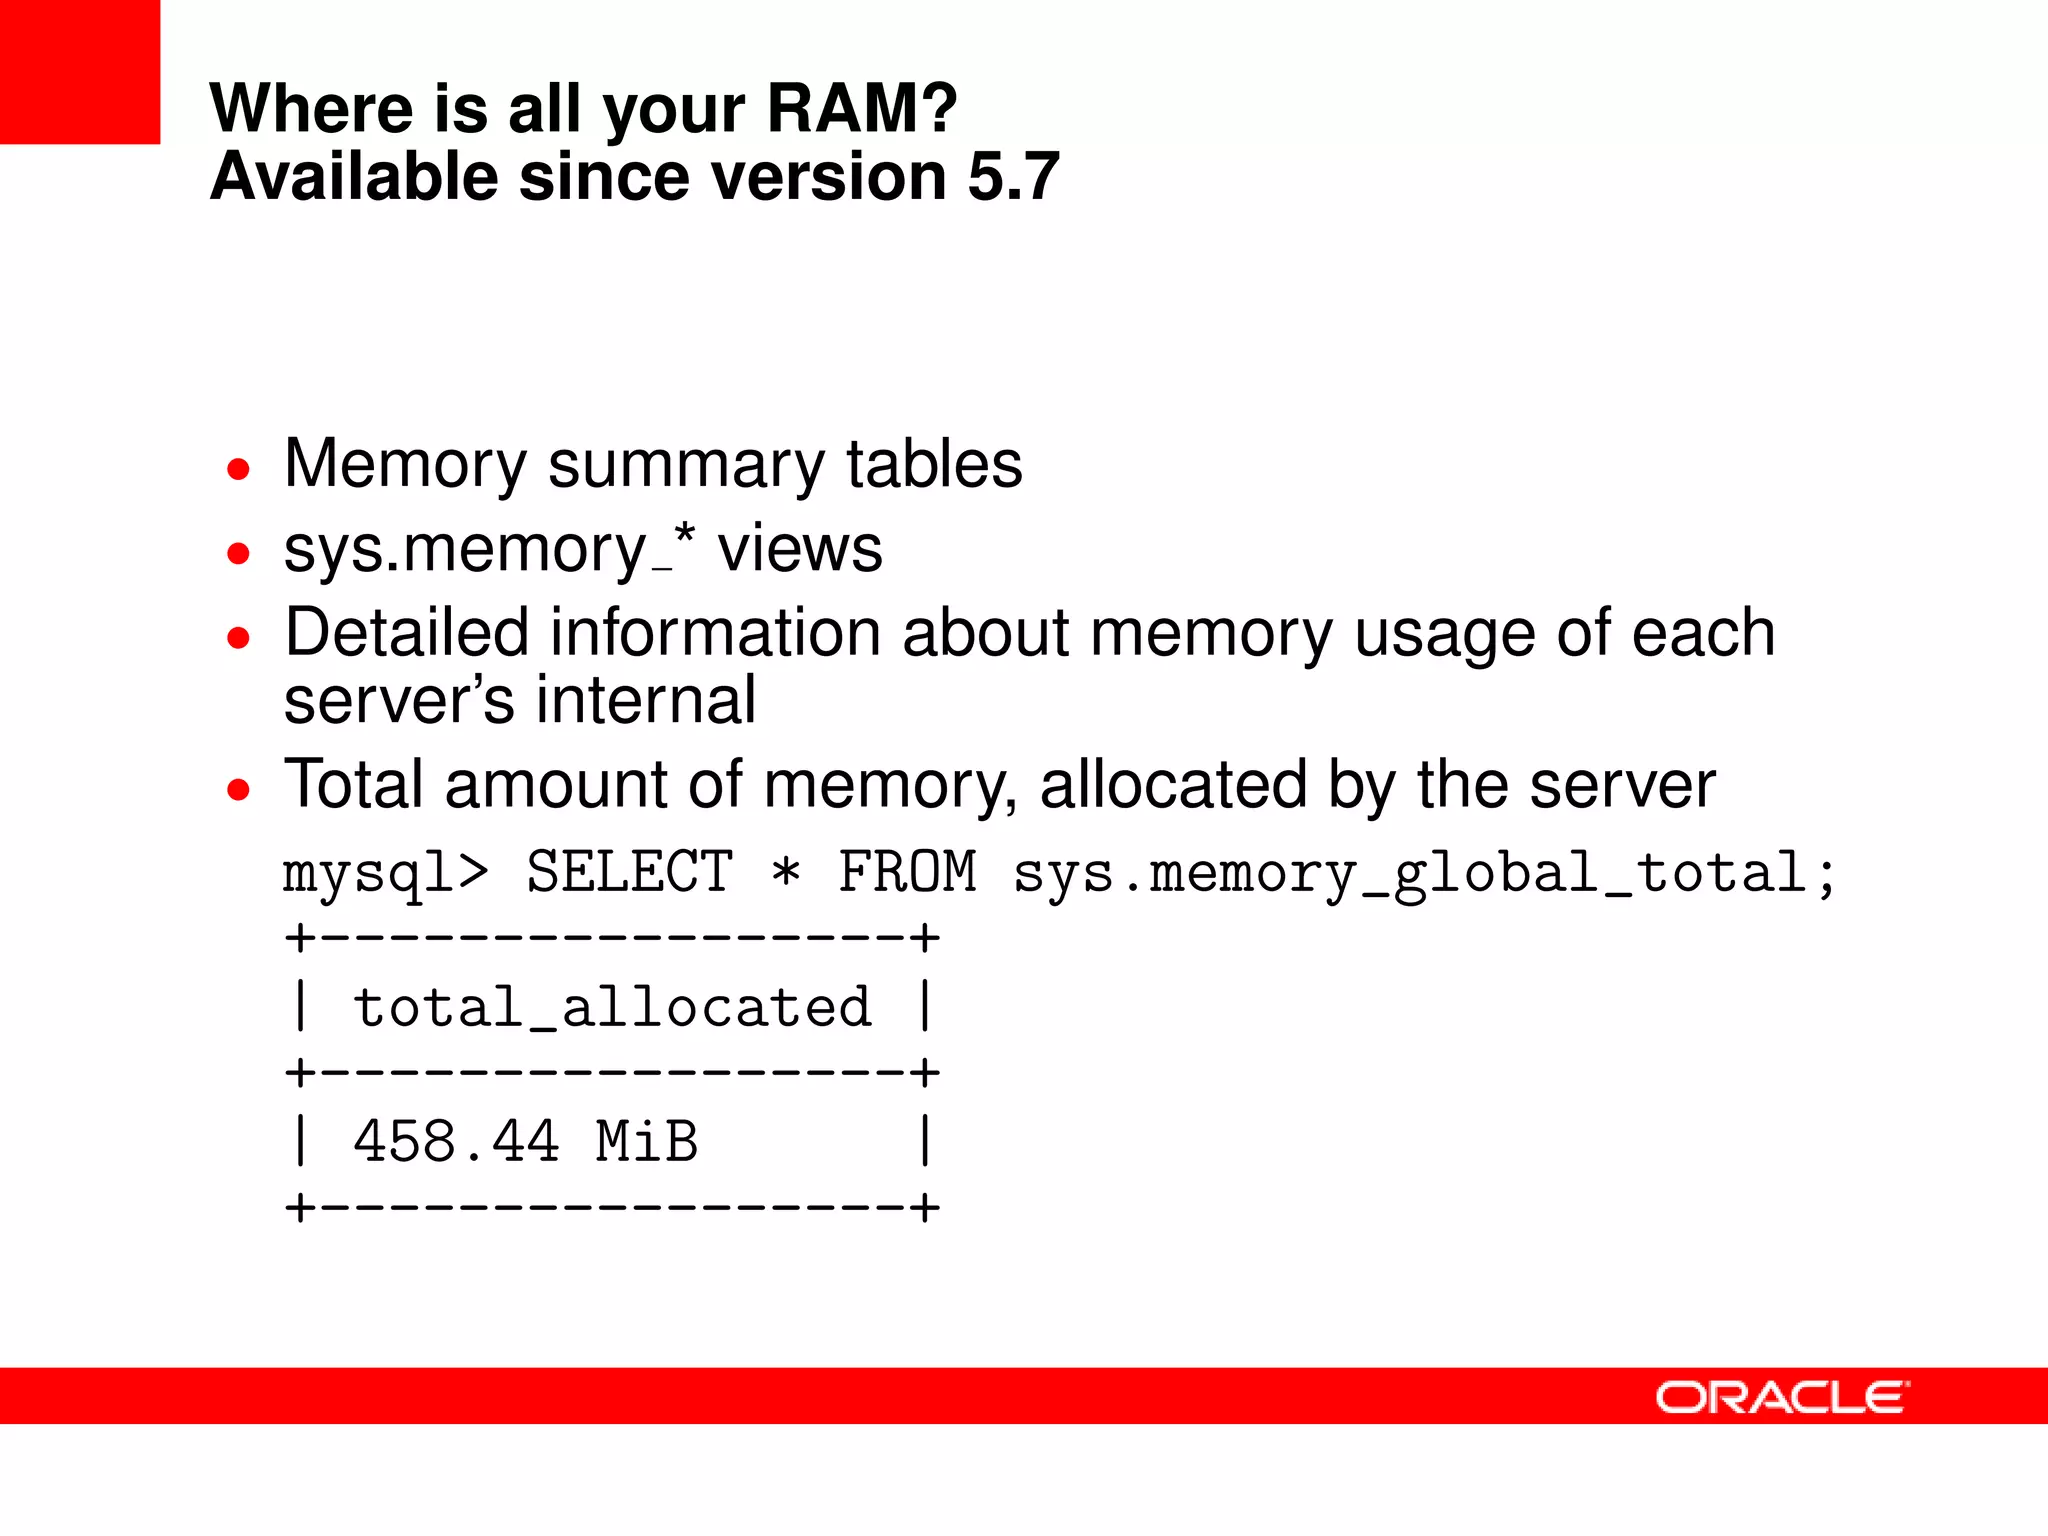
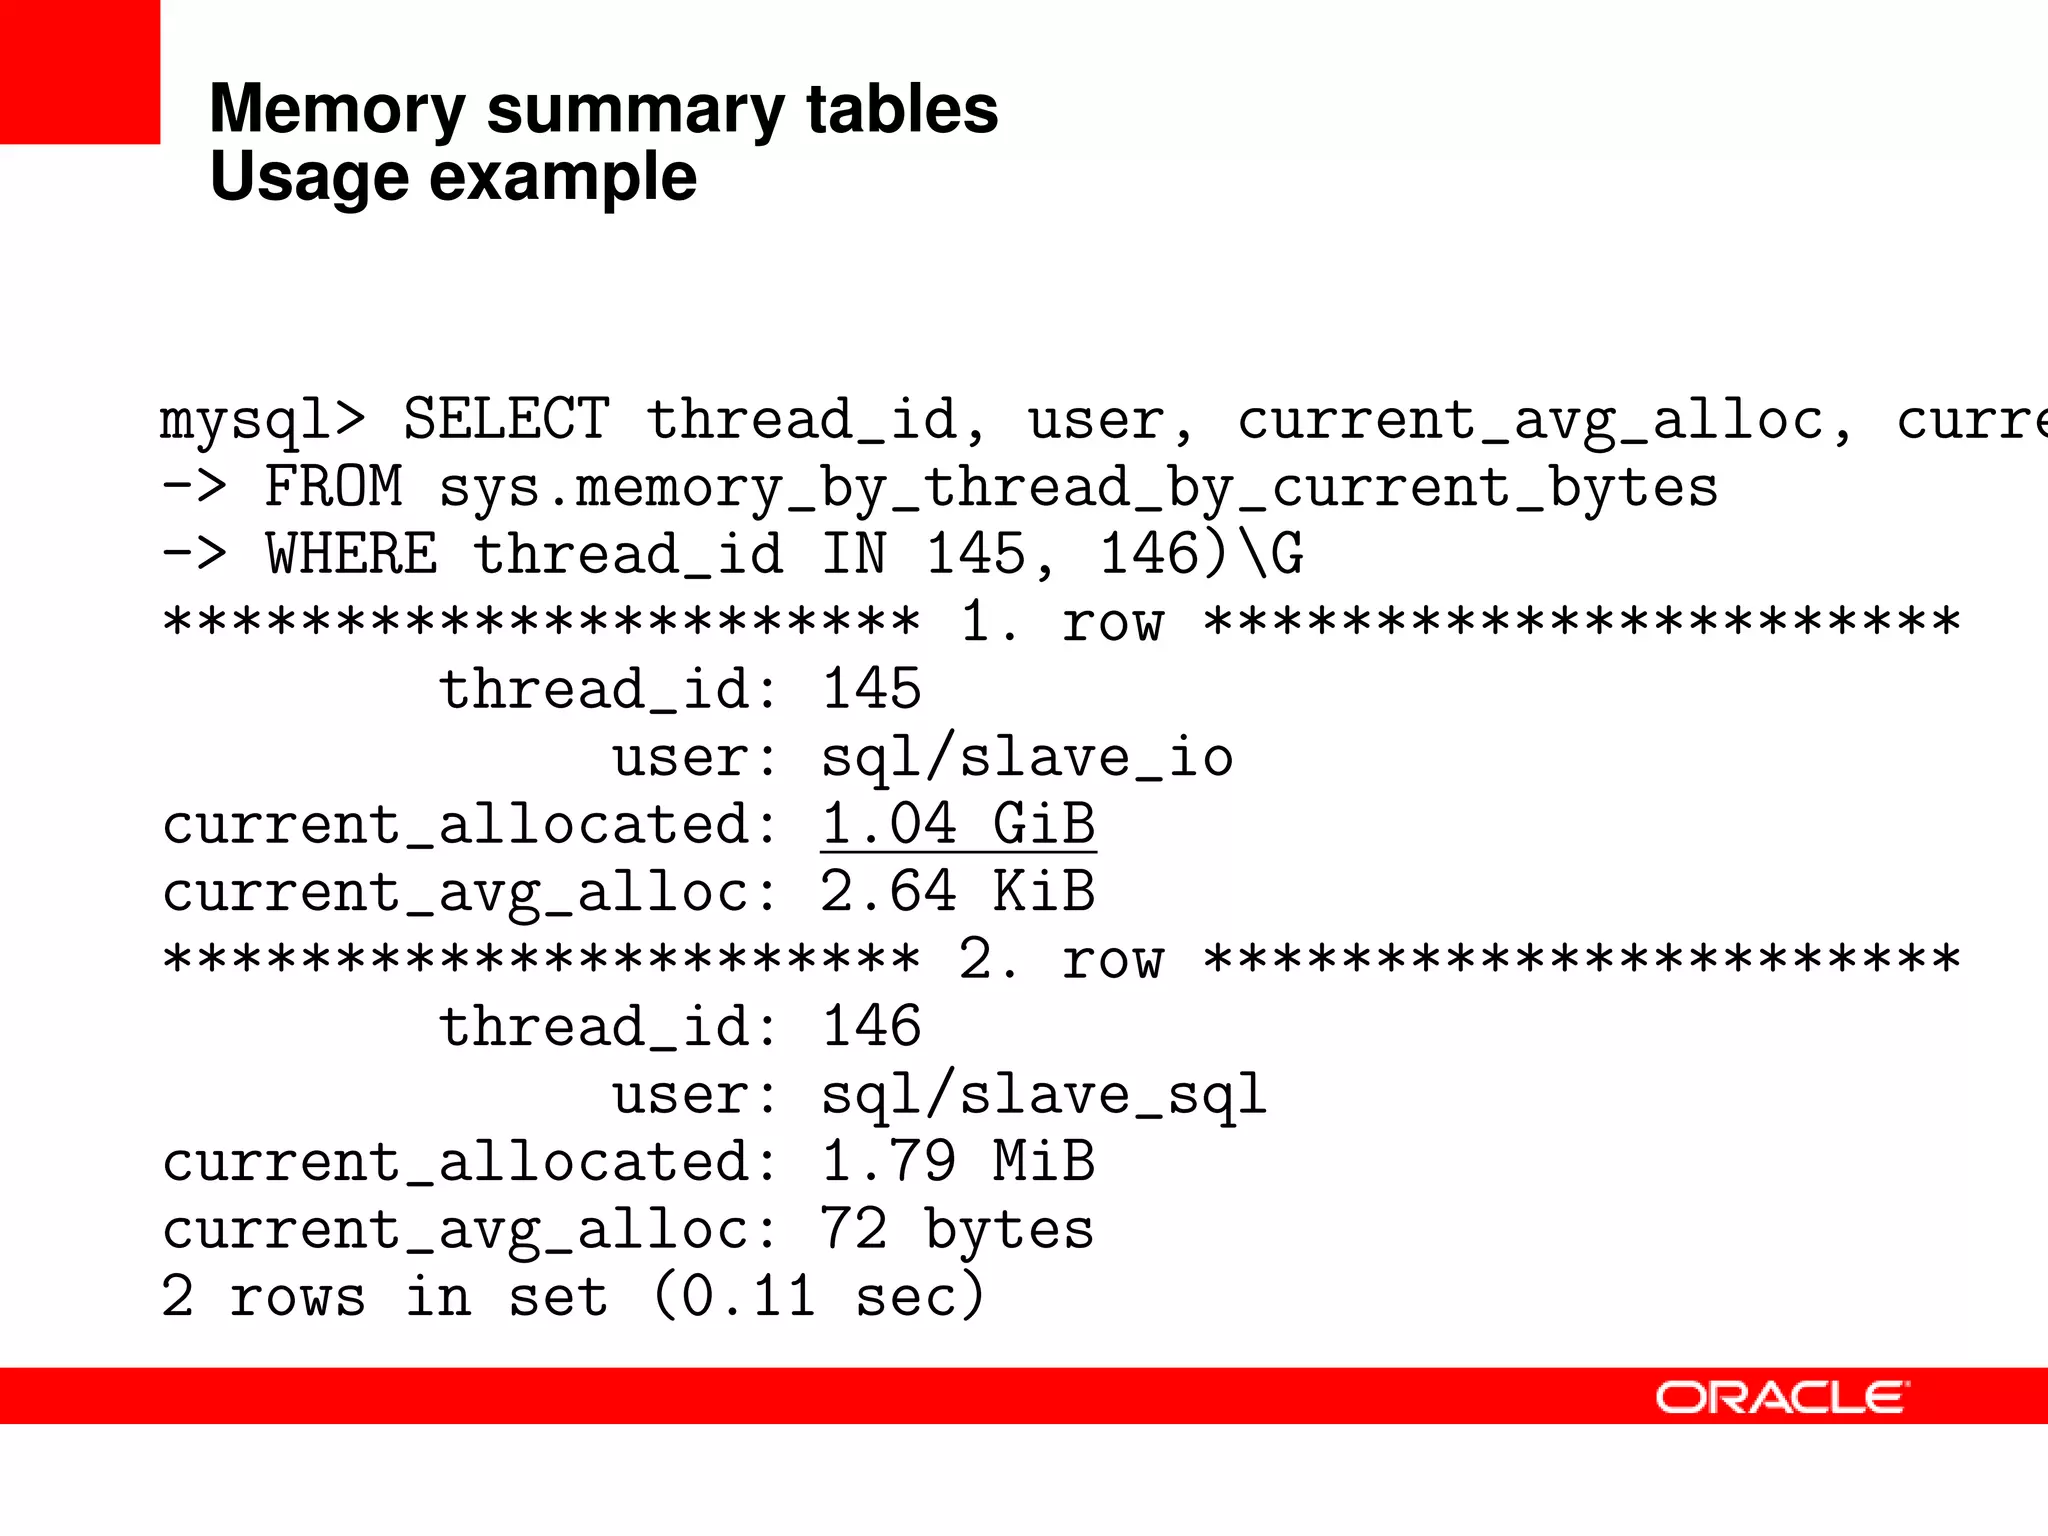
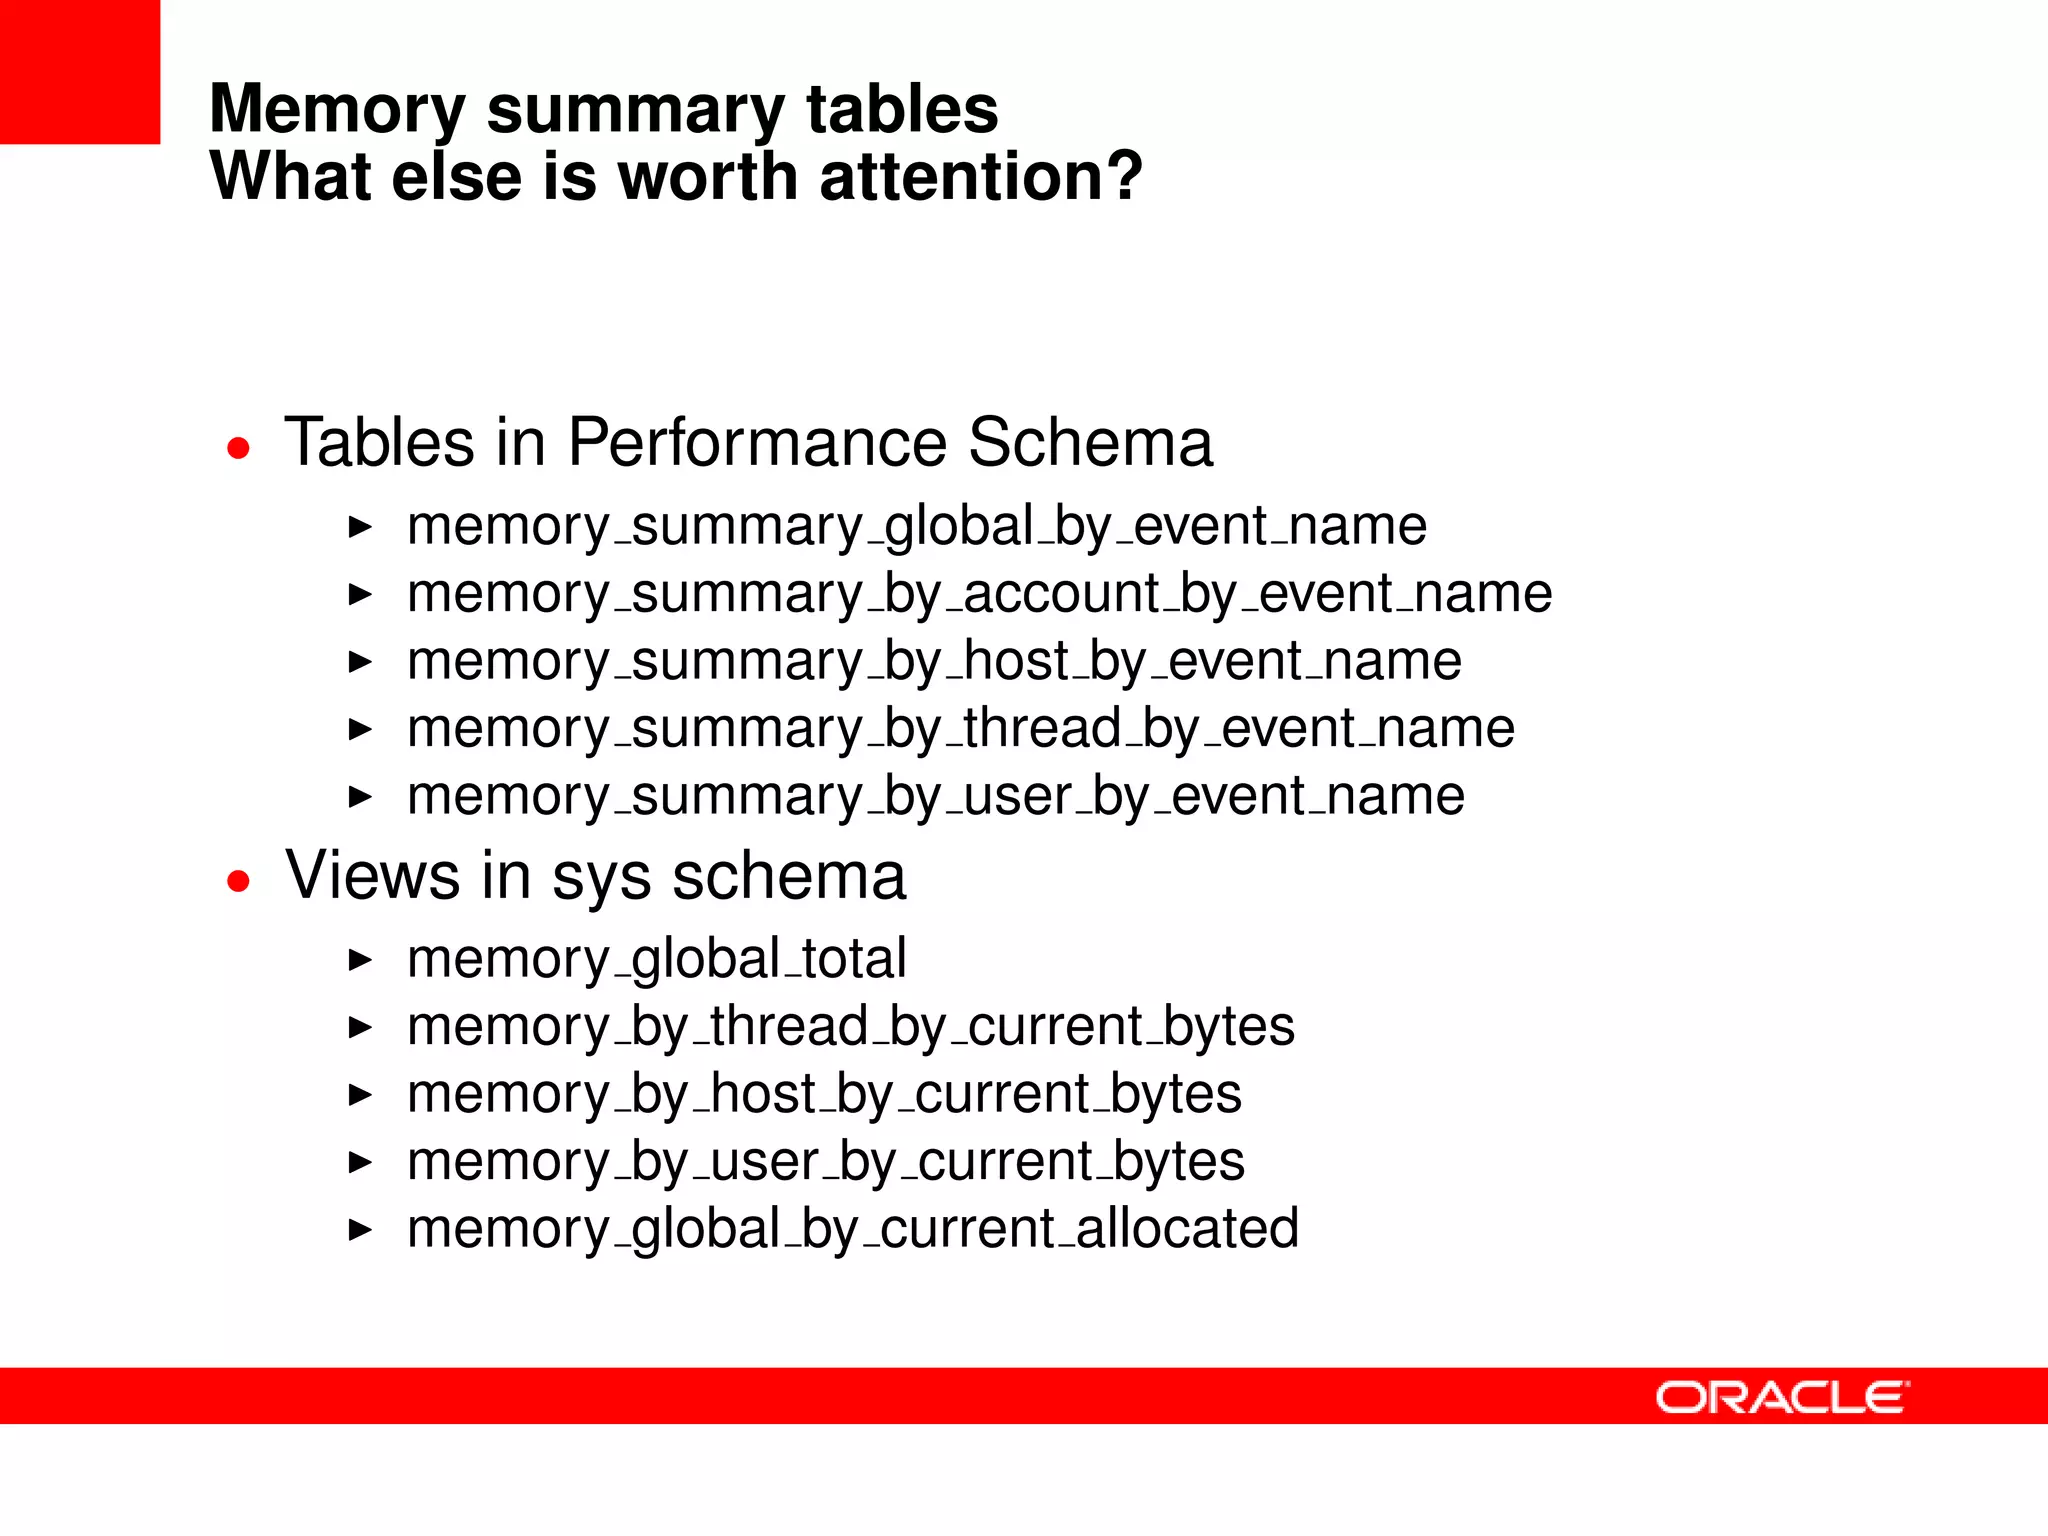
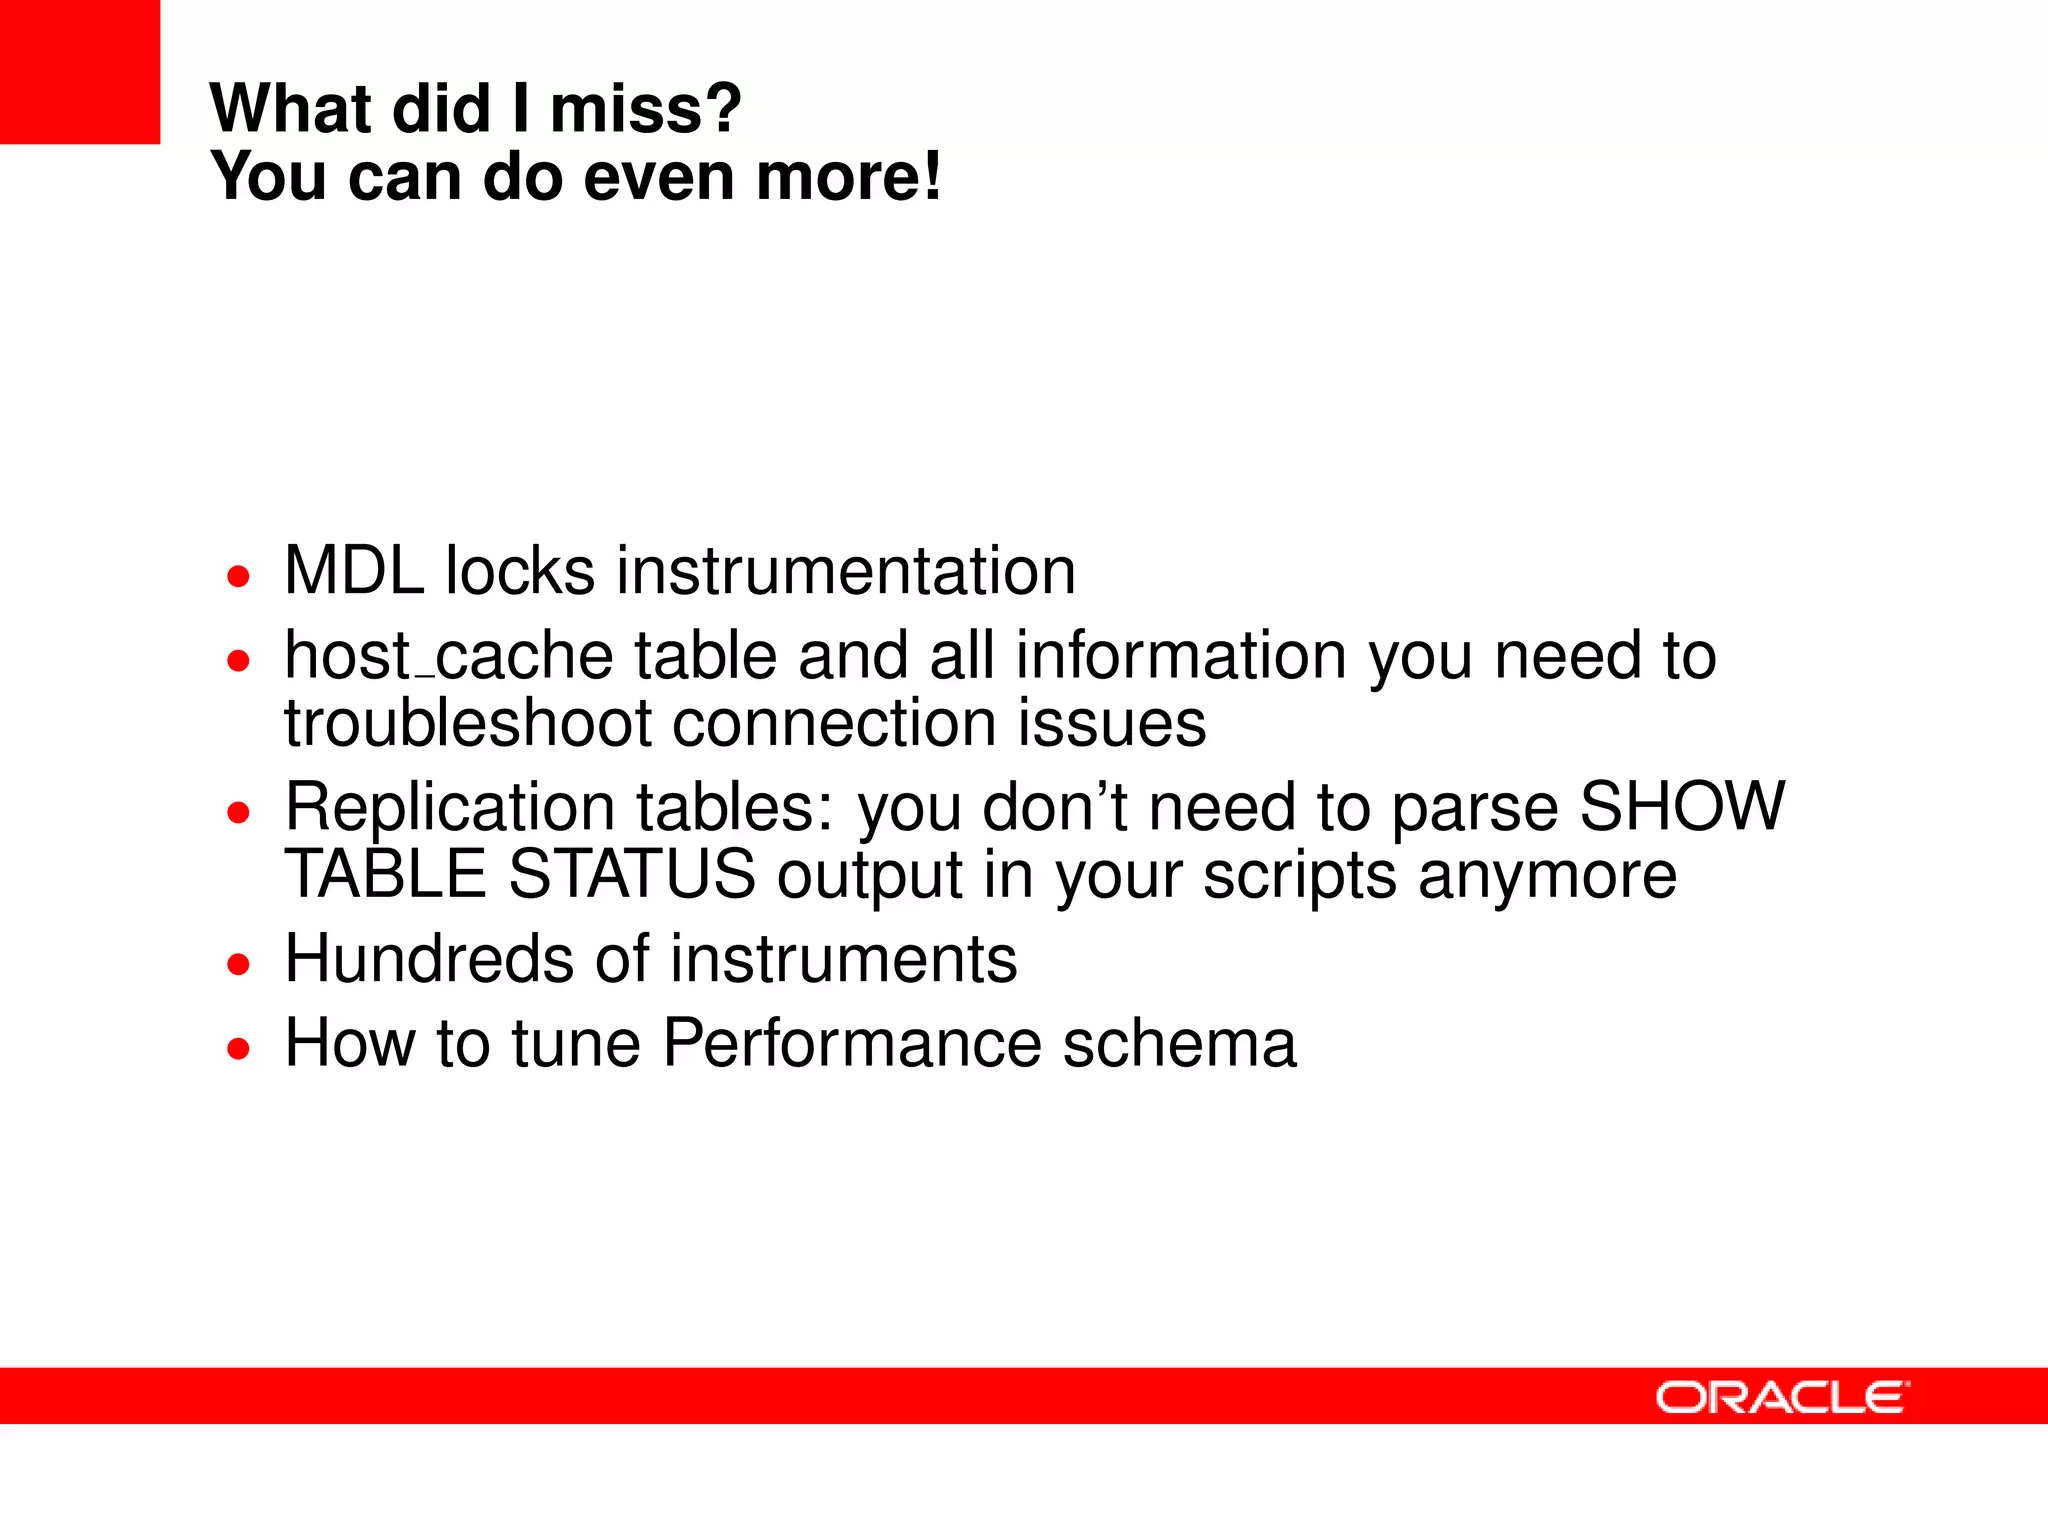


The Performance Schema in MySQL provides tables and instruments for troubleshooting issues like locks, I/O bottlenecks, slow queries, memory usage, and replication failures. It contains over 500 instruments in MySQL 5.6 and over 800 in 5.7. The tables provide visibility into the internal workings of MySQL to analyze and optimize performance.


![Introduction into MySQL Query Tuning for Dev[Op]s](https://cdn.slidesharecdn.com/ss_thumbnails/qtdevops-210717011329-thumbnail.jpg?width=640&height=640&fit=bounds)


![Introduction to MySQL Query Tuning for Dev[Op]s](https://cdn.slidesharecdn.com/ss_thumbnails/qtdevops-191005204425-thumbnail.jpg?width=640&height=640&fit=bounds)


