Download as PDF, PPTX


![EXPLAIN FORMAT=JSON
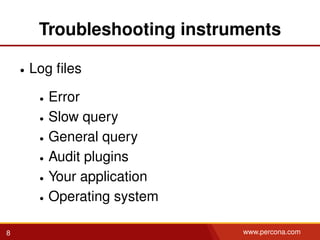
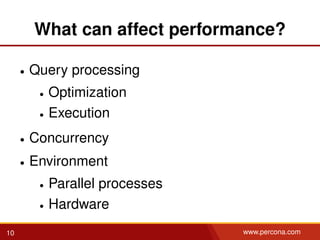
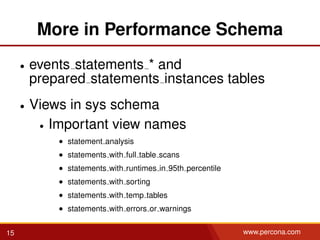
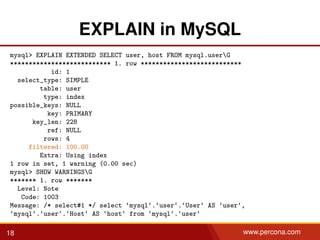
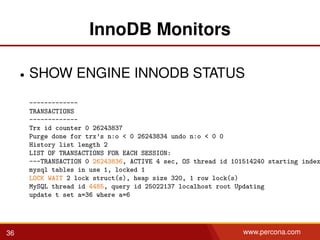
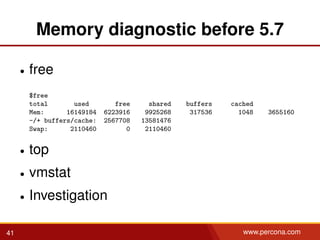
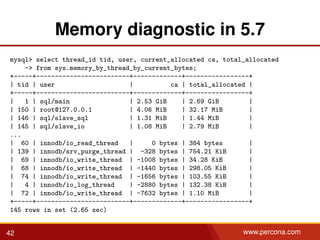
mysql> EXPLAIN FORMAT=JSON SELECT user, host FROM mysql.userG
*************************** 1. row ***************************
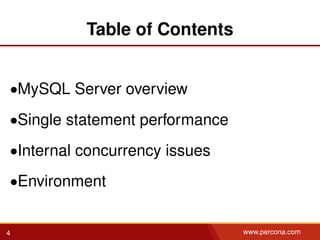
EXPLAIN: {
"query_block": {
"select_id": 1,
"table": {
"table_name": "user",
"access_type": "index",
"key": "PRIMARY",
"used_key_parts": [
"Host",
"User"
],
"key_length": "228",
"rows": 8,
"filtered": 100,
"using_index": true
}
}
}
23 www.percona.com](https://image.slidesharecdn.com/troubleshootingmysqlperformance-151121194346-lva1-app6891/85/Troubleshooting-MySQL-Performance-29-320.jpg)
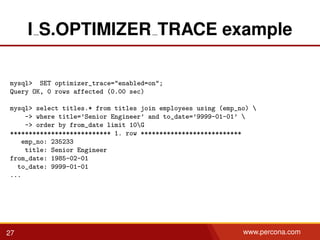
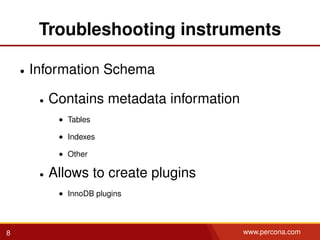
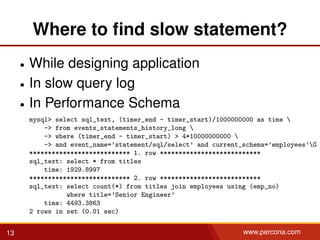
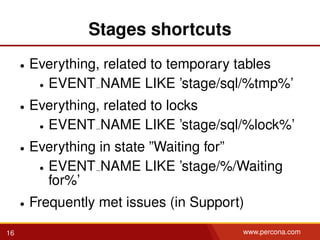
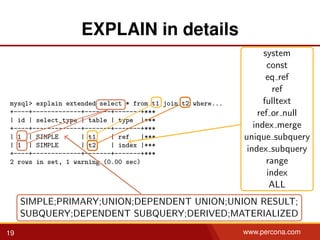
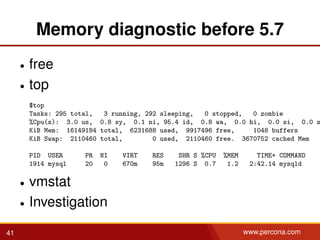
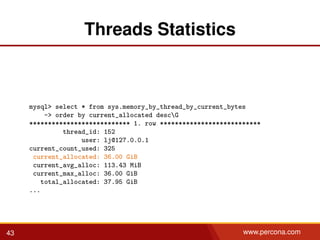
![I S.OPTIMIZER TRACE example cont.
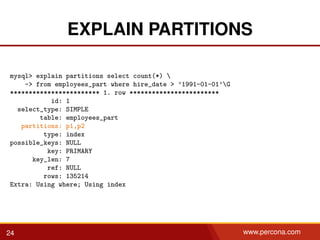
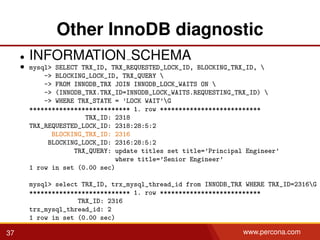
"considered_execution_plans": [
{
"plan_prefix": [
],
"table": "‘employees‘",
"best_access_path": {
"considered_access_paths": [
{
"access_type": "ref",
"index": "PRIMARY",
"usable": false,
"chosen": false
},
{
"rows_to_scan": 269763,
"access_type": "scan",
"resulting_rows": 269763,
"cost": 54754,
"chosen": true
}
...
29 www.percona.com](https://image.slidesharecdn.com/troubleshootingmysqlperformance-151121194346-lva1-app6891/85/Troubleshooting-MySQL-Performance-35-320.jpg)
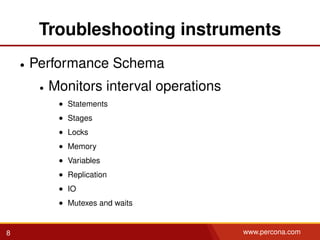
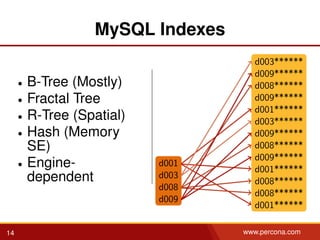
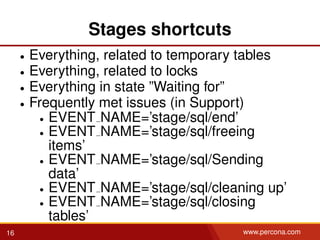
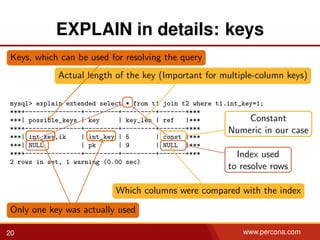
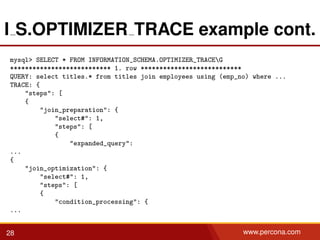
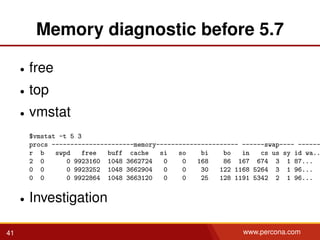
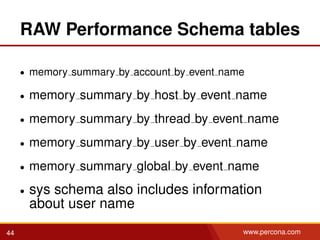
![I S.OPTIMIZER TRACE example cont.
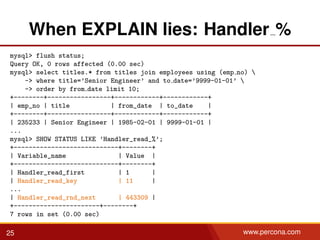
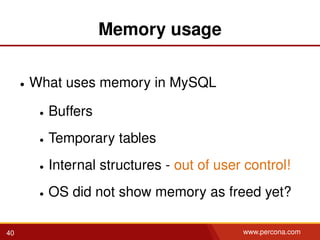
"condition_filtering_pct": 100,
"rows_for_plan": 269763,
"cost_for_plan": 54754,
...
"rest_of_plan": [
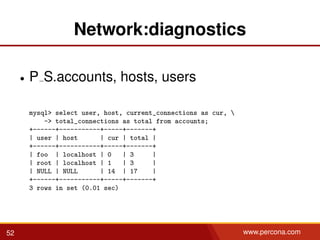
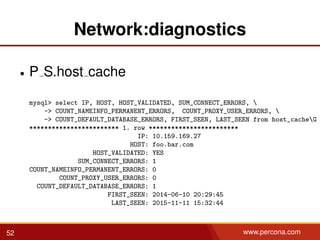
{
"plan_prefix": [
"‘titles‘"
],
"table": "‘employees‘",
"best_access_path": {
"considered_access_paths": [
{
"access_type": "eq_ref",
"index": "PRIMARY",
"rows": 1,
"cost": 5222.9,
"chosen": true,
"cause": "clustered_pk_chosen_by_heuristics"
},
30 www.percona.com](https://image.slidesharecdn.com/troubleshootingmysqlperformance-151121194346-lva1-app6891/85/Troubleshooting-MySQL-Performance-36-320.jpg)
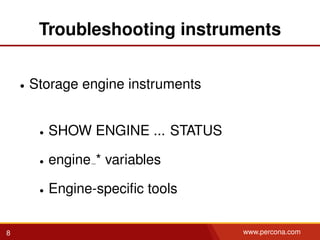
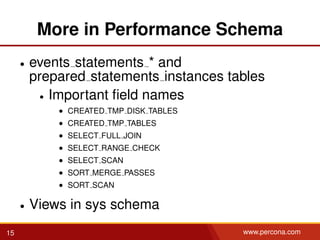
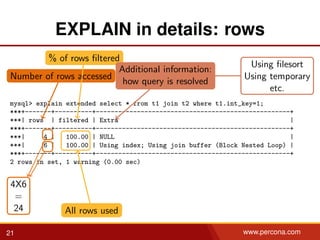
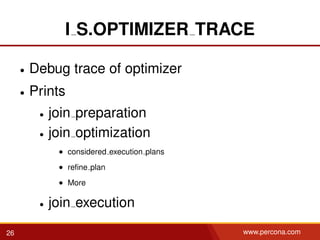
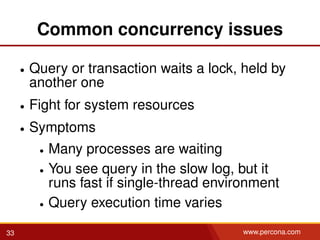
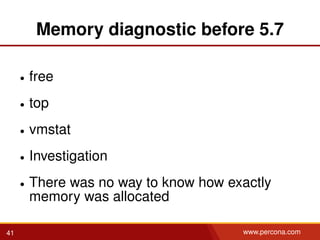
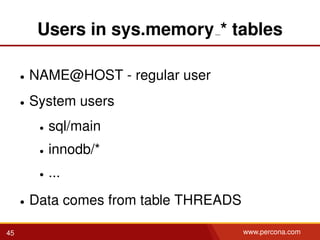
![I S.OPTIMIZER TRACE example cont.
{
"access_type": "scan",
"chosen": false,
"cause": "covering_index_better_than_full_scan"
}
]
},
"condition_filtering_pct": 100,
"rows_for_plan": 4352.4,
"cost_for_plan": 93459,
"chosen": true
...
31 www.percona.com](https://image.slidesharecdn.com/troubleshootingmysqlperformance-151121194346-lva1-app6891/85/Troubleshooting-MySQL-Performance-37-320.jpg)

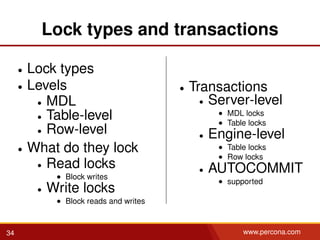
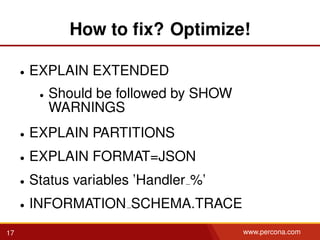
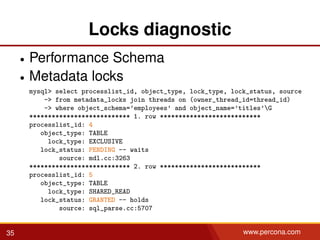
![Locks diagnostic
• SHOW [FULL] PROCESSLIST
• SHOW ENGINE INNODB STATUS
• INFORMATION SCHEMA
• PROCESSLIST
• InnoDB tables
• Performance Schema
• METADATA LOCKS
• TABLE HANDLES
• EVENTS TRANSACTIONS *
• Both server-level and engine-level
• Contain GTID information
35 www.percona.com](https://image.slidesharecdn.com/troubleshootingmysqlperformance-151121194346-lva1-app6891/85/Troubleshooting-MySQL-Performance-41-320.jpg)
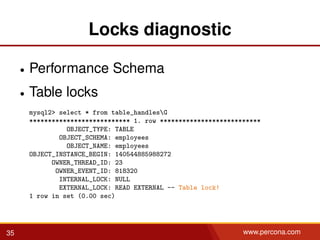
![Locks diagnostic
• SHOW [FULL] PROCESSLIST
• For any kind of locks
mysql> select id, state, info from information_schema.processlistG
******************** 1. row ********************
id: 5
state:
info: NULL
******************** 2. row ********************
id: 4
state: Waiting for table metadata lock
info: alter table titles add column f1 int
******************** 3. row ********************
id: 2
state: executing
info: select id, state, info from information_schema.processlist
35 www.percona.com](https://image.slidesharecdn.com/troubleshootingmysqlperformance-151121194346-lva1-app6891/85/Troubleshooting-MySQL-Performance-42-320.jpg)
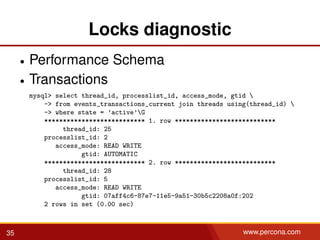


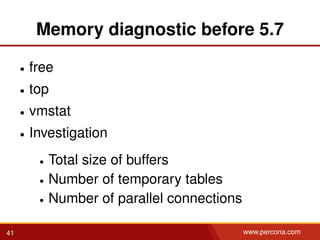
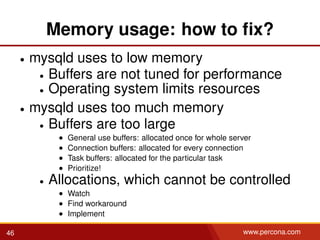
![Disk diagnostics
• ls -l /proc/{PID OF MYSQLD}/fd
sveta@thinkie:~/src/test-db/employees_db> ls -l /proc/26676/fd
total 0
lrwx------ 1 sveta users 64 Nov 11 15:11 0 -> /dev/pts/1
l-wx------ 1 sveta users 64 Nov 11 15:11 1 -> /log/mysqld.1.err
lrwx------ 1 sveta users 64 Nov 11 15:11 10 -> /data/ib_logfile1
lrwx------ 1 sveta users 64 Nov 11 15:11 11 -> /data/ibtmp1
lrwx------ 1 sveta users 64 Nov 11 15:11 12 -> /tmp/mysqld.1/ibx2zTxG (deleted
...
lrwx------ 1 sveta users 64 Nov 11 15:11 27 -> /data/sys/sys_config.ibd
l-wx------ 1 sveta users 64 Nov 11 15:11 28 -> /data/master-bin.000002
lrwx------ 1 sveta users 64 Nov 11 15:11 29 -> socket:[1245731]
lrwx------ 1 sveta users 64 Nov 11 15:11 3 -> /data/master-bin.index
...
lrwx------ 1 sveta users 64 Nov 11 15:11 5 -> /tmp/mysqld.1/ibT4odfr (deleted)
lrwx------ 1 sveta users 64 Nov 11 15:11 6 -> /tmp/mysqld.1/ibJoMdZu (deleted)
lrwx------ 1 sveta users 64 Nov 11 15:11 7 -> /tmp/mysqld.1/ibvUBeJy (deleted)
lrwx------ 1 sveta users 64 Nov 11 15:11 8 -> /tmp/mysqld.1/ibP6JxvC (deleted)
lrwx------ 1 sveta users 64 Nov 11 15:11 9 -> /data/ib_logfile0
47 www.percona.com](https://image.slidesharecdn.com/troubleshootingmysqlperformance-151121194346-lva1-app6891/85/Troubleshooting-MySQL-Performance-66-320.jpg)
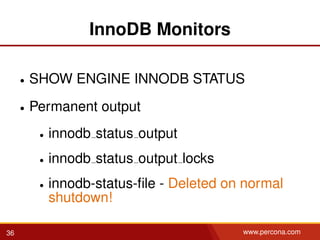
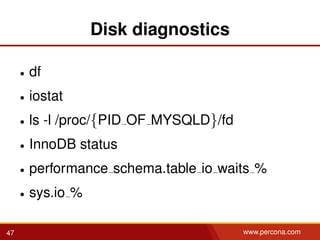
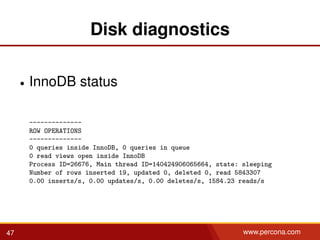
![Disk diagnostics
• InnoDB status
mysql> show engine innodb statusG
...
--------
FILE I/O
--------
I/O thread 0 state: waiting for i/o request (insert buffer thread)
I/O thread 1 state: waiting for i/o request (log thread)
I/O thread 2 state: waiting for i/o request (read thread)
I/O thread 3 state: waiting for i/o request (read thread)
I/O thread 4 state: waiting for i/o request (write thread)
I/O thread 5 state: waiting for i/o request (write thread)
Pending normal aio reads: [0, 0] , aio writes: [0, 0] ,
ibuf aio reads:, log i/o’s:, sync i/o’s:
Pending flushes (fsync) log: 0; buffer pool: 0
11468 OS file reads, 102 OS file writes, 17 OS fsyncs
11.80 reads/s, 16384 avg bytes/read, 0.00 writes/s, 0.00 fsyncs/s
...
47 www.percona.com](https://image.slidesharecdn.com/troubleshootingmysqlperformance-151121194346-lva1-app6891/85/Troubleshooting-MySQL-Performance-67-320.jpg)


This document discusses troubleshooting MySQL performance issues. It begins with an overview of MySQL server architecture and important components like the optimizer and storage engines. It then covers various diagnostic instruments for troubleshooting like log files, the Information Schema, and the Performance Schema. Specific issues covered include single statement performance using EXPLAIN, internal concurrency issues detected via locks diagnostics from sources like SHOW PROCESSLIST and the Performance Schema. The document provides examples of using these diagnostic tools to analyze and optimize query performance.


![Introduction to MySQL Query Tuning for Dev[Op]s](https://cdn.slidesharecdn.com/ss_thumbnails/qtdevops-191005204425-thumbnail.jpg?width=640&height=640&fit=bounds)


![Introduction into MySQL Query Tuning for Dev[Op]s](https://cdn.slidesharecdn.com/ss_thumbnails/qtdevops-210717011329-thumbnail.jpg?width=640&height=640&fit=bounds)


![20260201 [FOSDEM] gomodjail - library sandboxing for Go modules.pdf](https://cdn.slidesharecdn.com/ss_thumbnails/20260201fosdemgomodjail-librarysandboxingforgomodules-260201225659-76609ec4-thumbnail.jpg?width=640&height=640&fit=bounds)


