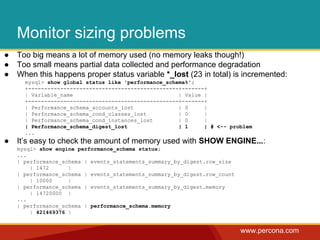
The document discusses using the PERFORMANCE_SCHEMA in MySQL 5.6 to analyze and troubleshoot performance issues. It provides an overview of the PERFORMANCE_SCHEMA, how to configure what is instrumented and collected, and examples of using it to find bottlenecks like long wait times on InnoDB mutexes. The PERFORMANCE_SCHEMA provides visibility into where time is spent and which resources are most used through its set of in-memory tables.
How to use histograms to get better performanceMariaDB plc
Sergei Petrunia and Varun Gupta, software engineers MariaDB, show how histograms can be used to improve query performance. They begin by introducing histrograms and explaining why they’re needed by the query optimizer. Next, they discuss how to determine whether or not histrograms are needed, and if so, how to determine which tables and columns they should be applied. Finally, they cover best practices and recent improvements to histograms.
Optimizing MariaDB for maximum performanceMariaDB plc
When it comes to optimizing the performance of a database, DBAs have to look at everything from the OS to the network. In this session, MariaDB Enterprise Architect Manjot Singh shares best practices for getting the most out of MariaDB. He highlights recommended OS settings, important configuration and tuning parameters, options for improving replication and clustering performance and features such as query result caching.
My talk for "MySQL, MariaDB and Friends" devroom at Fosdem on February 2, 2019
Born in 2010 in MySQL 5.5.3 as "a feature for monitoring server execution at a low level," grown in 5.6 times with performance fixes and DBA-faced features, in MySQL 5.7 Performance Schema is a mature tool, used by humans and more and more monitoring products. It becomes more popular over the years. In this talk I will give an overview of Performance Schema, focusing on its tuning, performance, and usability.
Performance Schema helps to troubleshoot query performance, complicated locking issues, memory leaks, resource usage, problematic behavior, caused by inappropriate settings and much more. It comes with hundreds of options which allow precisely tune what to instrument. More than 100 consumers store collected data.
Performance Schema is a potent tool. And very complicated at the same time. It does not affect performance in most cases and can slow down server dramatically if configured without care. It collects a lot of data, and sometimes this data is hard to read.
This talk will start from the introduction of how Performance Schema designed, and you will understand why it slowdowns server in some cases and does not affect your queries in others. Then we will discuss which information you can retrieve from Performance Schema and how to do it effectively.
I will cover its companion sys schema and graphical monitoring tools.
We talk a lot about Galera Cluster being great for High Availability, but what about Disaster Recovery (DR)? Database outages can occur when you lose a data centre due to data center power outages or natural disaster, so why not plan appropriately in advance?
In this webinar, we will discuss the business considerations including achieving the highest possible uptime, analysis business impact as well as risk, focus on disaster recovery itself, as well as discussing various scenarios, from having no offsite data to having synchronous replication to another data centre.
This webinar will cover MySQL with Galera Cluster, as well as branches MariaDB Galera Cluster as well as Percona XtraDB Cluster (PXC). We will focus on architecture solutions, DR scenarios and have you on your way to success at the end of it.
Using Apache Spark to analyze large datasets in the cloud presents a range of challenges. Different stages of your pipeline may be constrained by CPU, memory, disk and/or network IO. But what if all those stages have to run on the same cluster? In the cloud, you have limited control over the hardware your cluster runs on.
You may have even less control over the size and format of your raw input files. Performance tuning is an iterative and experimental process. It’s frustrating with very large datasets: what worked great with 30 billion rows may not work at all with 400 billion rows. But with strategic optimizations and compromises, 50+ TiB datasets can be no big deal.
By using Spark UI and simple metrics, explore how to diagnose and remedy issues on jobs:
Sizing the cluster based on your dataset (shuffle partitions)
Ingestion challenges – well begun is half done (globbing S3, small files)
Managing memory (sorting GC – when to go parallel, when to go G1, when offheap can help you)
Shuffle (give a little to get a lot – configs for better out of box shuffle) – Spill (partitioning for the win)
Scheduling (FAIR vs FIFO, is there a difference for your pipeline?)
Caching and persistence (it’s the cost of doing business, so what are your options?)
Fault tolerance (blacklisting, speculation, task reaping)
Making the best of a bad deal (skew joins, windowing, UDFs, very large query plans)
Writing to S3 (dealing with write partitions, HDFS and s3DistCp vs writing directly to S3)
On July 6, 2021, MariaDB 10.6 became generally available (production ready). This presentation focuses on the most important aspects of it as well as the influence it has. Improvements to InnoDB, SYS Schema Adoption, and deprecated variables and engines are all part of this presentation.
How a Developer can Troubleshoot a SQL performing poorly on a Production DBCarlos Sierra
This session is about some free small scripts you can execute from SQL*Plus, which provide you with some basics about a SQL statement, like the Execution Plan from multiple child cursors, their SQL Monitor report if your site has the Tuning Pack, and some useful Active Session History (ASH) summaries for your SQL if your site has the Diagnostics Pack. And if you have neither the Tuning nor the Diagnostics Pack then you may want to learn about some alternatives to collect important performance metrics.
Kudu is popularly referred to as "Fast Analytics on Fast Data" capable of performing both OLAP & OLTP operations. Understand right from essentials to deep-dive into Kudu internals and architecture for building applications based on Kudu and integrating with Hadoop ecosystem.
Read about Kudu clusters, architecture, operations, primary key design and column optimizations, partitioning and other performance considerations.
Talk on Apache Kudu, presented by Asim Jalis at SF Data Engineering Meetup on 2/23/2016.
http://www.meetup.com/SF-Data-Engineering/events/228293610/
Big Data applications need to ingest streaming data and analyze it. HBase is great at ingesting streaming data but not good at analytics. HDFS is great at analytics but not at ingesting streaming data. Frequently applications ingest data into HBase and then move it to HDFS for analytics. What if you could use a single system for both use cases?
What if you could use a single system for both use cases? This could dramatically simplify your data pipeline architecture.
This is where Kudu comes in. Kudu is a storage system that lives between HDFS and HBase. It is good at both ingesting streaming data and good at analyzing it using Spark, MapReduce, and SQL.
EXPLAIN ANALYZE is a new query profiling tool first released in MySQL 8.0.18. This presentation covers how this new feature works, both on the surface and on the inside, and how you can use it to better understand your queries, to improve them and make them go faster.
This presentation is for everyone who has ever had to understand why a query is executed slower than anticipated, and for everyone who wants to learn more about query plans and query execution in MySQL.
A Hitchhiker's Guide to Apache Kafka Geo-Replication with Sanjana Kaundinya ...HostedbyConfluent
Many organizations use Apache Kafka® to build data pipelines that span multiple geographically distributed data centers, for use cases ranging from high availability and disaster recovery, to data aggregation and regulatory compliance.
The journey from single-cluster deployments to multi-cluster deployments can be daunting, as you need to deal with networking configurations, security models and operational challenges. Geo-replication support for Kafka has come a long way, with both open-source and commercial solutions that support various replication topologies and disaster recovery strategies.
So, grab your towel, and join us on this journey as we look at tools, practices, and patterns that can help us build reliable, scalable, secure, global (if not inter-galactic) data pipelines that meet your business needs, and might even save the world from certain destruction.
Galera Cluster for MySQL vs MySQL (NDB) Cluster: A High Level Comparison Severalnines
Galera Cluster for MySQL, Percona XtraDB Cluster and MariaDB Cluster (the three “flavours” of Galera Cluster) make use of the Galera WSREP libraries to handle synchronous replication.MySQL Cluster is the official clustering solution from Oracle, while Galera Cluster for MySQL is slowly but surely establishing itself as the de-facto clustering solution in the wider MySQL eco-system.
In this webinar, we will look at all these alternatives and present an unbiased view on their strengths/weaknesses and the use cases that fit each alternative.
This webinar will cover the following:
MySQL Cluster architecture: strengths and limitations
Galera Architecture: strengths and limitations
Deployment scenarios
Data migration
Read and write workloads (Optimistic/pessimistic locking)
WAN/Geographical replication
Schema changes
Management and monitoring
Apache Spark Performance Troubleshooting at Scale, Challenges, Tools, and Met...Databricks
This talk is about methods and tools for troubleshooting Spark workloads at scale and is aimed at developers, administrators and performance practitioners. You will find examples illustrating the importance of using the right tools and right methodologies for measuring and understanding performance, in particular highlighting the importance of using data and root cause analysis to understand and improve the performance of Spark applications. The talk has a strong focus on practical examples and on tools for collecting data relevant for performance analysis. This includes tools for collecting Spark metrics and tools for collecting OS metrics. Among others, the talk will cover sparkMeasure, a tool developed by the author to collect Spark task metric and SQL metrics data, tools for analysing I/O and network workloads, tools for analysing CPU usage and memory bandwidth, tools for profiling CPU usage and for Flame Graph visualization.
Data Warehouses in Kubernetes Visualized: the ClickHouse Kubernetes Operator UIAltinity Ltd
Graham Mainwaring and Robert Hodges summarize management of ClickHouse on Kubernetes using the ClickHouse Kubernetes Operator and introduce a new UI for it. Presented at the 15 Dec '22 SF Bay Area ClickHouse Meetup.
Kubernetes CRI containerd integration by Lantao Liu (Google)Docker, Inc.
The talk will firstly give a brief review of the runtime portability of Kubernetes, then talk about why containerd is attractive to Kubernetes, and then give a brief introduction and status update of Kubernetes Containerd Integration and a demo.
Linux /proc filesystem for MySQL DBAs - FOSDEM 2021Valeriy Kravchuk
Tools and approaches based on /proc sampling (like 0x.tools by Tanel Poder or ad hoc scripts) allow to measure individual thread level activity in MySQL server on Linux, like thread sleep states, currently executing system calls and kernel wait locations. If needed you can drill down into CPU usage of any thread or the system as a whole. Historical data can be captured for post factum analysis, without much impact on the system and no need to install or change anything in its configuration. In this presentation I am going to summarize what's possible with /proc and show useful examples for MySQL DBAs.
Dynamic tracing of MariaDB on Linux - problems and solutions (MariaDB Server ...Valeriy Kravchuk
Linux with kernels 2.6+. provides different ways to add user probes to almost every other line of code dynamically, and collect the resulting trace and profiling data in a safe and efficient way. This session discusses basic use of ftrace, perf, bcc tools and bpftrace utility, highlights typical problems MariaDB DBAs and developers may hit while trying to apply them, as well as solutions to some of them.
Peeking into the Black Hole Called PL/PGSQL - the New PL Profiler / Jan Wieck...Ontico
The new PL profiler allows you to easily get through the dark barrier, PL/pgSQL puts between tools like pgbadger and the queries, you are looking for.
Query and schema tuning is tough enough by itself. But queries, buried many call levels deep in PL/pgSQL functions, make it torture. The reason is that the default monitoring tools like logs, pg_stat_activity and pg_stat_statements cannot penetrate into PL/pgSQL. All they report is that your query calling function X is slow. That is useful if function X has 20 lines of simple code. Not so useful if it calls other functions and the actual problem query is many call levels down in a dungeon of 100,000 lines of PL code.
Learn from the original author of PL/pgSQL and current maintainer of the plprofiler extension how you can easily analyze, what is going on inside your PL code.
The 5.5 and 5.6 releases of MySQL introduce several new mechanisms that provide improved monitoring and performance tuning functionality. Examples are performance schemas, InnoDB metrics tables, optimizer trace, and extended explain functionality.
This session outlines the vision for monitoring-related functionality in MySQL and presents an overview of the new mechanisms. It shows how these are integrated with MySQL management tools. Furthermore, it discusses how these mechanisms can be utilized by application developers, DBAs, and production engineers for tracking down performance issues and monitoring production systems.
The 5.5 and 5.6 releases of MySQL introduce several new mechanisms that provide improved monitoring and performance tuning functionality. Examples are performance schemas, InnoDB metrics tables, optimizer trace, and extended explain functionality. This session outlines the vision for monitoring-related functionality in MySQL and presents an overview of the new mechanisms. It shows how these are integrated with MySQL management tools. Furthermore, it discusses how these mechanisms can be utilized by application developers, DBAs, and production engineers for tracking down performance issues and monitoring production systems.
This presentation is the first of two aims to help you use the Active Session History (ASH) repository to investigate performance problems. Oracle has produced many presentations that explain how ASH works, so this presentation provides only a very brief overview of how ASH works. Instead, it looks at:
what information is collected by ASH and stored in the repository
where this data can be seen in Enterprise Manager and other delivered reports
the practicalities of how to directly query the ASH data to analyse and diagnose a range of performance and other problems.
the critical importance of application instrumentation
the value of a consolidated AWR/ASH repository
Introduction to Gatling performance testing tool and how we used it for testing Zonky's REST API. Example of running distributed performance tests in AWS Fargate with real-time monitoring with Logstash/ElasticSearch/Kibana stack.
E bpf and dynamic tracing for mariadb db as (mariadb day during fosdem 2020)Valeriy Kravchuk
eBPF on Linux 4.9+ is probably the best way to study performance problems. Basic usage of ftrace interface, bcc tools and bpftrace, as well as main bpftrace features and commands are presented. Several typical use cases
(including adding dynamic probes to MariaDB servers, working with stack traces and creating Flame Graphs) are discussed.
Flame Graphs for MySQL DBAs - FOSDEM 2022 MySQL DevroomValeriy Kravchuk
Flame graph is way to visualize profiling data that allows the most frequent code paths to be identified quickly and accurately. They can be generated using Brendan Gregg's open source programs on github.com/brendangregg/FlameGraph, which create interactive SVG files to be checked in browser. The source of profiling data does not really matter - it can be perf profiler, bpftrace, Performance Schema, EXPLAIN output or any other source that allows to convert the data into the expected format of comma-separated "path" plus metric per line.
Different types of Flame Graphs (CPU, Off-CPU, Memory, Differential etc) are presented. Various tools and approaches to collect profile information of different aspects of MySQL server internal working are presented Several real-life use cases where Flame Graphs helped to understand and solve the problem are discussed.
More on bpftrace for MariaDB DBAs and Developers - FOSDEM 2022 MariaDB DevroomValeriy Kravchuk
bpftrace is a relatively new open source tracer for modern Linux (kernels 5.x.y) that may help to troubleshoot performance issues in production as well as to get insights on how software really works. I use it for a couple of years and would like to present more details on how to do it efficiently, including but not limited to adding user probes to different lines of the code inside functions, checking values of local variables and using bpftrace as a code coverage tool.
MariaDB Server on macOS - FOSDEM 2022 MariaDB DevroomValeriy Kravchuk
Current MariaDB Server GA versions are formally not supported (and probably not even regularly built or tested) on macOS 10.x and 11.y. But it's relatively easy to set up the environment and build MariaDB Server from current 10.2 - 10.8 GitHub sources, with few minor issues to resolve in the process, depending on macOS and major server version used.
This talk is a summary of my related experience on 10.13 High Sierra that I had a chance to work on recently, with additional quick review of related fixed and open bugs, as well as some unique features like DTrace support that one may benefit from on macOS. Actually, studying DTrace in context of MariaDB Server troubleshooting and performance tuning was one of the goals why I started to use macOS again.
Tracing MariaDB server with bpftrace - MariaDB Server Fest 2021Valeriy Kravchuk
Bpftrace is a relatively new eBPF-based open source tracer for modern Linux versions (kernels 5.x.y) that is useful for analyzing production performance problems and troubleshooting software. Basic usage of the tool, as well as bpftrace one liners and advanced scripts useful for MariaDB DBAs are presented. Problems of MariaDB Server dynamic tracing with bpftrace and some possible solutions and alternative tracing tools are discussed.
MariaDB 10.5 new features for troubleshooting (mariadb server fest 2020)Valeriy Kravchuk
The recently released MariaDB 10.5 GA includes many new, useful features, but I’d like to concentrate on those helping DBAs and support engineers to find out what’s going on when a problem occurs.
Specifically I present and discuss the Performance Schema updates to match MySQL 5.7 instrumentation, new tables in the INFORMATION_SCHEMA to monitor the internals of a generic thread pool and improvements of ANALYZE for statements.
This session is about using GNU debugger (gdb) as a tool to study MySQL internals (namely, InnoDB locks and metadata locks) and as a last resort in cases when server hangs or has to be restarted for other reason. It never hurts to try a trick or two before giving up and restarting.
Sometimes MySQL DBAs have to work with stalled/hanged/unresponsive MySQL instance, where their usual SQL-based tricks do not work any more. Sometimes they can not even connect to check what's going on inside server.
In other cases they know what to do and everything still works, but they have to implement changes to read-only server variables. Server restart is often not an option in production, as it means some downtime and may cause negative performance impact.
In these cases one could do something given read and write access to server memory/internals. Here comes gdb, that, alone with careful reading of the source code helps to often resolve the problems described above. During this session I'll show what can be done with gdb when server already is in
troubles, and how to use gdb to "see" and understand MySQL internals (like InnoDB locks or metadata locks) better.
1. PERFORMANCE_SCHEMA in MySQL 5.6:
The Missing Manual
Valerii Kravchuk, Principal Support Engineer
valerii.kravchuk@percona.com
2. www.percona.com
Who am I?
Valerii (aka Valeriy) Kravchuk:
● MySQL Support Engineer in MySQL AB, Sun and Oracle, 2005 - 2012
○ Bugs Verification Team all this time
○ Support issues related to bugs, InnoDB, performance and more
○ Trainings (mostly informal) for new team members
○ All kinds of decision making committees…
● Principal Support Engineer in Percona, 2012 - ...
○ Doing more or less the same as before, but better (I hope)...
○ Plus I try to speak and write about MySQL in public now
● http://mysqlentomologist.blogspot.com - my blog about MySQL (mostly bugs)
● https://www.facebook.com/valerii.kravchuk - my Facebook page, a lot about
MySQL (mostly bugs…)
● http://bugs.mysql.com - my personal playground. 70 bugs reported in 2014
3. www.percona.com
What is this session about?
● How to find the root causes of MySQL server performance problems?
○ http://method-r.com/faq/35-what-is-method-r
○ Where time is spent?
● Proper instrumentation of the code, is it really important?
○ http://tkyte.blogspot.com/2005/06/instrumentation.html
○ http://en.wikipedia.org/wiki/Observer_effect_(physics)
● OS-level debug, trace and profiling tools, aren’t they allow to pinpoint any
performance problem in MySQL?
● Instrumentation in MySQL - PERFORMANCE_SCHEMA
○ History and engineers involved
○ Features in MySQL 5.6
○ How to use it?
○ Any alternatives in MySQL world?
○ Sources of additional information and tools
4. www.percona.com
Method R - common sense approach
1. Identify the most important task (the bottleneck)
2. Measure its response time (R) in detail
a. Time spent on useful processing
b. Time spent on waiting (I/O, locks, mutexes)
3. Optimize that response time in the most (economically)
efficient way
a. Process (do) less
b. Try to reduce waits of all kinds
4. Repeat until your system is (economically) optimal
5. www.percona.com
On Proper Instrumentation of Code
“Code instrumentation, what is it? To me, it is the fine art of
making approximately every other line of your developed
code “debug” of some sort. Trace information. With
timestamps. And meaningful information.” - Tom Kyte
“In science, the term observer effect refers to changes that
the act of observation will make on a phenomenon being
observed. This is often the result of instruments that, by
necessity, alter the state of what they measure in some
manner.” - Wikipedia
6. www.percona.com
Sources of information on performance
● Trace files from -debug binaries, optimizer trace files
● Extended slow query log
● show global status;
● show engine innodb statusG
● show engine innodb mutex;
● InnoDB-related tables in the INFORMATION_SCHEMA
● userstat (Percona Server and other builds)
● show profiles;
● Poor man’s profiler (pt-pmp) or real profilers (perf, oprofile)
● DTrace
● tcpdump analysis (see https://vividcortex.com/blog/2014/02/25/performance-schema-slow-
query-log-tcp-sniffing/)
● In MySQL 5.6+ it’s time to use PERFORMANCE_SCHEMA!
7. www.percona.com
Extended slow query log
● Feature of Percona Server (5.1+)
● http://www.percona.com/doc/percona-server/5.5/diagnostics/slow_extended_55.html
# User@Host: mailboxer[mailboxer] @ [192.168.10.165]
# Thread_id: 11167745 Schema: board
# Query_time: 1.009400 Lock_time: 0.000190 Rows_sent: 4 Rows_examined: 1543719
Rows_affected: 0 Rows_read: 4
# Bytes_sent: 278 Tmp_tables: 0 Tmp_disk_tables: 0 Tmp_table_sizes: 0
# InnoDB_trx_id: 1500
# QC_Hit: No Full_scan: Yes Full_join: No Tmp_table: No Tmp_table_on_disk: No
# Filesort: No Filesort_on_disk: No Merge_passes: 0
# InnoDB_IO_r_ops: 6415 InnoDB_IO_r_bytes: 105103360 InnoDB_IO_r_wait: 0.001279
# InnoDB_rec_lock_wait: 0.000000 InnoDB_queue_wait: 0.000000
# InnoDB_pages_distinct: 6430
SET timestamp=1346844943;
SELECT id,title,production_year FROM title WHERE title = 'Bambi';
8. www.percona.com
Percona Server and userstat
http://www.percona.com/doc/percona-server/5.6/diagnostics/user_stats.html:
● Introduced in Google patch, allows to solve many performance issues
● Additional tables in INFORMATION_SCHEMA:
○ CLIENT_STATISTICS
○ THREAD_STATISTICS
○ USER_STATISTICS
○ TABLE_STATISTICS
○ INDEX_STATISTICS
● Easy to configure:
○ http://dom.as/2013/04/17/on-performance-schemas/
● Low performance impact as some sources say:
○ http://www.mysqlperformanceblog.com/2012/06/02/how-expensive-is-user_statistics/
● But some sources say it adds overhead:
○ “and then, once userstat=1 the regression is horrible.. over 30%... “
● Hardly this can help with mutexes or waits…
9. www.percona.com
Time to try PERFORMANCE_SCHEMA
● We know how to find functions where most of the time was spent (profiling)
● We know how to find mutex waits that were long enough to force OS wait, or
how to find blocking row locks...
● If we need more details, specifically time spent waiting… it’s time to use
PERFORMANCE_SCHEMA it seems
● Sample output while test (for Bug #68079) was running, naive attempt
(the time is in picoseconds, 1E-12, 0.000 000 000 001):
mysql> select event_name, count_star, sum_timer_wait from performance_schema.
events_waits_summary_global_by_event_name where event_name like
'wait/synch/mutex/innodb%' and count_star > 0 order by sum_timer_wait desc limit 5;
+--------------------------------------------+------------+----------------+
| event_name | count_star | sum_timer_wait |
+--------------------------------------------+------------+----------------+
| wait/synch/mutex/innodb/os_mutex | 71754726 | 11380485535846 |
| wait/synch/mutex/innodb/trx_sys_mutex | 60057 | 4191727883 |
| wait/synch/mutex/innodb/buf_pool_mutex | 8655 | 468303388 |
| wait/synch/mutex/innodb/mutex_list_mutex | 10310 | 427385546 |
| wait/synch/mutex/innodb/rw_lock_list_mutex | 8304 | 316946749 |
+--------------------------------------------+------------+----------------+
5 rows in set (0.00 sec)
10. www.percona.com
Some history behind...
● Read the WorkLogs:
○ http://dev.mysql.com/worklog/task/?id=2360 - “Why we're doing this”
○ http://dev.mysql.com/worklog/task/?id=4674 - “Setup for Actors”
○ http://dev.mysql.com/worklog/task/?id=4513 - “Implement it…”
● Where the name comes from?
“Proposals for the schema name were DYNAMIC (but that is a reserved word in
standard SQL), PERFORMANCE_SCHEMA (Jim Winstead's suggestion),
PERFORMANCE (Peter's preference), and DBTrace because it sounds like DTrace.
There was a vote (see dev-private thread "WL#2360 Vote: schema name and table
name"). The winner was PERFORMANCE_SCHEMA.” - Peter Gulutzan
“
11. www.percona.com
Basic ideas and terms
PERFORMANCE_SCHEMA (aka PS, P_S, PFS):
● Inspired by Oracle Wait Interface
● Separate database and storage engine
● Records run time statistics via built-in instrumentation points
● Designed to let us get the answers to the following questions:
○ Where was time spent?
○ Who has used most of resources/time?
○ What was executed to to use these?
○ When it was executed?
● Appeared in MySQL 5.5, improved and ON by default in MySQL 5.6 (52
tables), and is documented and explained in many details already:
○ http://dev.mysql.com/doc/refman/5.6/en/performance-schema.html
● Implemented by Marc Alff (http://marcalff.blogspot.com/)
● Deal with instruments (including wait events), consumers, objects (tables for
now) that are monitored, threads (some of them background) that run and
actors (users) that execute SQL statements (in stages - thread statuses).
13. www.percona.com
What to do with these tables?
● Table names are lowercase and long (events_statements_summary_by_digest)
● Column names are uppercase
● Tables are “in memory”, no indexes, content disappear or is reinitiated upon restart
● In general you are supposed to SELECT … FROM ..., UPDATE selected columns
(setup_* tables), INSERT or DELETE (setup_actors, setup_objects) rows or run
TRUNCATE TABLE (events_* tables and *_summary_* tables)
use performance_schema
DESC events_waits_current;
SHOW CREATE TABLE setup_timersG
UPDATE setup_instruments SET ENABLED=”YES”, TIMED=”YES”;
UPDATE setup_consumers SET ENABLED=”YES”;
SELECT * FROM threads;
TRUNCATE TABLE events_statements_summary_by_digest;
● TRUNCATE TABLE for summary tables resets summary columns to 0 or NULL
○ All but events_statements_summary_by_digest - digest rows are removed
● You need SELECT, UPDATE, … and DROP privileges, accordingly
14. www.percona.com
So, how to use P_S?
● The amount of information in the manual is huge, it seems not easy to start using
P_S
○ I wish it would be as easy as setting TIMED_STATISTICS to TRUE with ALTER
SYSTEM + few queries to V$SESSTATS, V$SYSSTATS or V$SESSION_WAIT
● Marc Alff explains in http://marcalff.blogspot.com/2013/04/on-configuring-
performance-schema.html:
○ “Define your goals” - for example, we have waits and we need to find out what
waits are most important based on time wasted (or waited)
○ “Define what to instrument” - we need to instrument InnoDB waits mutex waits
and internal lock waits, but how to do this? Details next, but:
■ "wait/synch/mutex/%", for mutexes
■ "wait/synch/rwlock/%", for read write locks
○ “Define how much detail to collect” - depends on goals...
○ “Provide sizing data” - autosizing based on max_connections (mostly)
○ “Monitor sizing problems” - memory used vs dropped statistics and impact
15. www.percona.com
Define your goals
● From casual monitoring (“non-blocking SHOW”) to debugging “hangs” and solving
complex scalability problems...
● Examples include:
○ Monitoring file I/O globally for capacity planning
○ Extended threads monitoring (“better SHOW PROCESSLIST”)
○ Performance of SQL statements by stages (“extended slow query log”)
○ Load by database and by table, unused indexes etc (“userstat”, setup_objects)
○ Find InnoDB scalability bottlenecks (“hot” mutex or rwlock)
● Set realistic goals. PERFORMANCE_SCHEMA (in 5.6) is NOT any good for:
○ Checking row locks in InnoDB tables (or explaining deadlocks)
○ Checking metadata locks (until 5.7.3)
○ Finding memory leaks (until 5.7.x)
○ Keeping historical data about performance (buffers are limited, no disk storage)
○ Explaining optimizer decisions (there is optimizer trace for this in 5.6)
● Instruments to enable, level of details to collect and overhead depend on goals and
deployment (production server vs development machine)
● It makes sense to concentrate on things you can control/change
16. www.percona.com
Define what to instrument
● It’s controlled by the content of setup_instuments table
● By default the following instruments are enabled (for slow SQL or I/O mostly):
○ File I/O
○ Table I/O
○ Table lock
○ Statements
○ Idle
● Dynamic (all but wait/synch/%), can be set in my.cnf also
mysql> select * from performance_schema.setup_instruments where enabled='YES' limit 5;
+---------------------------------+---------+-------+
| NAME | ENABLED | TIMED |
+---------------------------------+---------+-------+
| wait/io/file/sql/map | YES | YES |
| wait/io/file/sql/binlog | YES | YES |
| wait/io/file/sql/binlog_index | YES | YES |
| wait/io/file/sql/relaylog | YES | YES |
| wait/io/file/sql/relaylog_index | YES | YES |
+---------------------------------+---------+-------+
5 rows in set (0.00 sec)
17. www.percona.com
How instruments are named?
● http://dev.mysql.com/doc/refman/5.6/en/performance-schema-instrument-
naming.html:
○ "wait/io/file/%" - file io
○ "wait/io/socket/%" - network io
○ "wait/io/table/%" - table io
○ "wait/lock/table/%" - table locks
○ "wait/synch/cond/%" - conditions
○ "wait/synch/mutex/%" - mutexes
○ "wait/synch/rwlock/%" - read write locks
○ "stage/%" - stages of statement execution (see show profile)
○ "idle" - clients idle time.
○ "statement/com/%" - commands in the client/server protocol
○ "statement/sql/%" - SQL queries (and some more statement/…)
Hint: bold means “new in MySQL 5.6”, blue color means enabled by default
18. www.percona.com
Define how much details to collect
● It’s controlled by the content of setup_consumers table
● Dynamic, can be set in my.cnf also
● By default the following instruments are enabled (global, thread, statements digest
and details about statements), they are ring buffers (sizing discussed later):
mysql> select * from performance_schema.setup_consumers;
+--------------------------------+---------+
| NAME | ENABLED |
+--------------------------------+---------+
| events_stages_current | NO | # current stage of execution per thread
| events_stages_history | NO | # 10 recent stage events per thread
| events_stages_history_long | NO | # 10000 recent stage events overall
| events_statements_current | YES | # P_S.events_statements_current (details…)
| events_statements_history | NO | # historical data, 10 recent per thread
| events_statements_history_long | NO | # historical data, 10000 recent overall
| events_waits_current | NO | # current wait event per thread
| events_waits_history | NO | # 10 recent wait events per thread
| events_waits_history_long | NO | # 10000 recent wait events overall
| global_instrumentation | YES | # P_S enabled or not essentially (1 table)
| thread_instrumentation | YES | # Statistics collection per thread (userstat)
| statements_digest | YES | # P_S.events_statements_summary_by_digest
+--------------------------------+---------+
12 rows in set (0.00 sec)
19. www.percona.com
Example: setup for checking waits...
● http://mysqlentomologist.blogspot.com/2013/01/how-to-use-performanceschema-
to-check.html - my experience back at MySQL 5.6 RC stage...
● To set up InnoDB mutex waits monitoring via PERFORMANCE_SCHEMA in
general with MySQL 5.6.x you should do at least the following:
1. Start MySQL server with all mutex related instruments enabled at startup
(performance_schema=ON by default), like this:
mysqld_safe --performance_schema_instrument='wait/synch/mutex/innodb/%=on' &
2. Connect to server and set up proper consumers explicitly, like this:
UPDATE performance_schema.setup_consumers SET enabled = 'YES'
WHERE name like 'events_waits%';
3. Run your problematic load.
4. Check waits using whatever tables you need
20. www.percona.com
Example: everything enabled in my.cnf
To set up all instruments and consumers (once and forever) in my.cnf, add:
performance_schema_instrument = '%=on'
performance_schema_consumer_events_stages_current = ON
performance_schema_consumer_events_stages_history = ON
performance_schema_consumer_events_stages_history_long = ON
performance_schema_consumer_events_statements_current = ON
performance_schema_consumer_events_statements_history = ON
performance_schema_consumer_events_statements_history_long = ON
performance_schema_consumer_events_waits_current = ON
performance_schema_consumer_events_waits_history = ON
performance_schema_consumer_events_waits_history_long = ON
performance_schema_consumer_global_instrumentation = ON
performance_schema_consumer_thread_instrumentation = ON
performance_schema_consumer_statements_digest = ON
21. www.percona.com
Define proper sizing for data collected
● Default sizes may just work (autosizing happens):
mysql> show global variables like 'performance_schema%';
+--------------------------------------------------------+-------+
| Variable_name | Value |
+--------------------------------------------------------+-------+
| performance_schema | ON |
| performance_schema_accounts_size | 100 |
| performance_schema_digests_size | 10000 |
| performance_schema_events_stages_history_long_size | 10000 |
| performance_schema_events_stages_history_size | 10 |
...
| performance_schema_max_mutex_instances | 15906 |
...
● The following 4 server variables define autosizing heuristic:
○ max_connections
○ table_definition_cache
○ table_open_cache
○ open_files_limit (it also depends on ulimit at OS level and defines size of 3
above if it’s not high enough to accept settings)
22. www.percona.com
Monitor sizing problems
● Too big means a lot of memory used (no memory leaks though!)
● Too small means partial data collected and performance degradation
● When this happens proper status variable *_lost (23 in total) is incremented:
mysql> show global status like 'performance_schema%';
+-----------------------------------------------+-------+
| Variable_name | Value |
+-----------------------------------------------+-------+
| Performance_schema_accounts_lost | 0 |
| Performance_schema_cond_classes_lost | 0 |
| Performance_schema_cond_instances_lost | 0 |
| Performance_schema_digest_lost | 1 | # <-- problem
...
● It’s easy to check the amount of memory used with SHOW ENGINE...:
mysql> show engine performance_schema status;
...
| performance_schema | events_statements_summary_by_digest.row_size
| 1472 |
| performance_schema | events_statements_summary_by_digest.row_count
| 10000 |
| performance_schema | events_statements_summary_by_digest.memory
| 14720000 |
...
| performance_schema | performance_schema.memory
| 421469376 |
23. www.percona.com
What you can find out with default P_S
● What every foreground thread is doing:
mysql> select * from performance_schema.events_statements_currentG
*************************** 1. row ***************************
THREAD_ID: 32
EVENT_ID: 240
END_EVENT_ID: NULL
EVENT_NAME: statement/sql/select
SOURCE: mysqld.cc:939
TIMER_START: 450538953130416024
TIMER_END: NULL
TIMER_WAIT: NULL
LOCK_TIME: 18001000000
SQL_TEXT: select * from performance_schema.events_statements_current
...
ERRORS: 0
WARNINGS: 0
ROWS_AFFECTED: 0
ROWS_SENT: 0
ROWS_EXAMINED: 0
CREATED_TMP_DISK_TABLES: 0
CREATED_TMP_TABLES: 0
...
NO_INDEX_USED: 1
NO_GOOD_INDEX_USED: 0
25. www.percona.com
What you can find out with default P_S
● What is in the host cache:
mysql> select host, last_error_seen, count_host_acl_errors
-> from performance_schema.host_cache;
+-------+---------------------+-----------------------+
| host | last_error_seen | count_host_acl_errors |
+-------+---------------------+-----------------------+
| pc-PC | 2014-03-02 17:42:09 | 1 |
+-------+---------------------+-----------------------+
1 row in set (0.00 sec)
● What tables are used a lot or caused a lot of waits:
mysql> select object_schema, object_name, count_star, sum_timer_wait
-> from performance_schema.table_io_waits_summary_by_table
-> order by 4 desc limit 5;
+---------------+-----------------------+------------+----------------+
| object_schema | object_name | count_star | sum_timer_wait |
+---------------+-----------------------+------------+----------------+
| test | t | 19 | 41330631677220 |
| test | test2 | 4 | 26094282300 |
| test | tt | 4 | 122427090 |
| mysql | db | 0 | 0 |
| mysql | time_zone_leap_second | 0 | 0 |
+---------------+-----------------------+------------+----------------+
5 rows in set (16.33 sec)
26. www.percona.com
Example 1: slow statement execution
# Make sure we have historical events collected about stages
mysql> select count(*) from performance_schema.events_stages_history_long;
+----------+
| count(*) |
+----------+
| 2893 |
+----------+
1 row in set (0.09 sec)
# Find query that spent longest time on some stage, can you guess why from the below?
mysql> select stg.event_name, stmt.sql_text,
-> stg.timer_wait/1000000000000 wait_s
-> from performance_schema.events_stages_history_long stg
-> join performance_schema.events_statements_history_long stmt
-> on (stg.nesting_event_id=stmt.event_id)
-> where 1=1
-> /*stg.event_name like '%Sending data%'*/
-> and stmt.rows_examined < 100000 /* stmt.rows_sent < 100000 */
-> and stg.timer_wait > 10*1000000000000
-> order by stg.timer_wait desc limit 1G
*************************** 1. row ***************************
event_name: stage/sql/updating
sql_text: update tt set c1=c1+1
wait_s: 51.0647
1 row in set (0.03 sec)
27. www.percona.com
Example 2: current waits
# Make sure we have all waits we care about instrumented
mysql> select e.event_name, e.source, e.operation, t.processlist_info
-> from performance_schema.events_waits_current e
-> join performance_schema.threads t on t.thread_id=e.thread_id
-> where type='foreground' and t.processlist_id <> connection_id()G
*************************** 1. row ***************************
event_name: wait/io/table/sql/handler
source: handler.cc:2687
operation: fetch
processlist_info: update tt set c1=c1+1
1 row in set (0.08 sec)
2686 MYSQL_TABLE_IO_WAIT(m_psi, PSI_TABLE_FETCH_ROW, MAX_KEY, 0,
2687 { result= rnd_next(buf); })
2688 DBUG_RETURN(result);
mysql> select e.event_name, e.source, e.operation, t.processlist_info
-> from performance_schema.events_waits_current e
-> join performance_schema.threads t on t.thread_id=e.thread_id
-> where type='foreground' and t.processlist_id <> connection_id()G
*************************** 1. row ***************************
event_name: idle
source: mysqld.cc:909
operation: idle
processlist_info: NULL
1 row in set (0.15 sec)
28. www.percona.com
Example 3: hot files for disk I/O
mysql> select event_name, count_star, sum_timer_wait/1000000000000 wait_s from
performance_schema.file_summary_by_event_name order by 3 desc limit 5;
+---------------------------+------------+--------+
| event_name | count_star | wait_s |
+---------------------------+------------+--------+
| wait/io/file/sql/FRM | 1982 | 4.2914 |
| wait/io/file/sql/binlog | 136 | 1.3193 |
| wait/io/file/myisam/kfile | 1608 | 0.8984 |
| wait/io/file/myisam/dfile | 739 | 0.4980 |
| wait/io/file/archive/data | 12 | 0.2637 |
+---------------------------+------------+--------+
5 rows in set (0.01 sec)
# This is where to look for file names
mysql> select file_name, sum_timer_wait/1000000000000 wait_s from
performance_schema.file_summary_by_instance order by 2 desc limit 5;
+-----------------------------------------------------------------+--------+
| file_name | wait_s |
+-----------------------------------------------------------------+--------+
| C:ProgramDataMySQLMySQL Server 5.6datapc-PC-bin.000013 | 0.2703 |
| C:ProgramDataMySQLMySQL Server 5.6datatest#sql-233c_e.frm | 0.2052 |
| C:ProgramDataMySQLMySQL Server 5.6datapc-PC-bin.000010 | 0.2002 |
| C:ProgramDataMySQLMySQL Server 5.6datapc-PC-bin.000014 | 0.1344 |
| C:ProgramDataMySQLMySQL Server 5.6datapc-PC-bin.index | 0.1253 |
+-----------------------------------------------------------------+--------+
5 rows in set (0.00 sec)
29. www.percona.com
Example 4: better PROCESSLIST
mysql> select
-> processlist_id as Id, processlist_user as User,
-> processlist_host as Host,
-> processlist_db as db, processlist_command as Command,
-> processlist_time as Time, processlist_state as State,
-> processlist_info as Info
-> from performance_schema.threads
-> where type='FOREGROUND'G
*************************** 1. row ***************************
Id: 1
User: root
Host: localhost
db: test
Command: Query
Time: 0
State: Sending data
Info: select
processlist_id as Id, processlist_user as User,
processlist_host as Host,
processlist_db as db, processlist_command as Command,
processlist_time as Time, processlist_state as State,
processlist_info as Info
from performance_schema.threads
where type='FOREGROUND'
1 row in set (0.00 sec)
30. www.percona.com
Example 5: SHOW PROFILES remake
mysql> show warningsG
*************************** 1. row ***************************
Level: Warning
Code: 1287
Message: '@@profiling' is deprecated and will be removed in a future release.
1 row in set (0.06 sec)
# we may have no SHOW PROFILES in MySQL 5.7! Get ready:
mysql> select event_id as Query_ID, timer_wait/1000000000000 as Duration, sql_text as Query
-> from performance_schema.events_statements_history_long statements
-> join performance_schema.threads threads
-> on threads.thread_id = statements.thread_id
-> where threads.processlist_id = connection_id()
-> order by Duration desc limit 2G
*************************** 1. row ***************************
Query_ID: 50
Duration: 0.8202
Query: desc information_schema.schemata
*************************** 2. row ***************************
Query_ID: 1333
Duration: 0.7237
Query: select event_id as Query_ID, timer_wait/1000000000000 as Duration, sql_text as Query
from performance_schema.events_statements_history_long statements
join performance_schema.threads threads
...
2 rows in set (0.02 sec)
32. www.percona.com
ps_helper To the Rescue!
● Developed by Mark Leith, MySQL expert @ Oracle
○ worked in MySQL Support team since 2005
○ senior software development manager @Oracle now (MEM, maybe MEB)
○ good Oracle RDBMS background
● Easier to use comparing to “raw” PERFORMANCE_SCHEMA
● Ready to use collection of views, stored routines and...
● Recently even an easy way to create ps, P_S, PFS or whatever synonym you like!
● git clone https://github.com/MarkLeith/dbahelper.git dbahelper - if you prefer...
● Installed in a separate schema (ps_helper)
● IO/latency/waits/statement digests
● Tools to simplify P_S configuration changes, convenient data presentation, and more
Links:
● http://www.markleith.co.uk/ps_helper/
● https://github.com/MarkLeith/dbahelper/archive/master.zip
● https://www.slideshare.net/Leithal/performance-schema-andpshelper
33. www.percona.com
ps_helper: basics
Install:
openxs@ao756:/tmp/ps_helper/dbahelper-master$ mysql -uroot -proot < ps_helper_56.sql
Check:
mysql> show tables;
+-------------------------------------------------+
| Tables_in_ps_helper |
+-------------------------------------------------+
| _digest_95th_percentile_by_avg_us |
| _digest_avg_latency_by_avg_us |
| check_lost_instrumentation |
...
53 rows in set (0,00 sec)
mysql> select routine_name from information_schema.routines where
routine_schema='ps_helper';
+-------------------------------+
| routine_name |
+-------------------------------+
| analyze_statement_digest |
...
20 rows in set (0,00 sec)
34. www.percona.com
ps_helper: configuration-related SPs
● reset_to_default(FALSE) - default configuration no matter what is in my.cnf
● save_current_config() - save current configuration in temporary tables
● reload_saved_config() - restore saved configuration
● truncate_all(FALSE) - truncate all the events and summary tables:
mysql> select count(*) from performance_schema.events_statements_summary_by_digest;
+----------+
| count(*) |
+----------+
| 6 |
+----------+
1 row in set (0,00 sec)
mysql> call ps_helper.truncate_all(FALSE);
Query OK, 0 rows affected (0,03 sec)
mysql> select count(*) from performance_schema.events_statements_summary_by_digest;
+----------+
| count(*) |
+----------+
| 1 |
+----------+
1 row in set (0,00 sec)
35. www.percona.com
ps_helper: slow statement execution
● Let’s assume you’ve noted some slow enough statement:
select digest, digest_text from performance_schema.events_statements_summary_by_digestG
...
*************************** 16. row ***************************
digest: f1a302160f89f76cbe60a86761a8c58d
digest_text: INSERT INTO `t1` ( `c1` ) SELECT `c1` FROM `t1`
● You can try to analyze it in details:
mysql> call ps_helper.analyze_statement_digest('f1a302160f89f76cbe60a86761a8c58d', 30, 1.0, FALSE,
FALSE);
...
+------------+-------------+-----------+-----------+---------------+---------------+------------
+------------+
| executions | exec_time | lock_time | rows_sent | rows_affected | rows_examined | tmp_tables |
full_scans |
+------------+-------------+-----------+-----------+---------------+---------------+------------
+------------+
| 1 | 00:01:08.84 | 428.00 us | 0 | 262144 | 524288 | 1 | 1 |
+------------+-------------+-----------+-----------+---------------+---------------+------------
+------------+
1 row in set (30,36 sec)
...
36. www.percona.com
ps_helper.analyze_statement_digest()
...
+-------------------------------------+-------+-----------+
| event_name | count | latency |
+-------------------------------------+-------+-----------+
| stage/sql/Sending data | 1 | 3.53 s |
| stage/sql/converting HEAP to MyISAM | 1 | 326.79 ms |
| stage/sql/query end | 1 | 128.05 ms |
| stage/sql/removing tmp table | 1 | 16.78 ms |
| stage/sql/init | 2 | 299.73 us |
| stage/sql/Creating tmp table | 1 | 109.72 us |
| stage/sql/Opening tables | 1 | 104.24 us |
| stage/sql/statistics | 1 | 54.66 us |
| stage/sql/closing tables | 1 | 51.30 us |
| stage/sql/System lock | 1 | 43.07 us |
| stage/sql/freeing items | 1 | 42.29 us |
| stage/sql/preparing | 1 | 36.15 us |
| stage/sql/checking permissions | 2 | 18.98 us |
| stage/sql/optimizing | 1 | 14.15 us |
| stage/sql/end | 1 | 8.06 us |
| stage/sql/executing | 1 | 5.57 us |
| stage/sql/cleaning up | 1 | 3.71 us |
| stage/sql/logging slow query | 1 | 2.32 us |
+-------------------------------------+-------+-----------+
18 rows in set (30,37 sec)
# and more outputs...
37. www.percona.com
ps_helper: hot tables...
mysql> select * from ps_helper.schema_table_statistics_with_buffer limit 1G
*************************** 1. row ***************************
table_schema: test
table_name: t1
rows_fetched: 524306
fetch_latency: 20.97 s
rows_inserted: 524288
insert_latency: 00:01:47.45
rows_updated: 0
update_latency: 0 ps
rows_deleted: 0
delete_latency: 0 ps
io_read_requests: 14
io_read: 1.42 KiB
io_read_latency: 73.96 us
io_write_requests: 7992
io_write: 254.04 MiB
io_write_latency: 1.11 s
io_misc_requests: 253
io_misc_latency: 20.18 s
innodb_buffer_allocated: 107.17 MiB # these are from I_S.INNODB_BUFFER_PAGE
innodb_buffer_data: 99.16 MiB
innodb_buffer_pages: 6859
innodb_buffer_pages_hashed: 6859
innodb_buffer_pages_old: 6859
innodb_buffer_rows_cached: 473493
1 row in set (2,89 sec)
38. www.percona.com
ps_helper: better PROCESSLIST
# smart view to get a lot of useful information easily
mysql> SELECT * FROM ps_helper.processlist WHERE conn_id = CONNECTION_ID()G
*************************** 1. row ***************************
thd_id: 24
conn_id: 5
user: root@localhost
db: test
command: Query
state: Sending data
time: 0
current_statement: SELECT * FROM ps_helper.proces ... HERE conn_id = CONNECTION_ID()
last_statement: NULL
last_statement_latency: NULL
lock_latency: 4.98 ms
rows_examined: 0
rows_sent: 0
rows_affected: 0
tmp_tables: 1
tmp_disk_tables: 0
full_scan: YES
last_wait: wait/io/file/myisam/dfile
last_wait_latency: 4.74 us
source: mi_dynrec.c:201
1 row in set (0,03 sec)
39. www.percona.com
ps_helper: why is it useful?
Have some real fun:
openxs@ao756:/tmp/ps_helper/dbahelper-master$ mysql -uroot -proot ps_helper <
procedures/create_synonym_db.sql
Warning: Using a password on the command line interface can be insecure.
mysql> call create_synonym_db('performance_schema', 'ps');
Query OK, 0 rows affected (2,35 sec)
mysql> use ps
Reading table information for completion of table and column names
You can turn off this feature to get a quicker startup with -A
Database changed
mysql> show tables;
+----------------------------------------------------+
| Tables_in_ps |
+----------------------------------------------------+
| accounts |
...
Use ps_helper.format_time(SUM(sum_timer_wait)):
● Check Bug #70252 to find out what may happen if you don’t use it
● Check https://www.slideshare.net/Leithal/performance-schema-andpshelper
40. www.percona.com
ps_helper: why is it useful?
Saves a lot of keystrokes...
More fancy views:
● statement_analysis
● statements_with_runtimes_in_95th_percentile
● statements_with_full_table_scans
● statements_with_sorting
● statements_with_temp_tables
● …
More fancy stored procedures and functions:
● dump_thread_stack() - allows to produce .dot files → .png or .pdf
● format_statement()
● format_time()
● format_bytes()
● format_path()
41. www.percona.com
PERFORMANCE_SCHEMA - The Good
● Monitoring is available on all platforms supported by MySQL
● Activating the Performance Schema causes no (few) changes in server behavior
○ No persistent on-disk storage
○ Memory allocation at server startup
○ Processing happens mostly at events retrieval
○ No new keywords or threads added
● Overhead is small comparing to some other ways to monitor
● Problems/failures in P_S code should not prevent server from working normally
● It is easy to add new instrumentation points (they say)
● Under active development:
○ Very few bugs - 4 active in MySQL 5.6.16 as of February 22, 2014
○ Even more features in MySQL 5.7: check Bug #69527 (MDL locks!)
● Used by Oracle internally a lot for real things (MEM, performance improvements)
● As it’s based on proper ideas, eventually it’s going to become an ultimate solution
for MySQL performance monitoring (and replace everything else)
42. www.percona.com
PERFORMANCE_SCHEMA - The Bad
● Performance overhead in default configuration is notable in
some cases (10-30%, see bug reports and 3rd party studies)
● Additional memory use is notable (see Bug #68514):
○ “Why is this not a bug? On my x86-64 with 5.6.12 when
performance_schema=1 then the extra RAM is:
max_connections * 196kb” - Mark Callaghan
● Mutex and rw-lock waits instrumentation must be enabled at
server startup
● How complete is the instrumentation?
● There are bugs and missing parts in the manual
● There are (few) bugs in implementation
● Is this kind of instrumentation really good? (SQL, no trace)
43. www.percona.com
Bugs in PERFORMANCE_SCHEMA
Bug #68413 - Facebook: “performance_schema overhead is at least 10%”
Bug #71204 - Timing for stages in P_S is different from what SHOW PROFILE reports
Bug #71634 - P_S digest looks wrong for system variables, shown as @ @ variable…
Bug #71682 - PROCESSLIST_ID for slave sql thread is missing
Bug #68574 - “No instrumentation for InnoDB files in P_S on windows” - same with
5.6.16, by the way...
Bug #68785 - new features (connection attributes) work well together (or not)...
Bug #66589 - still not fixed (do not use mysqlhotcopy). One of the last bugs I verified in
Oracle...
Bug #68514 - beware of memory usage impact with P_S
44. www.percona.com
Missing manual: verified bug reports
Bug #68097 - Manual does not explain that some P_S instruments must be
enabled at startup
Bug #71274 - Manual does not provide enough details about background threads
in P_S.THREADS
Bug #71276 - Manual does not explain PROCESSLIST_STATE in P_S.
THREADS properly
Bug #71293 - Manual page for P_S.FILE_INSTANCES table does not explain
EVENT_NAME values
Bug #71303 - Manual page on P_S build configuration does not provide enough
details
Bug #71304 - Manual does not provide enough details about automatic sizing of
P_S parameters
These were reported by me and tagged with “missing manual”. There are more...
45. www.percona.com
PERFORMANCE_SCHEMA - The Ugly
● Names: schema name, long table names… you know whom to blame (and thank
for ps_helper). I wish we have public synonyms in MySQL, so I’d create
V$SYSSTATS (Bug #68855). You can create views, but that’s overhead, no?
● Why additional views and procedures (ps_helper) are not there by default (Bug
#71207)? - going to be solved with SYS schema
● Some important things and storage engines are not properly instrumented yet,
MDL locks, for example… ups, seems fixed in 5.7.3
● Heuristics to control size (read Bug #68514 again)… less than obvious and I’d
prefer more control
● Make up your mind on what should be in P_S vs I_S vs SHOW statements. Think
about SHOW PROCESSLIST vs I_S.PROCESSLIST vs P_S.THREADS
● Want to know what else users care about? Check feature requests for P_S (11
“Verified” as of November 2, 2013), some of them are limitations “by design”:
○ Bug #69881 - “Try to compute elapsed time for an event which has not completed” - Todd Farmer
○ Bug #66515 - “I have a problem with PS instrumentation that can only be enabled at server start.” -
Mark Callaghan
○ Bug #70383 - “Implement a SELECT-syntax/statement as a synonym for SHOW ENGINE
performance_schema STATUS” - Peter Laursen
46. www.percona.com
PERFORMANCE_SCHEMA in MySQL 5.6
Useful reading (and names to remember):
● http://marcalff.blogspot.com/2013/04/on-configuring-performance-schema.html - article from Mark
Alff on how to configure PERFORMANCE_SCHEMA
● http://dev.mysql.com/doc/refman/5.6/en/performance-schema-configuration.html - RTFM
● http://dimitrik.free.fr/blog/archives/2013/07/mysql-performance-why-performance-schema-overhead.
html - overhead explained and measured by Dimitri Kravtchuk:
● http://www.percona.com/webinars/using-mysql-56-performance-schema-troubleshoot-typical-
workload-bottlenecks - webinar by Peter Zaitsev (May 15, 2013)
● http://mysql.wisborg.dk/category/mysql/performance_schema/ - useful posts from Jesper Krogh on
the topic. He had created yet another set of tools to make out life easier, ps_tools: http://mysql.
wisborg.dk/2013/10/10/mysql-connect-2013-ps_tools/
● http://mysqlblog.fivefarmers.com/tag/performance_schema/ - practical use of
PERFORMANCE_SCHEMA, by Todd Farmer
● http://www.slideshare.net/SvetaSmirnova/performance-schema-for-mysql-troubleshooting - practical
guide from Oracle’s Senior Principal Support engineer Sveta Smirnova
47. www.percona.com
Percona Live 2014, April 1-4, 2014
http://www.percona.com/live/mysql-conference-2014/home
Two sessions on PERFORMANCE_SCHEMA there:
● Is performance_schema worth the overhead?
● MySQL 5.7: Performance Schema Improvements
● Many more on MySQL performance in general...