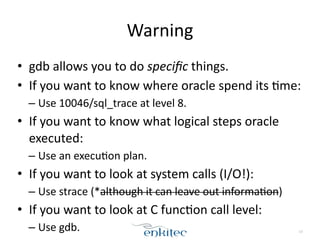
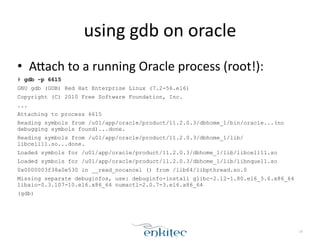
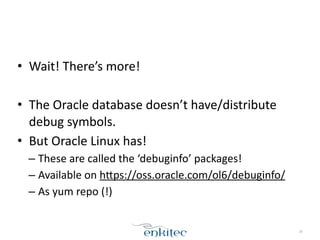
This document provides an introduction to using the GNU debugger (GDB) for profiling C function sequences in Oracle databases. It discusses how GDB can be used to attach to running Oracle processes and set breakpoints to pause execution when specific functions are entered. This allows analyzing function call flows and identifying performance bottlenecks. The document also covers limitations of using GDB due to Oracle binaries not containing debug symbols and being dynamically linked.


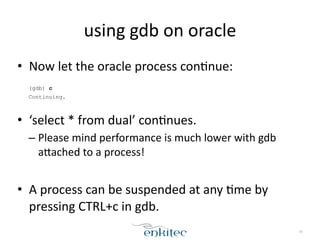


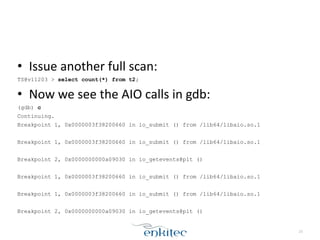

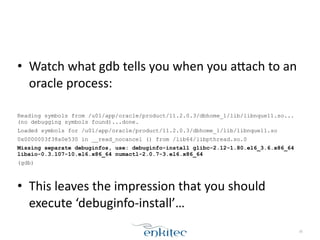
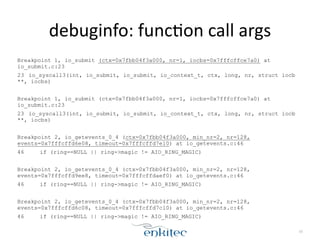
![• Add
these
funcXons
to
the
breaks:
(gdb) break io_submit
Breakpoint 1 at 0x3f38200660
(gdb) break 'io_getevents@plt'
Breakpoint 2 at 0xa09030
(gdb) rbreak ^kslwt[be]ctx
Breakpoint 3 at 0x8f9a652
<function, no debug info> kslwtbctx;
Breakpoint 4 at 0x8fa1334
<function, no debug info> kslwtectx;
(gdb) commands 1-4
Type commands for breakpoint(s) 1-4, one per line.
End with a line saying just "end".
>c
>end
(gdb) c
Continuing.
26](https://image.slidesharecdn.com/minisessiongdb-140819145944-phpapp02/85/Mini-Session-Using-GDB-for-Profiling-26-320.jpg)

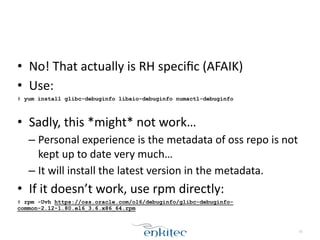
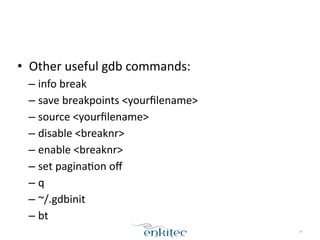
![• Add
the
debuginfo
repository
to
your
yum
config:
!
# vi /etc/yum.repos.d/debuginfo.repo
[ol6_debuginfo]
name=Oracle Linux 6 debuginfo
baseurl=http://oss.oracle.com/ol6/debuginfo
gpgkey=https://oss.oracle.com/ol6/RPM-GPG-KEY-oracle
gpgcheck=1
enabled=1
29](https://image.slidesharecdn.com/minisessiongdb-140819145944-phpapp02/85/Mini-Session-Using-GDB-for-Profiling-29-320.jpg)


![Introduction to MySQL Query Tuning for Dev[Op]s](https://cdn.slidesharecdn.com/ss_thumbnails/qtdevops-191005204425-thumbnail.jpg?width=640&height=640&fit=bounds)