Download to read offline


![select *
from
goods
join
categories
on
(categories.id=goods.cat_id)
where
date_added between ’2018-07-01’ and ’2018-08-01’
and
cat_id in (16,11)
and
price >= 1000 and <=10000 [ and ... ]
[ GROUP BY ... [ORDER BY ... [ LIMIT ...]]]
;
JOIN
13](https://image.slidesharecdn.com/histogramsoow2019-190921043520/75/A-Billion-Goods-in-a-Few-Categories-When-Optimizer-Histograms-Help-and-When-They-Don-t-25-2048.jpg)
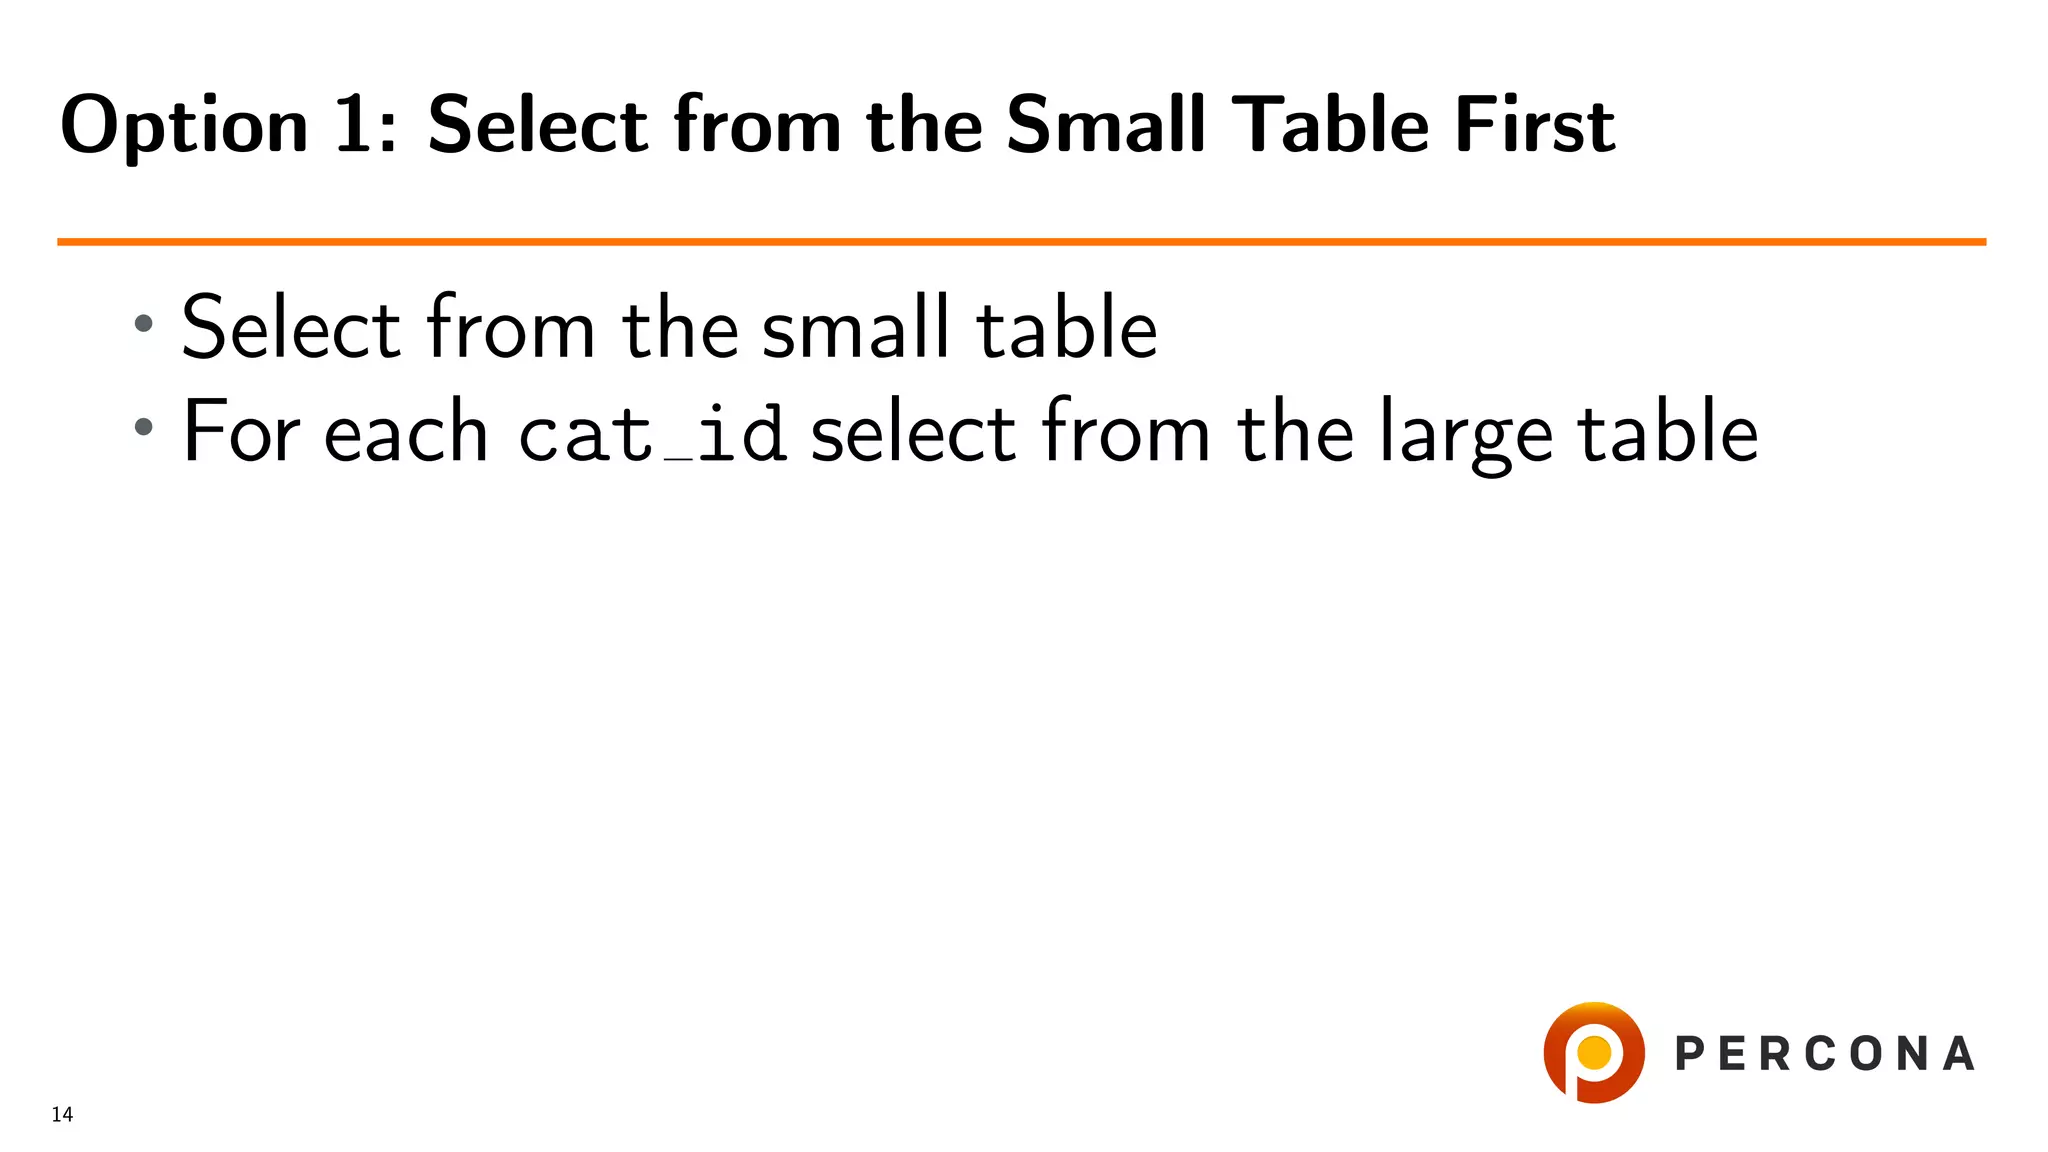
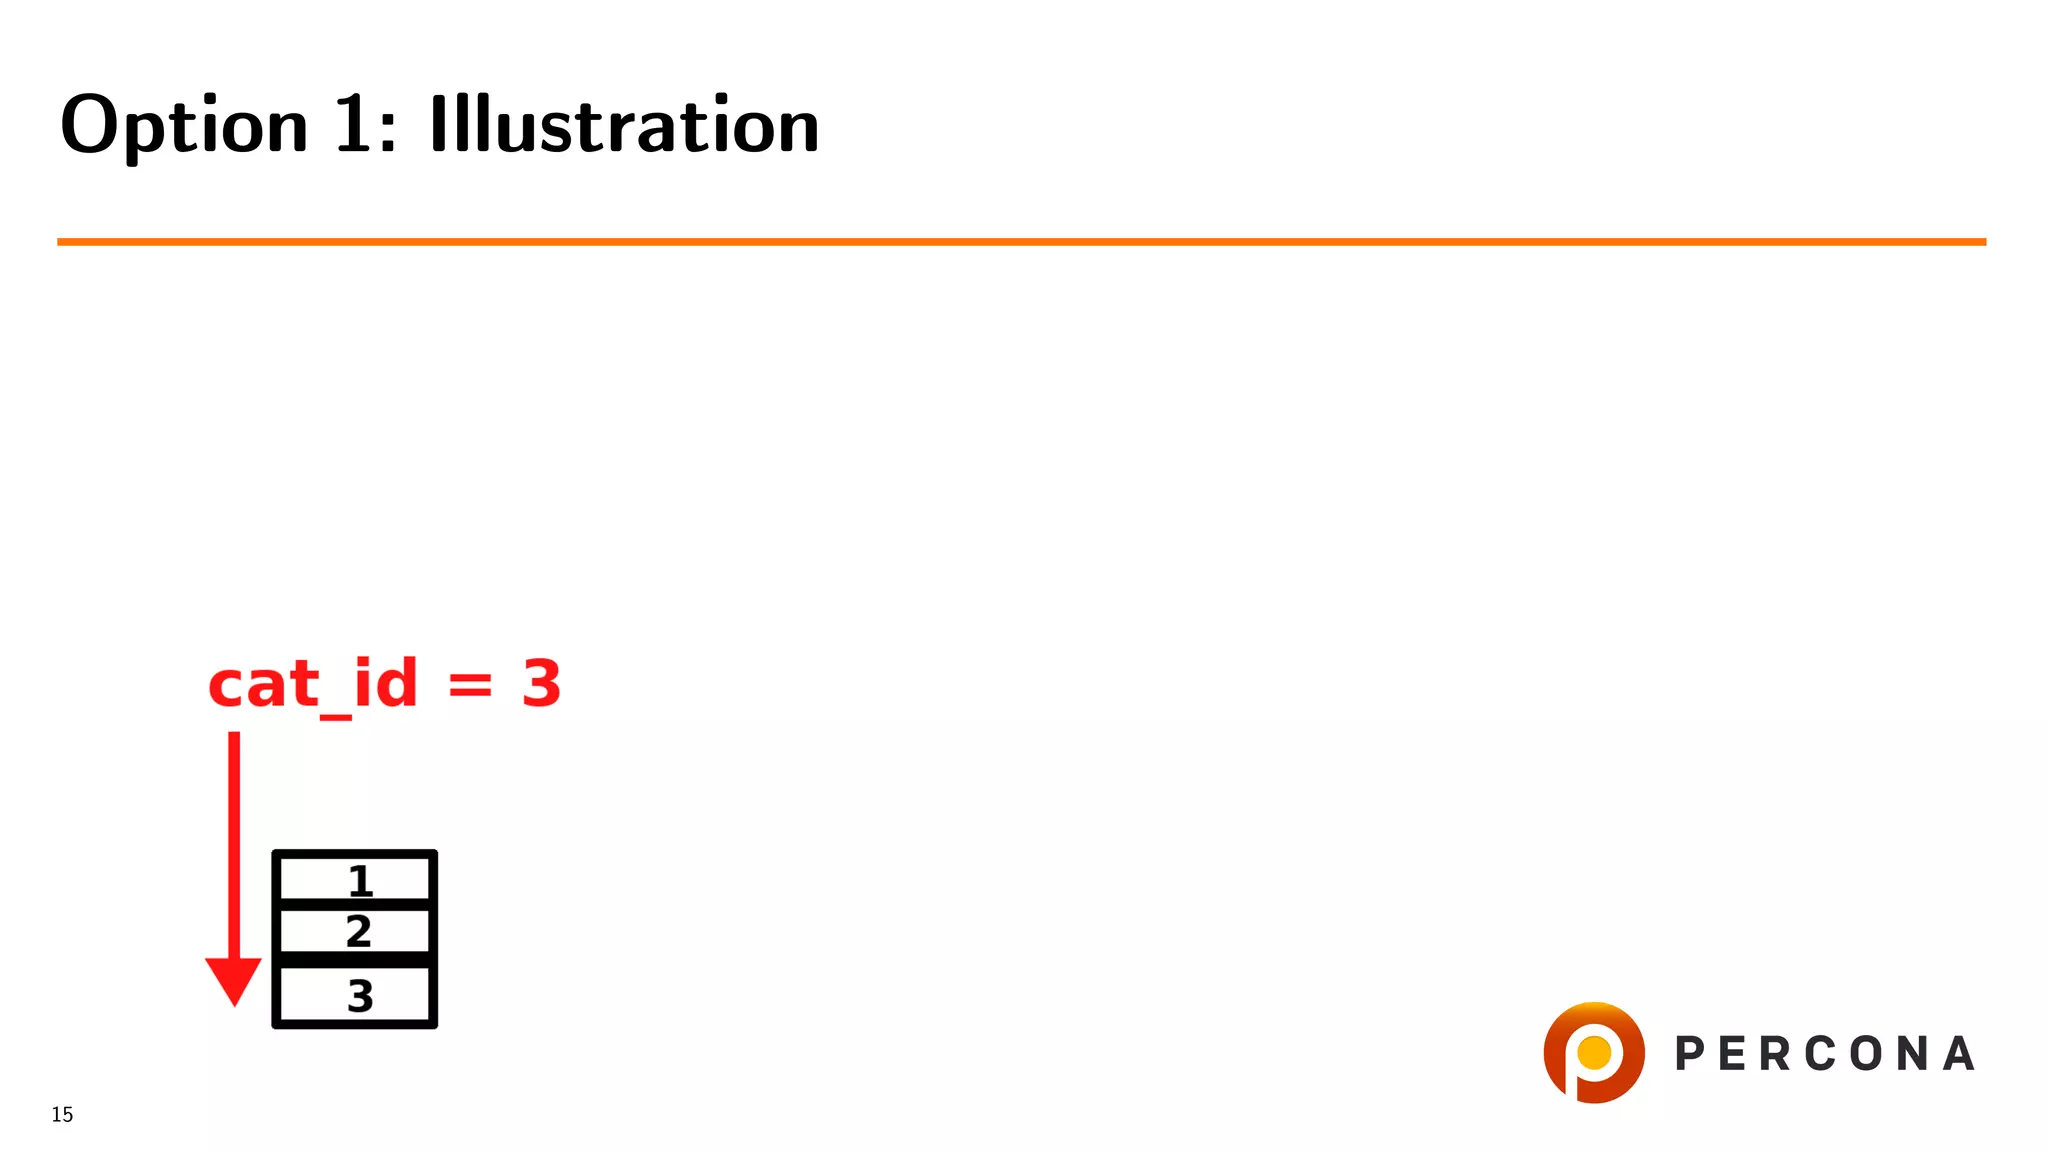
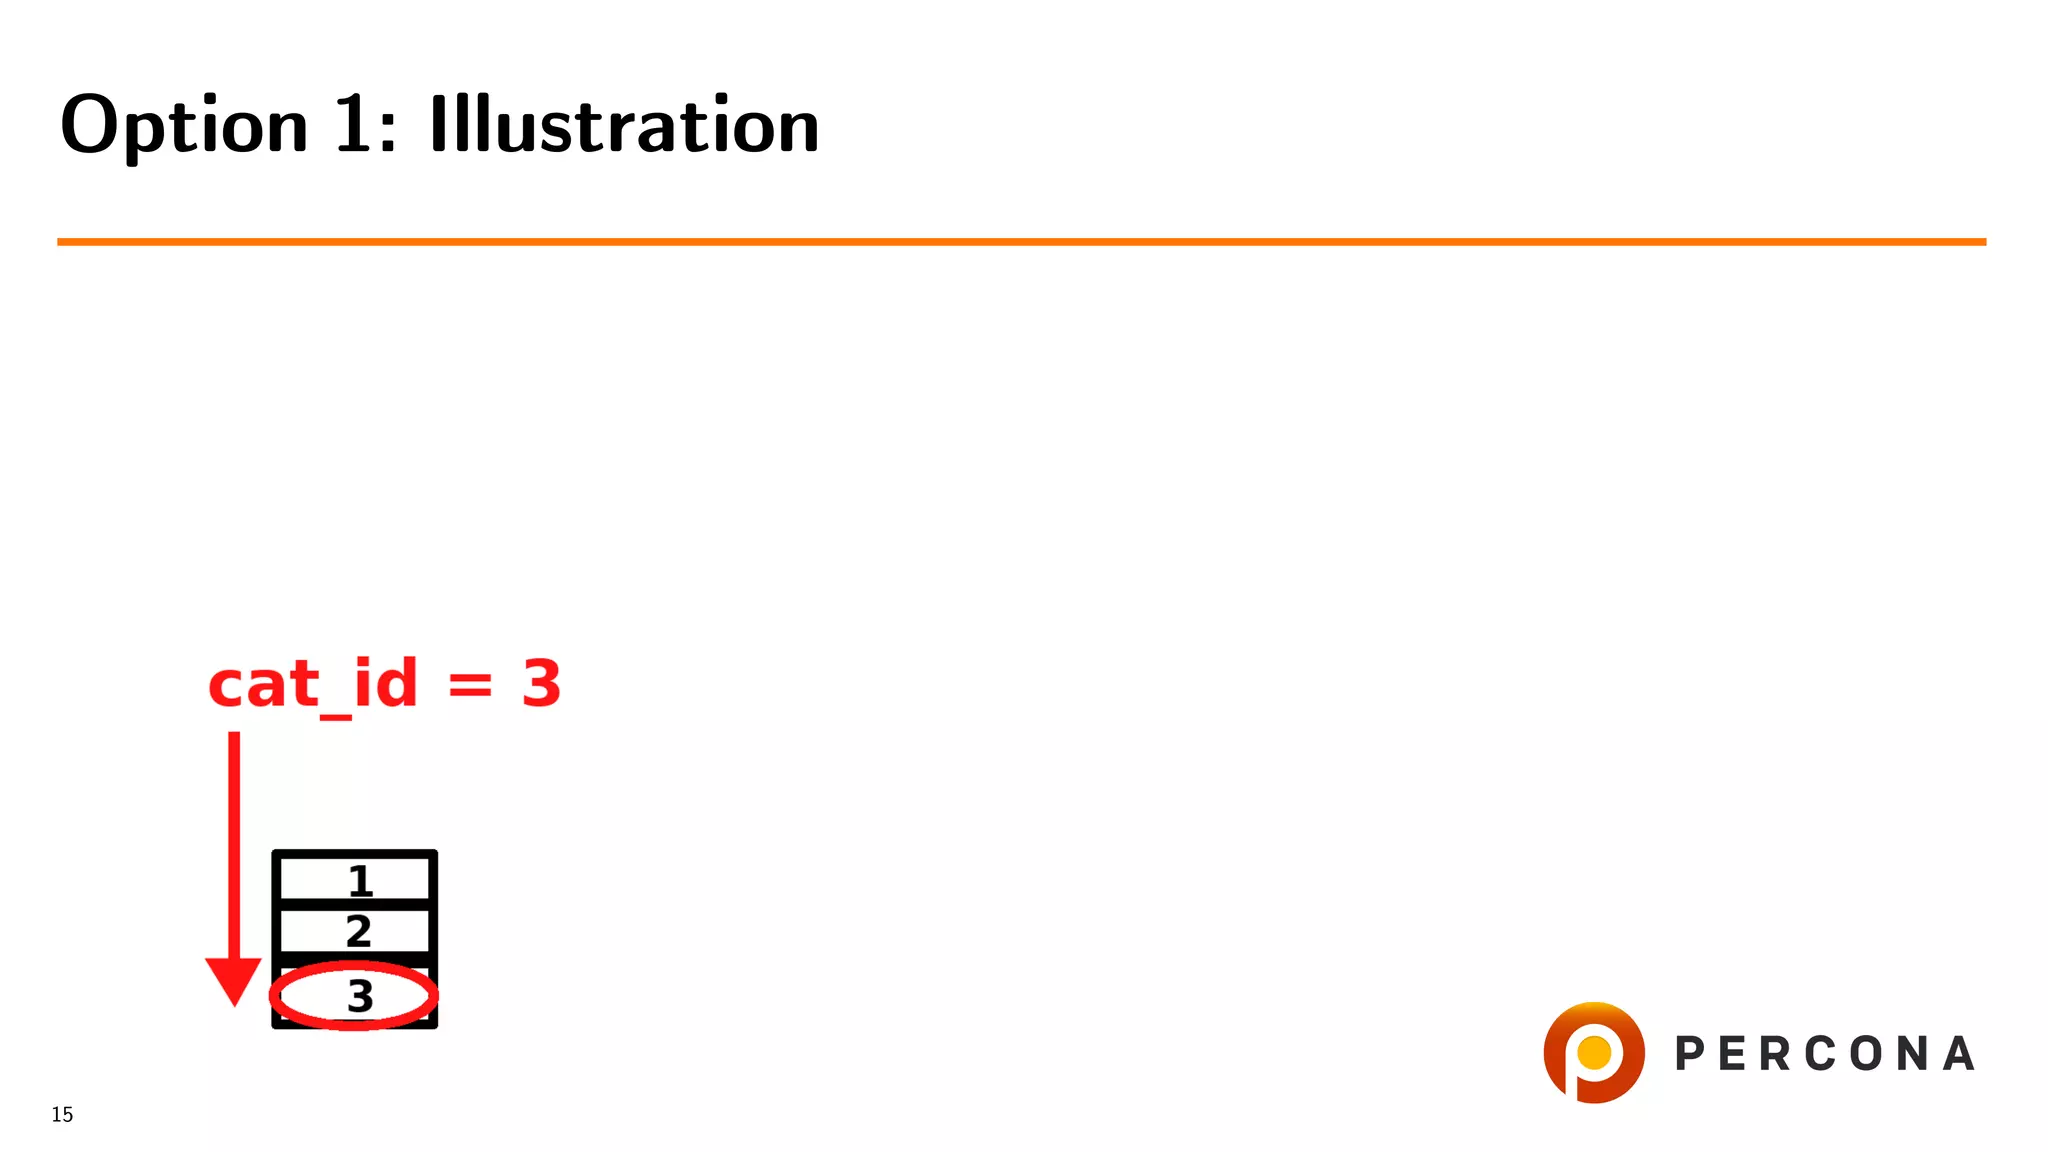
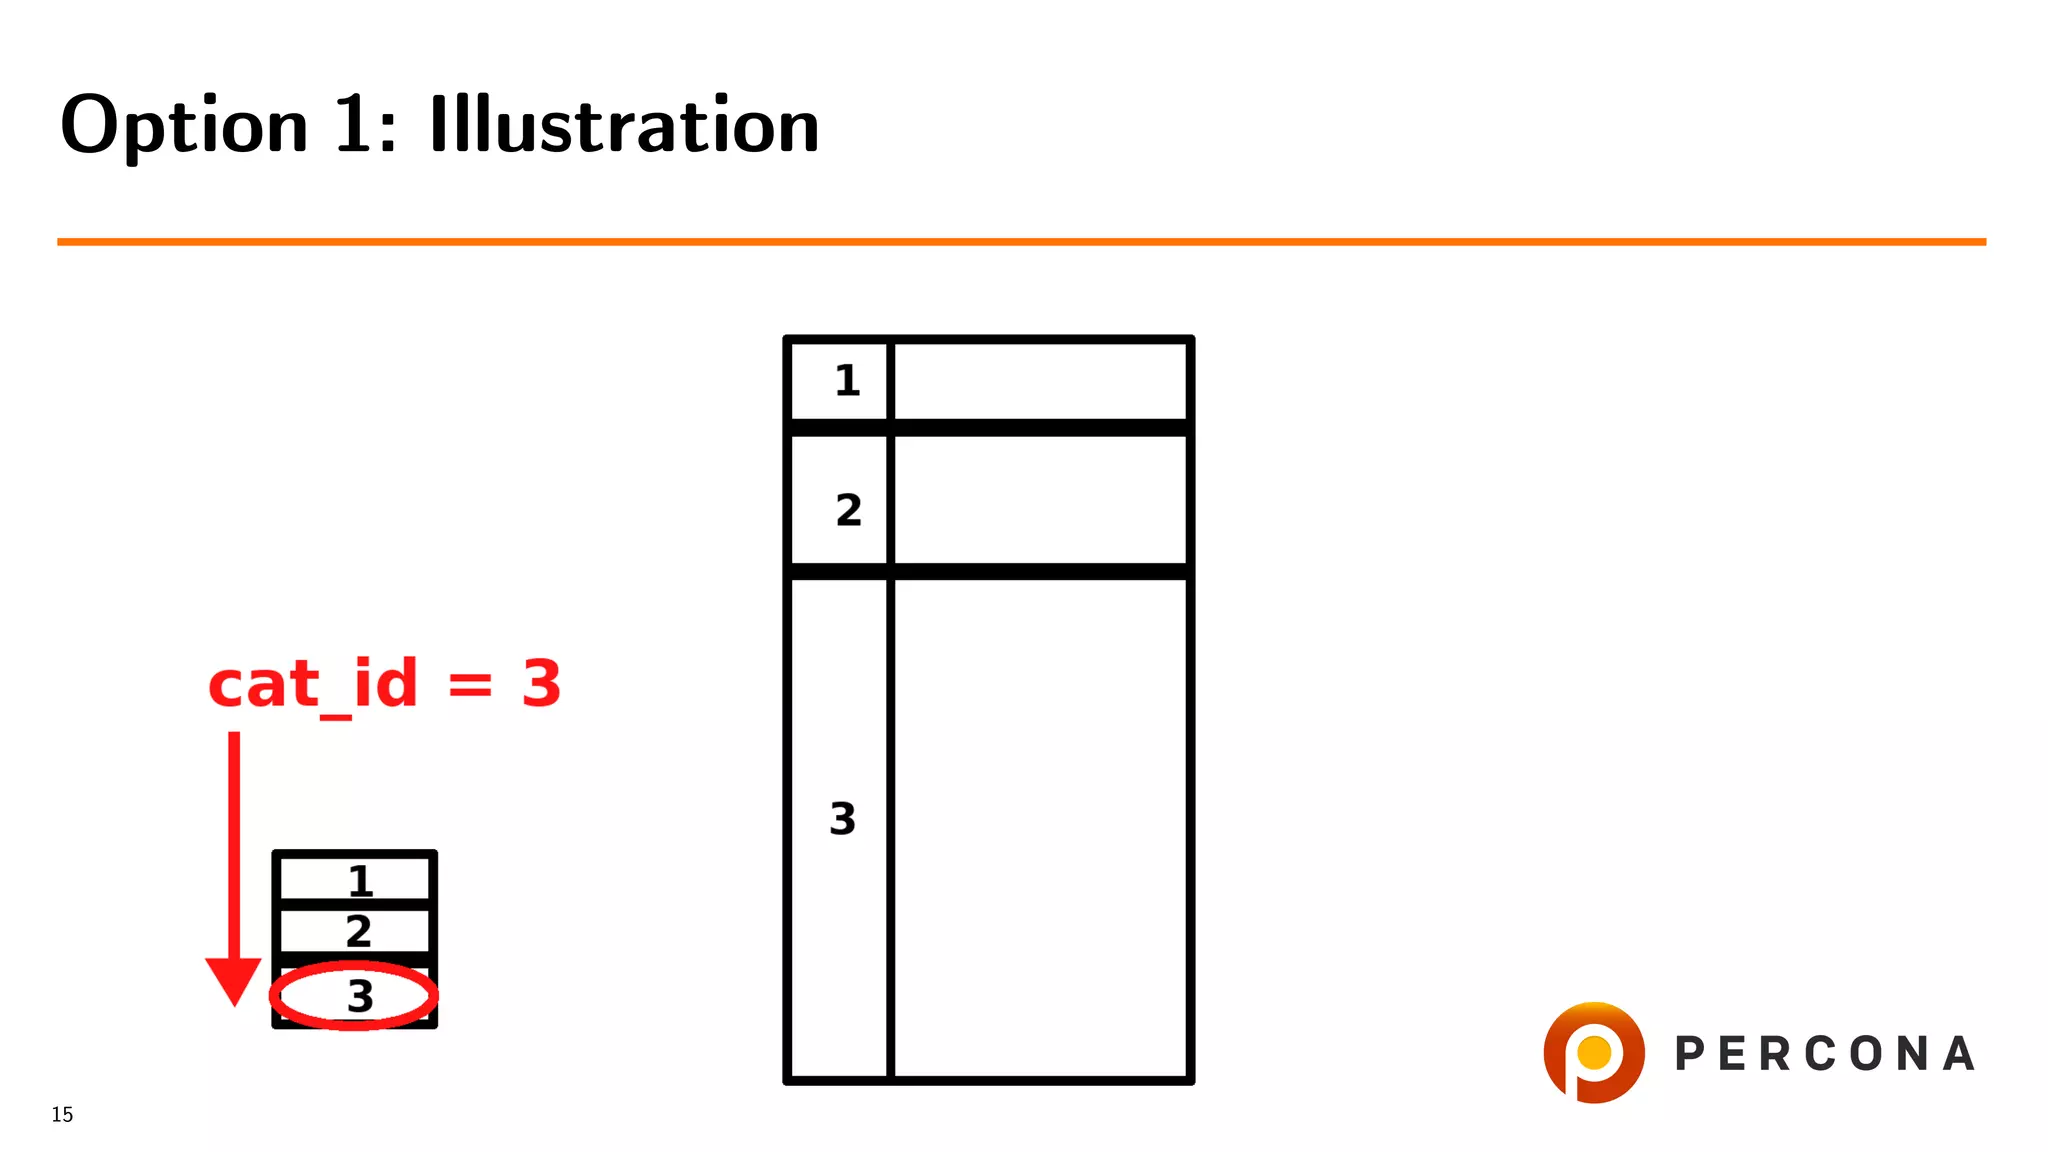
![• Select from the small table
• For each cat id select from the large table
• Filter result on date added[ and price[...]]
Option 1: Select from the Small Table First
14](https://image.slidesharecdn.com/histogramsoow2019-190921043520/75/A-Billion-Goods-in-a-Few-Categories-When-Optimizer-Histograms-Help-and-When-They-Don-t-28-2048.jpg)
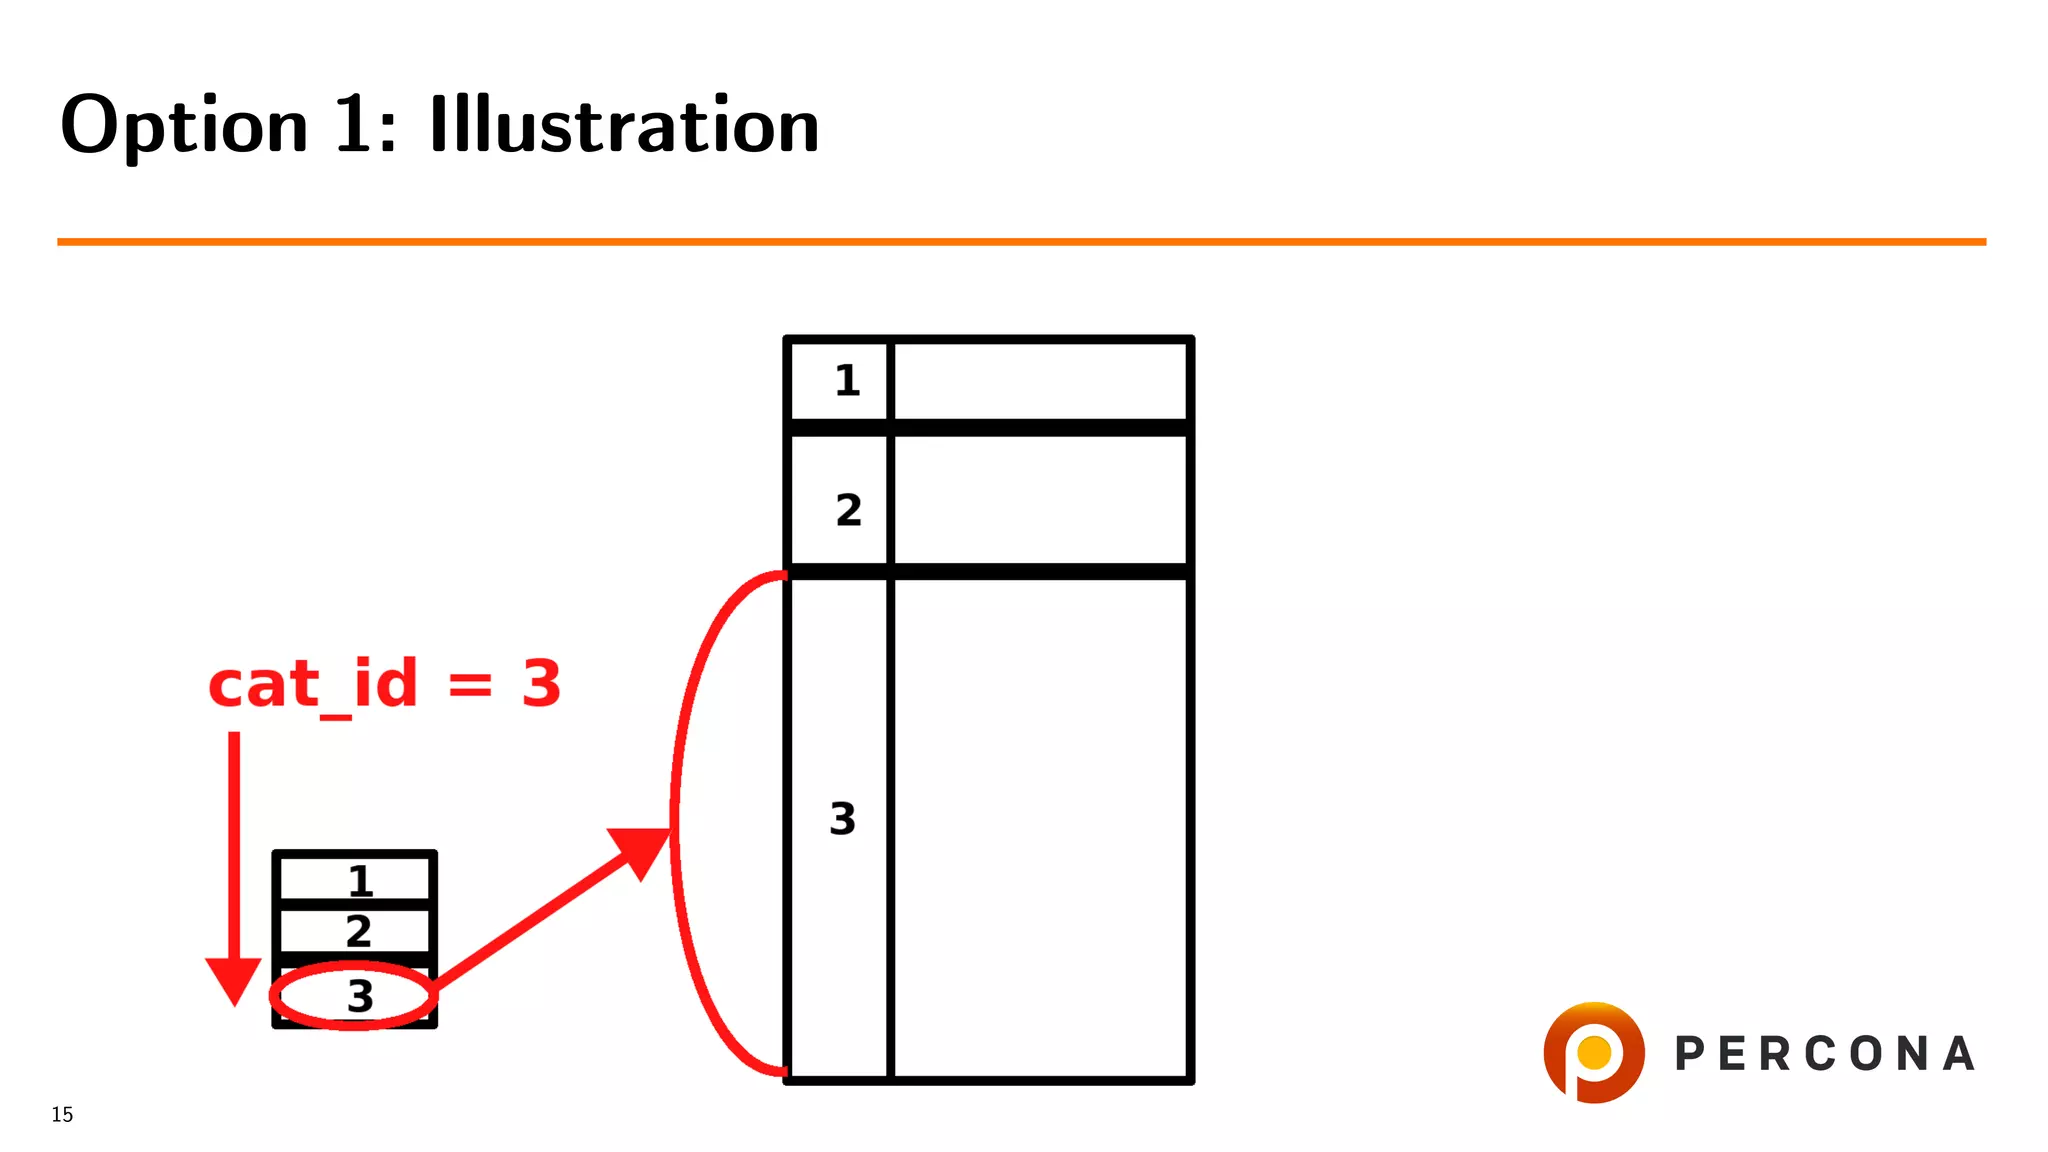
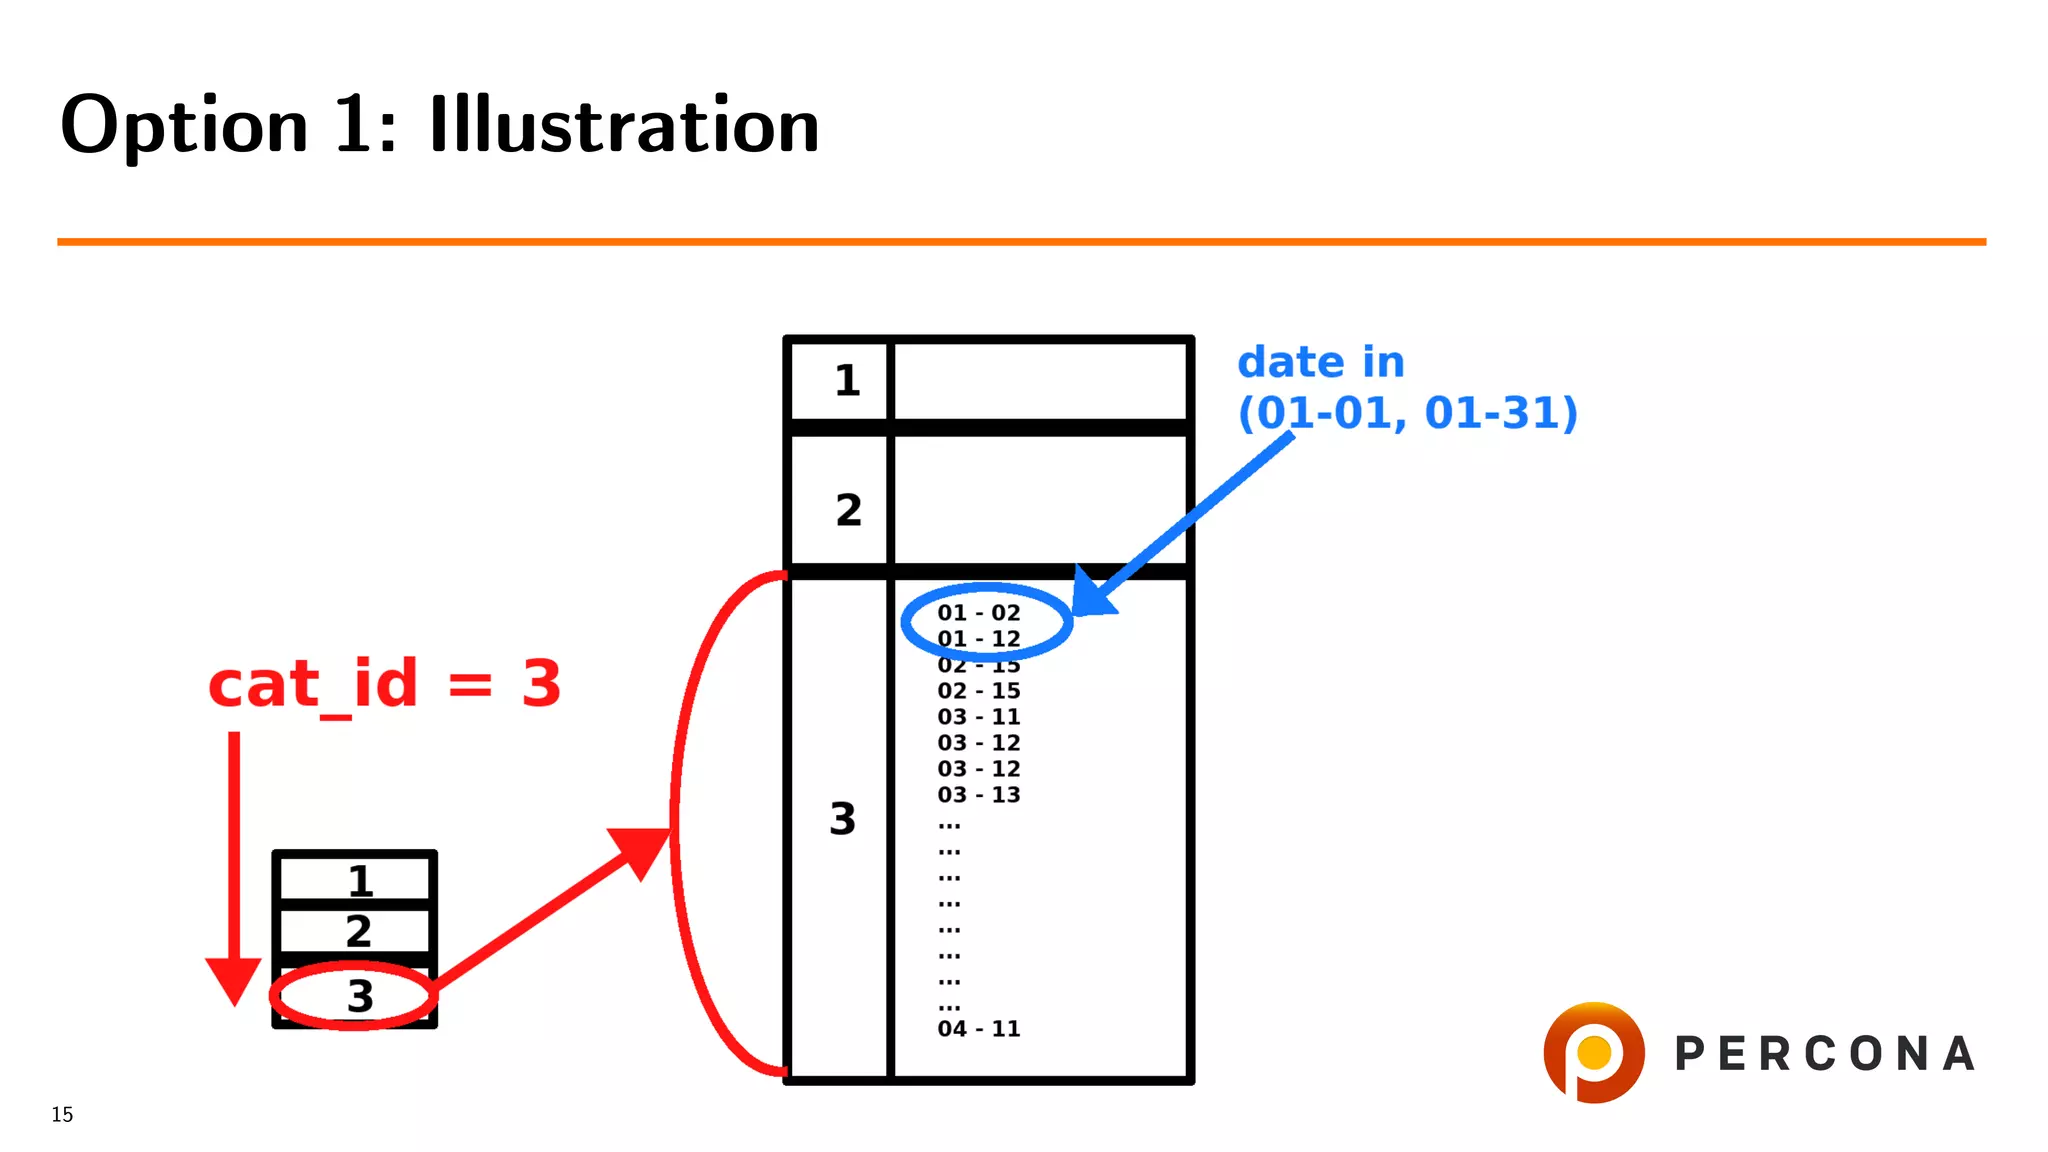
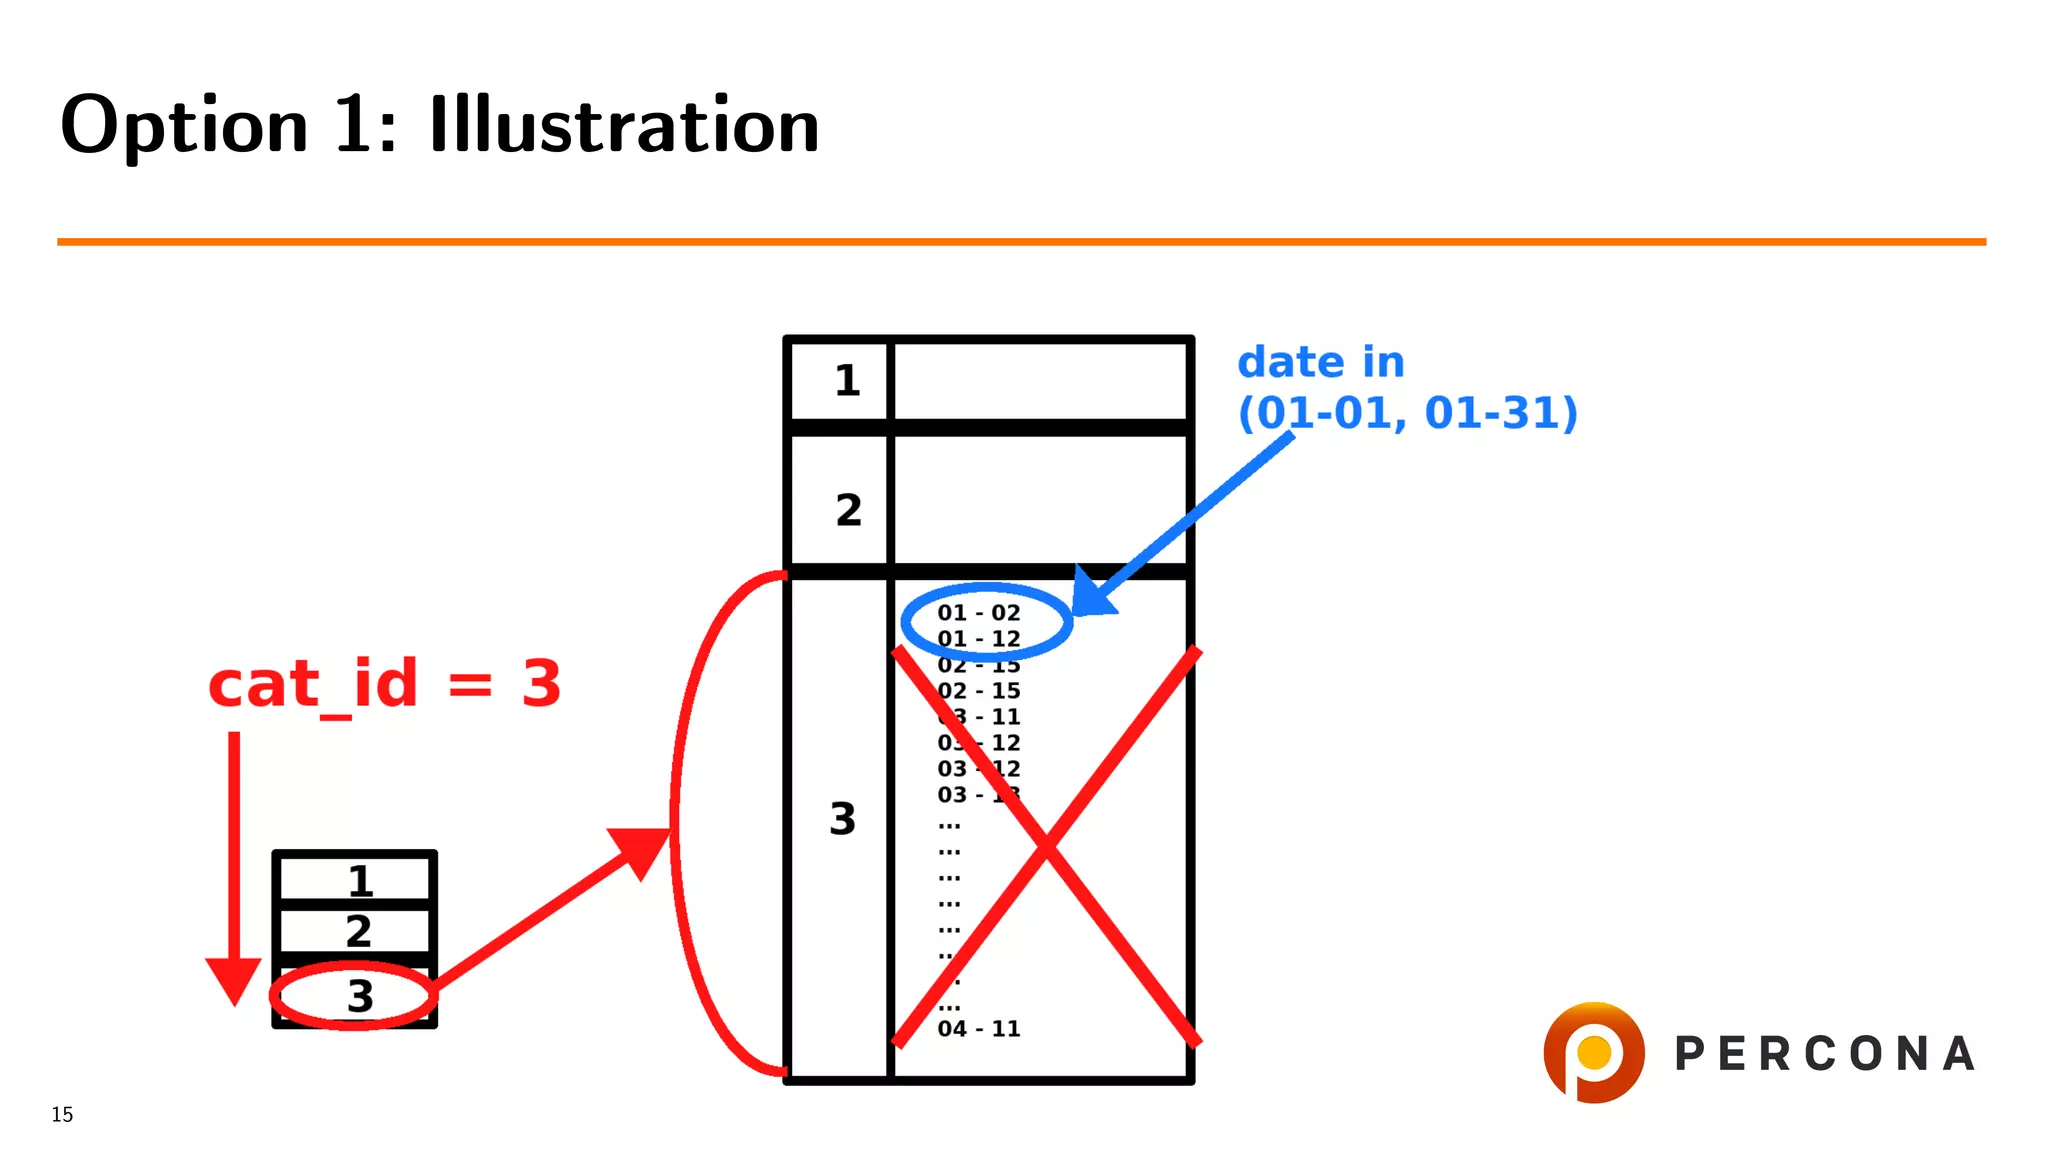
![• Select from the small table
• For each cat id select from the large table
• Filter result on date added[ and price[...]]
• Slow with many items in the category
Option 1: Select from the Small Table First
14](https://image.slidesharecdn.com/histogramsoow2019-190921043520/75/A-Billion-Goods-in-a-Few-Categories-When-Optimizer-Histograms-Help-and-When-They-Don-t-29-2048.jpg)


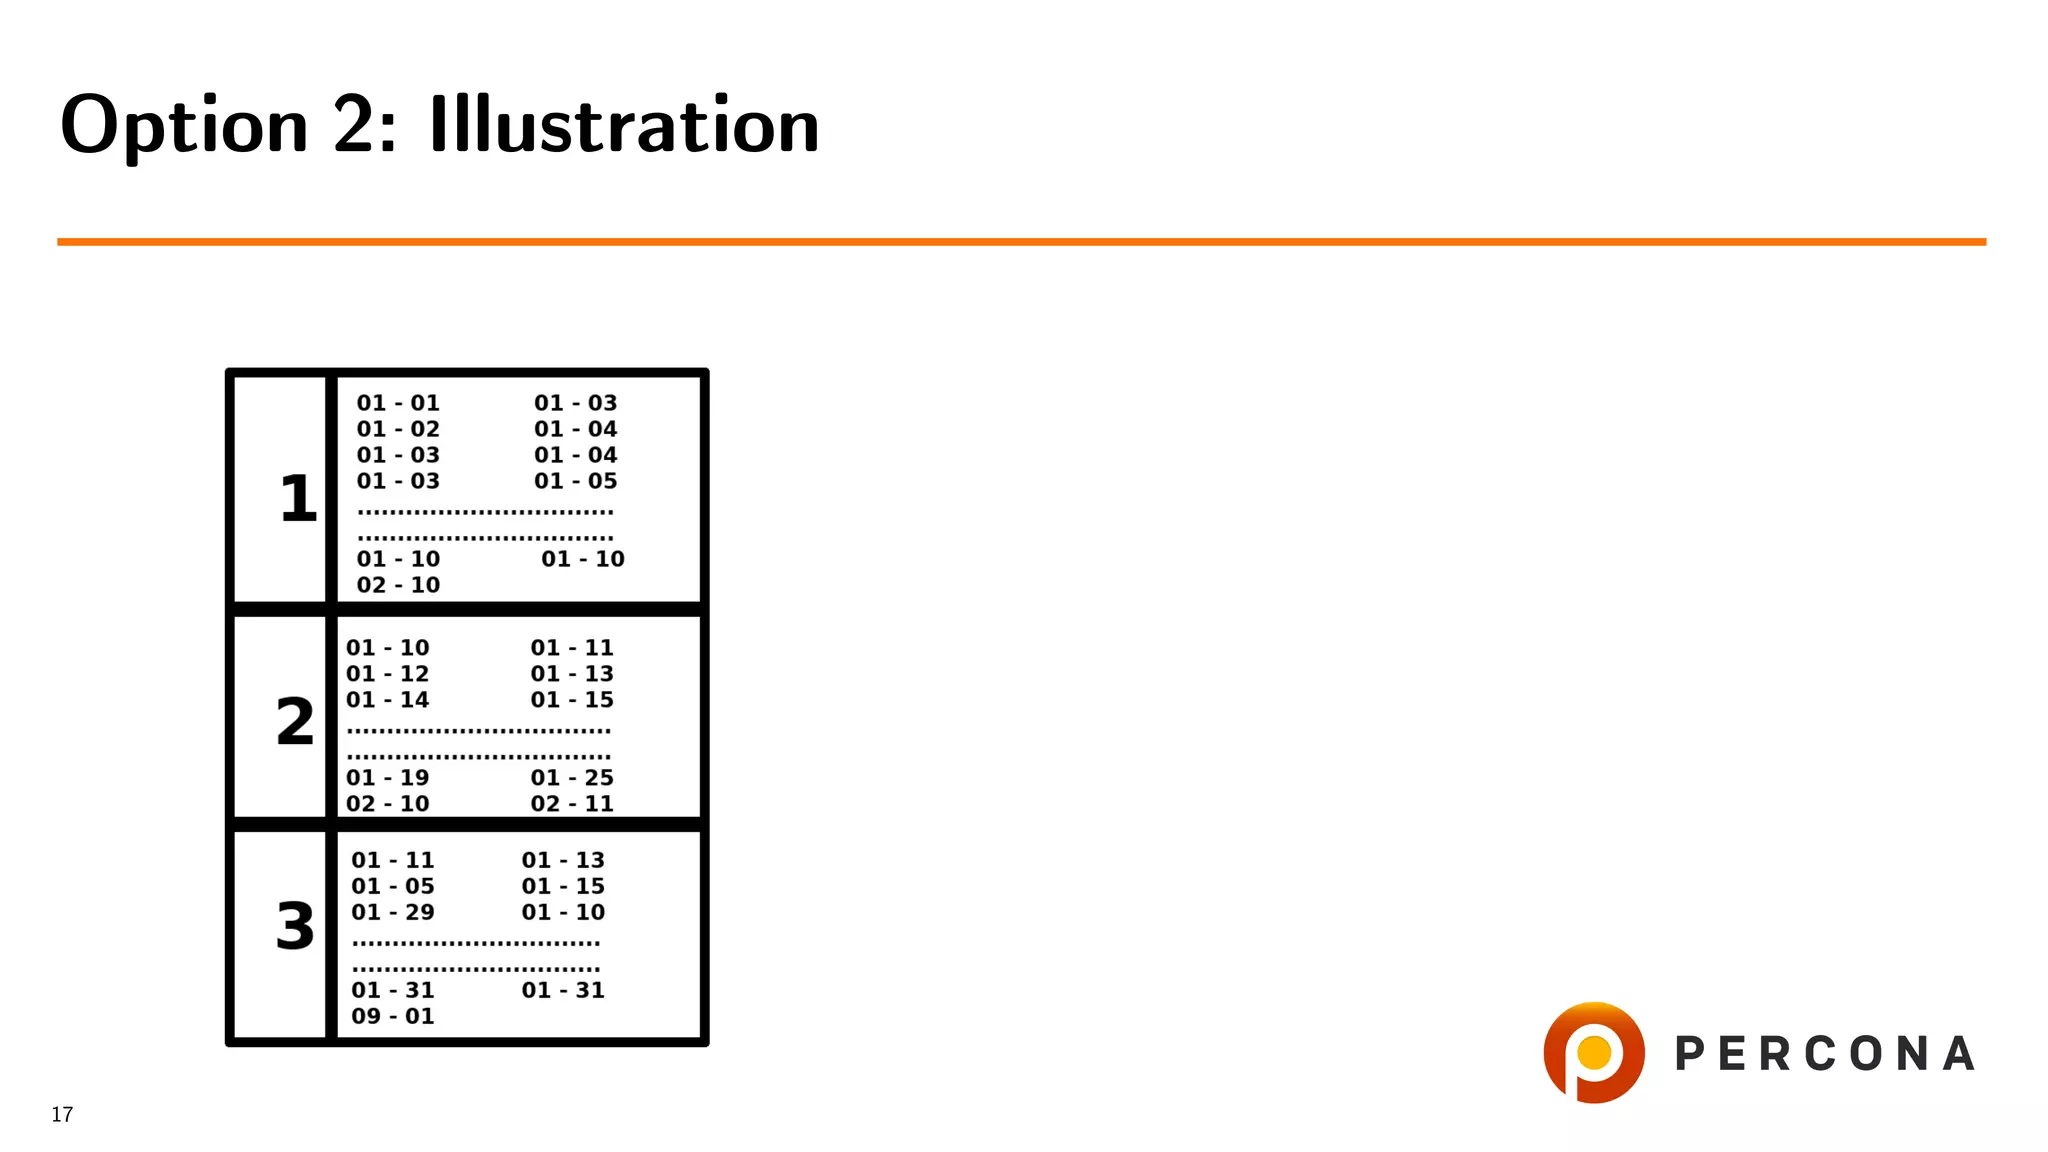
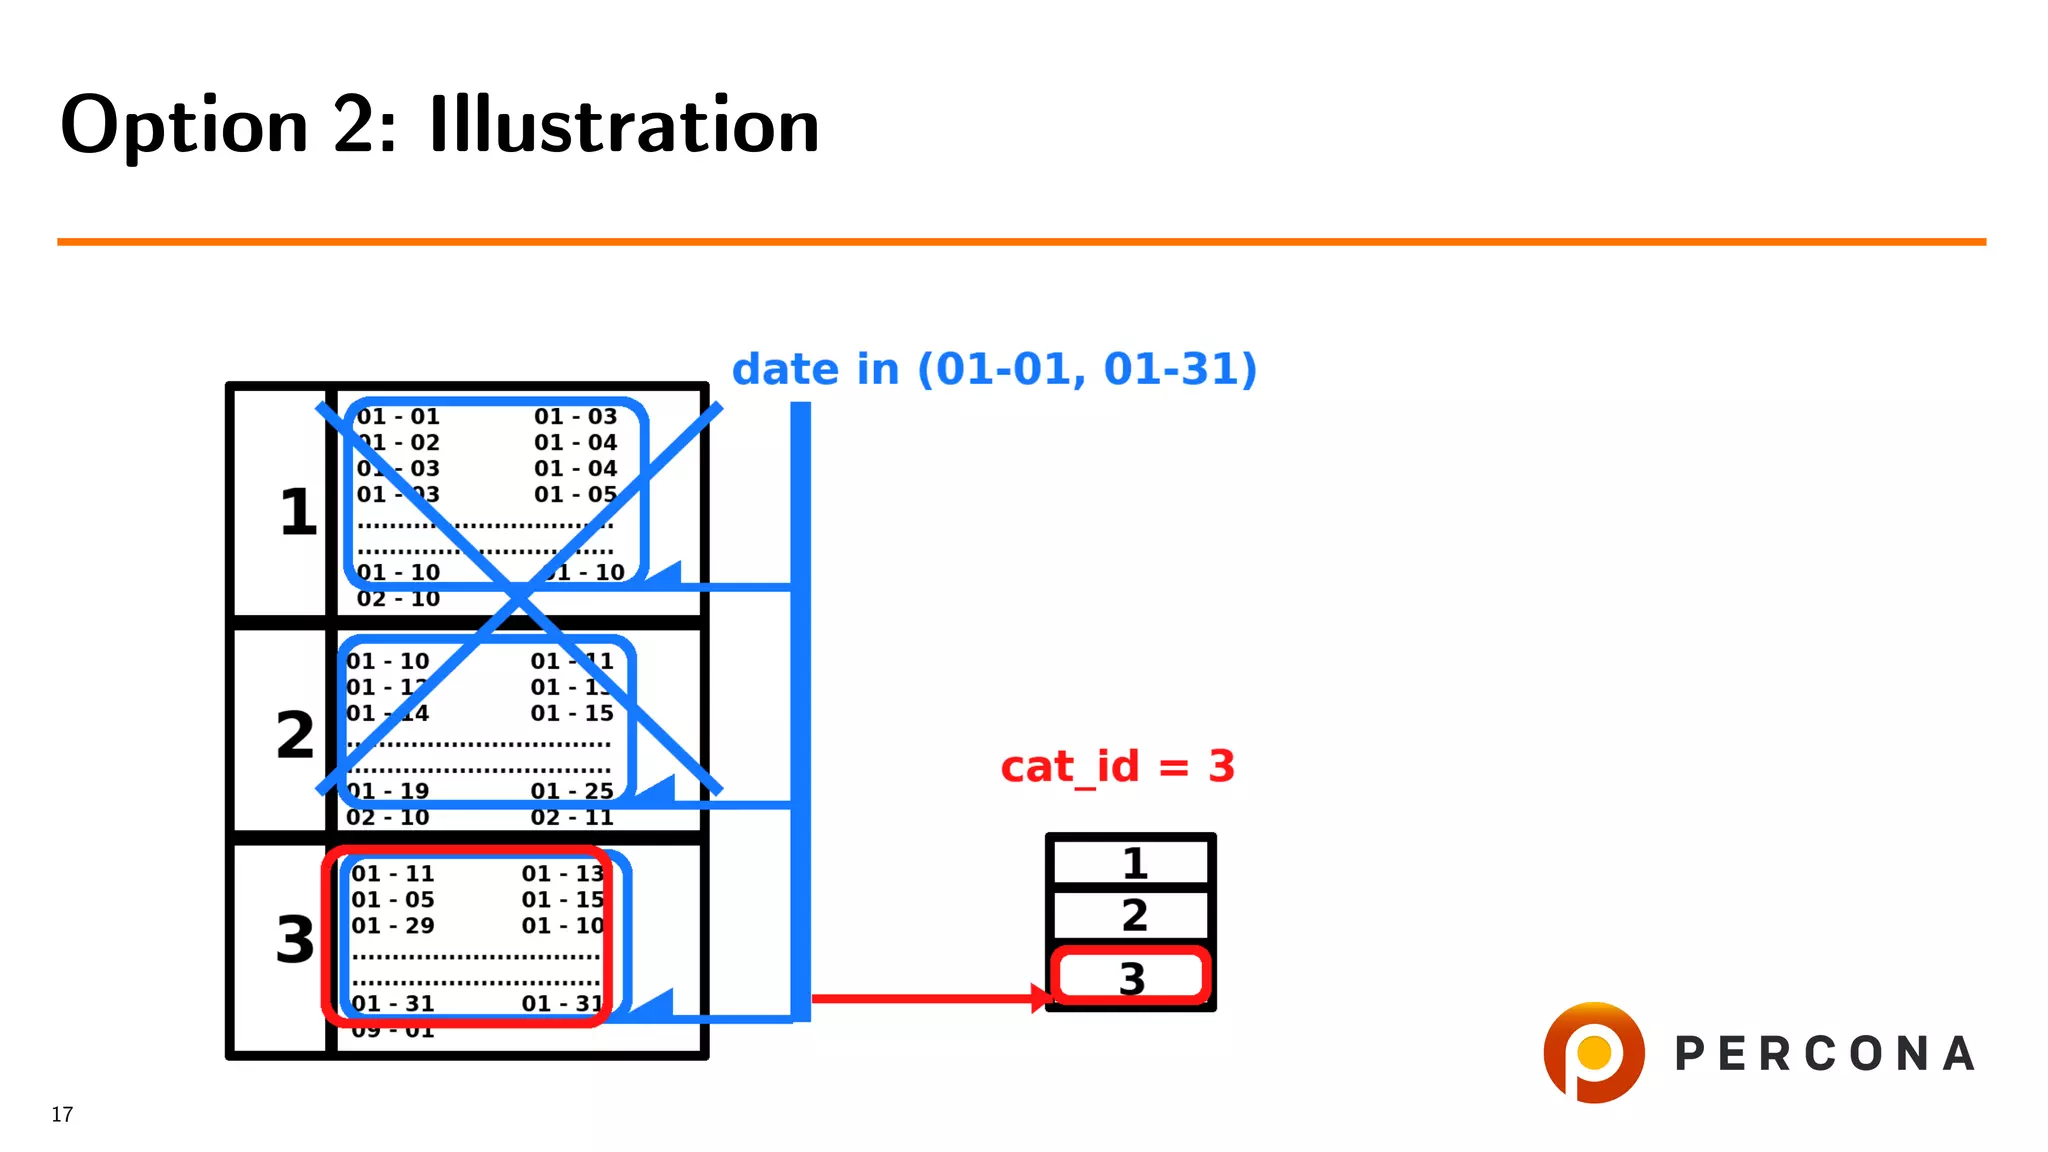
![• Filter rows by date added[ and price[...]]
Option 2: Select From the Large Table First
16](https://image.slidesharecdn.com/histogramsoow2019-190921043520/75/A-Billion-Goods-in-a-Few-Categories-When-Optimizer-Histograms-Help-and-When-They-Don-t-38-2048.jpg)
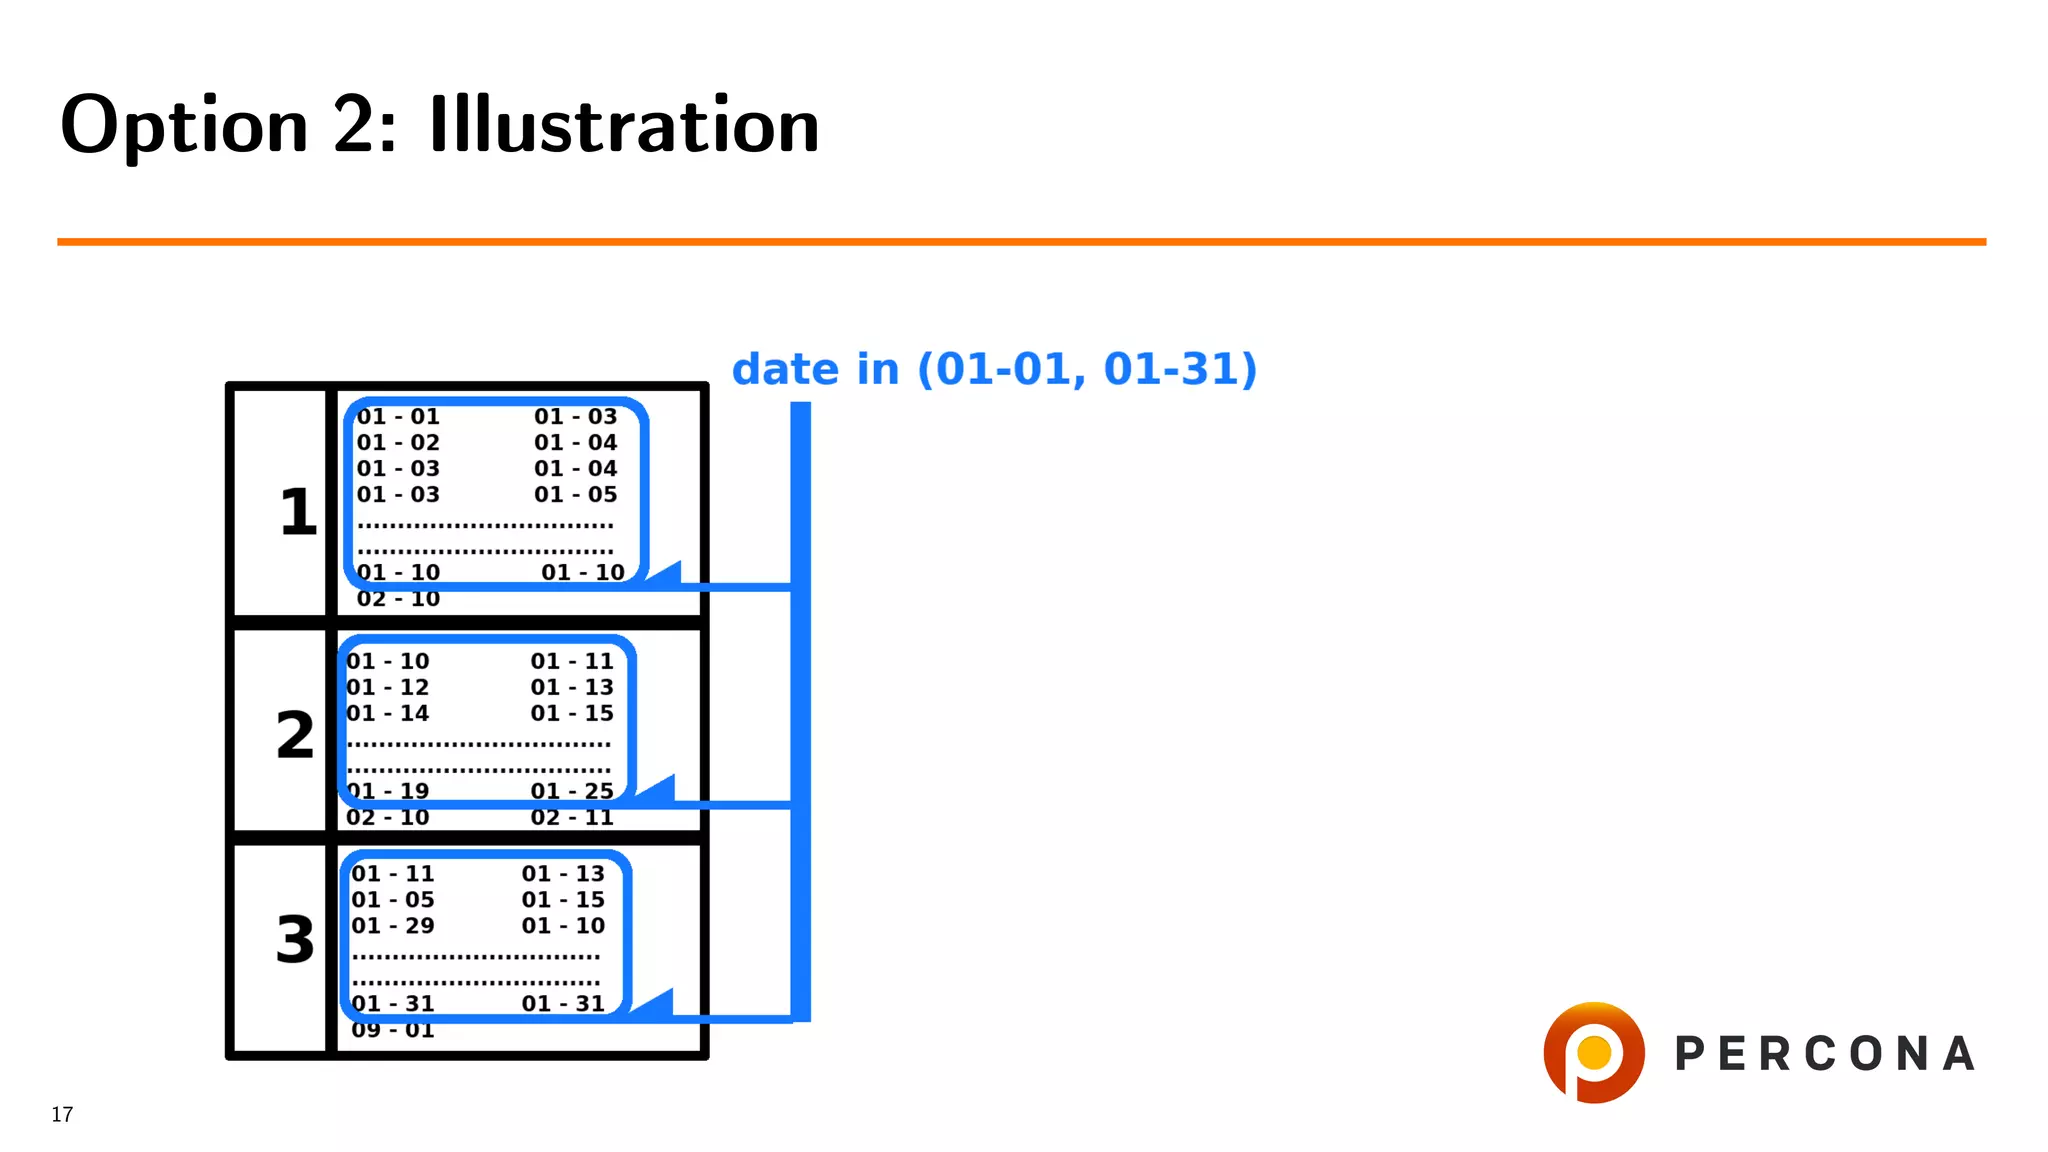
![• Filter rows by date added[ and price[...]]
• Get cat id values
Option 2: Select From the Large Table First
16](https://image.slidesharecdn.com/histogramsoow2019-190921043520/75/A-Billion-Goods-in-a-Few-Categories-When-Optimizer-Histograms-Help-and-When-They-Don-t-39-2048.jpg)
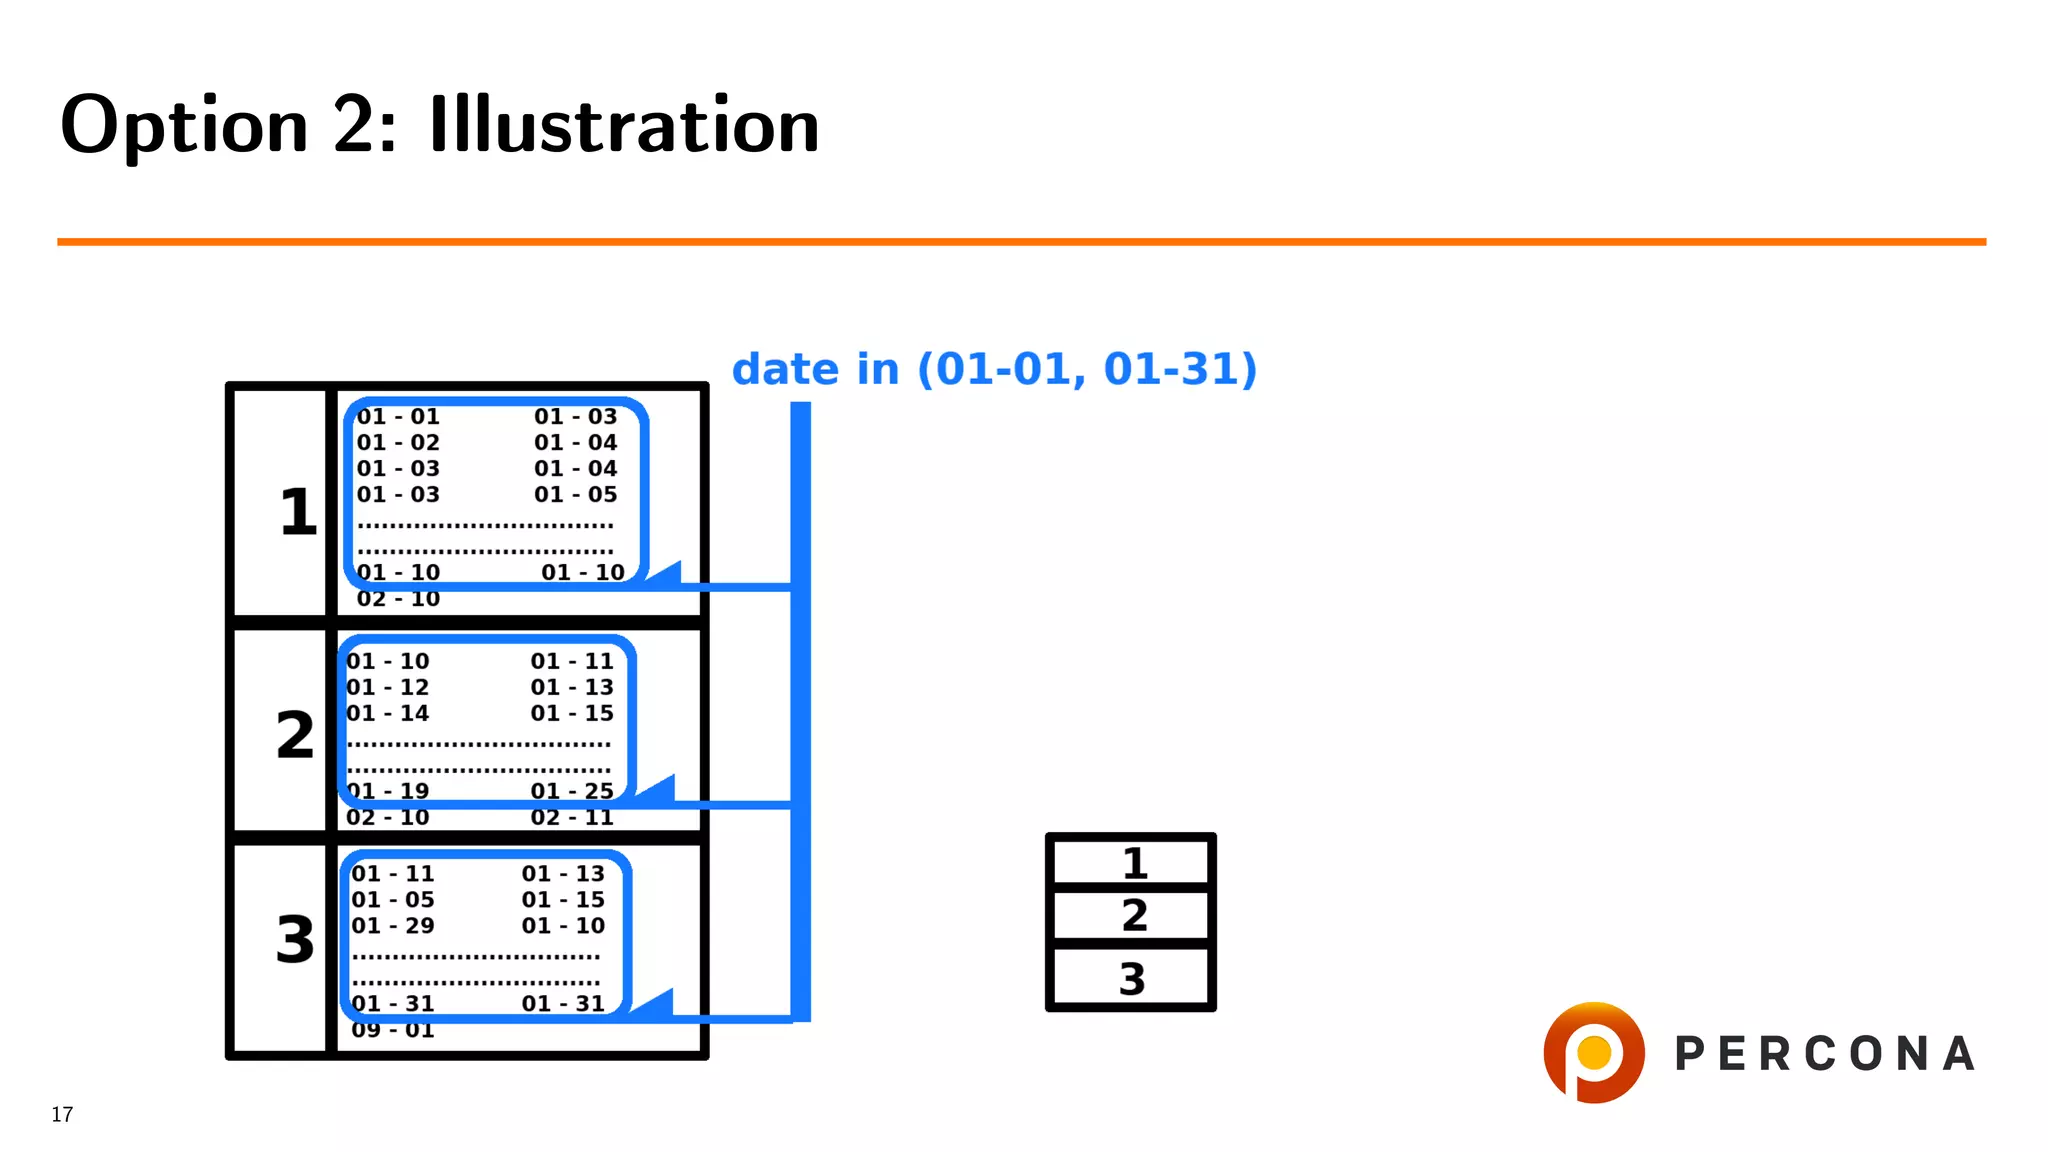
![• Filter rows by date added[ and price[...]]
• Get cat id values
• Retrieve rows from the small table
Option 2: Select From the Large Table First
16](https://image.slidesharecdn.com/histogramsoow2019-190921043520/75/A-Billion-Goods-in-a-Few-Categories-When-Optimizer-Histograms-Help-and-When-They-Don-t-40-2048.jpg)
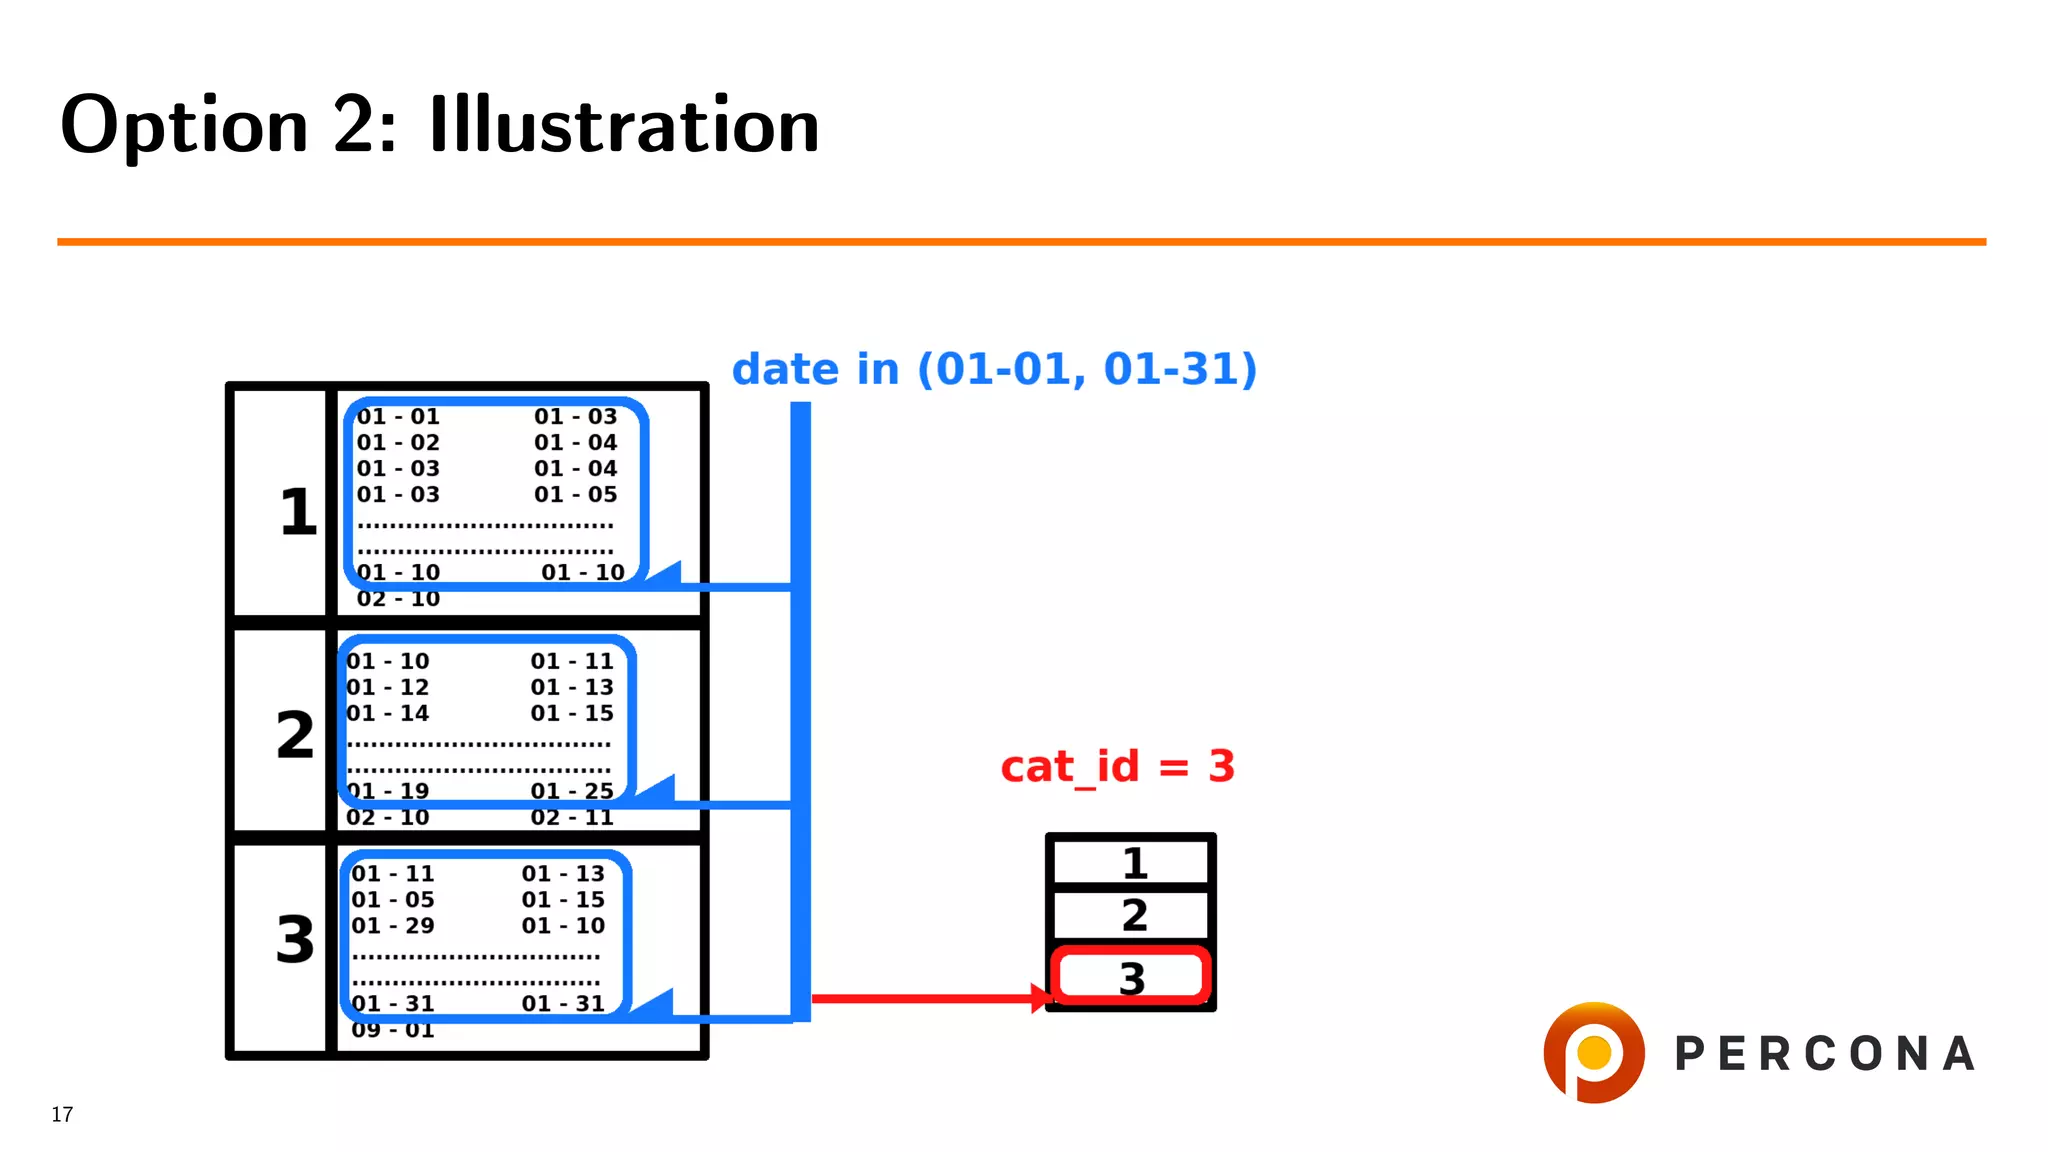
![• Filter rows by date added[ and price[...]]
• Get cat id values
• Retrieve rows from the small table
• Slow if number of rows, filtered by
date added, is larger than number of goods in
the selected categories
Option 2: Select From the Large Table First
16](https://image.slidesharecdn.com/histogramsoow2019-190921043520/75/A-Billion-Goods-in-a-Few-Categories-When-Optimizer-Histograms-Help-and-When-They-Don-t-41-2048.jpg)
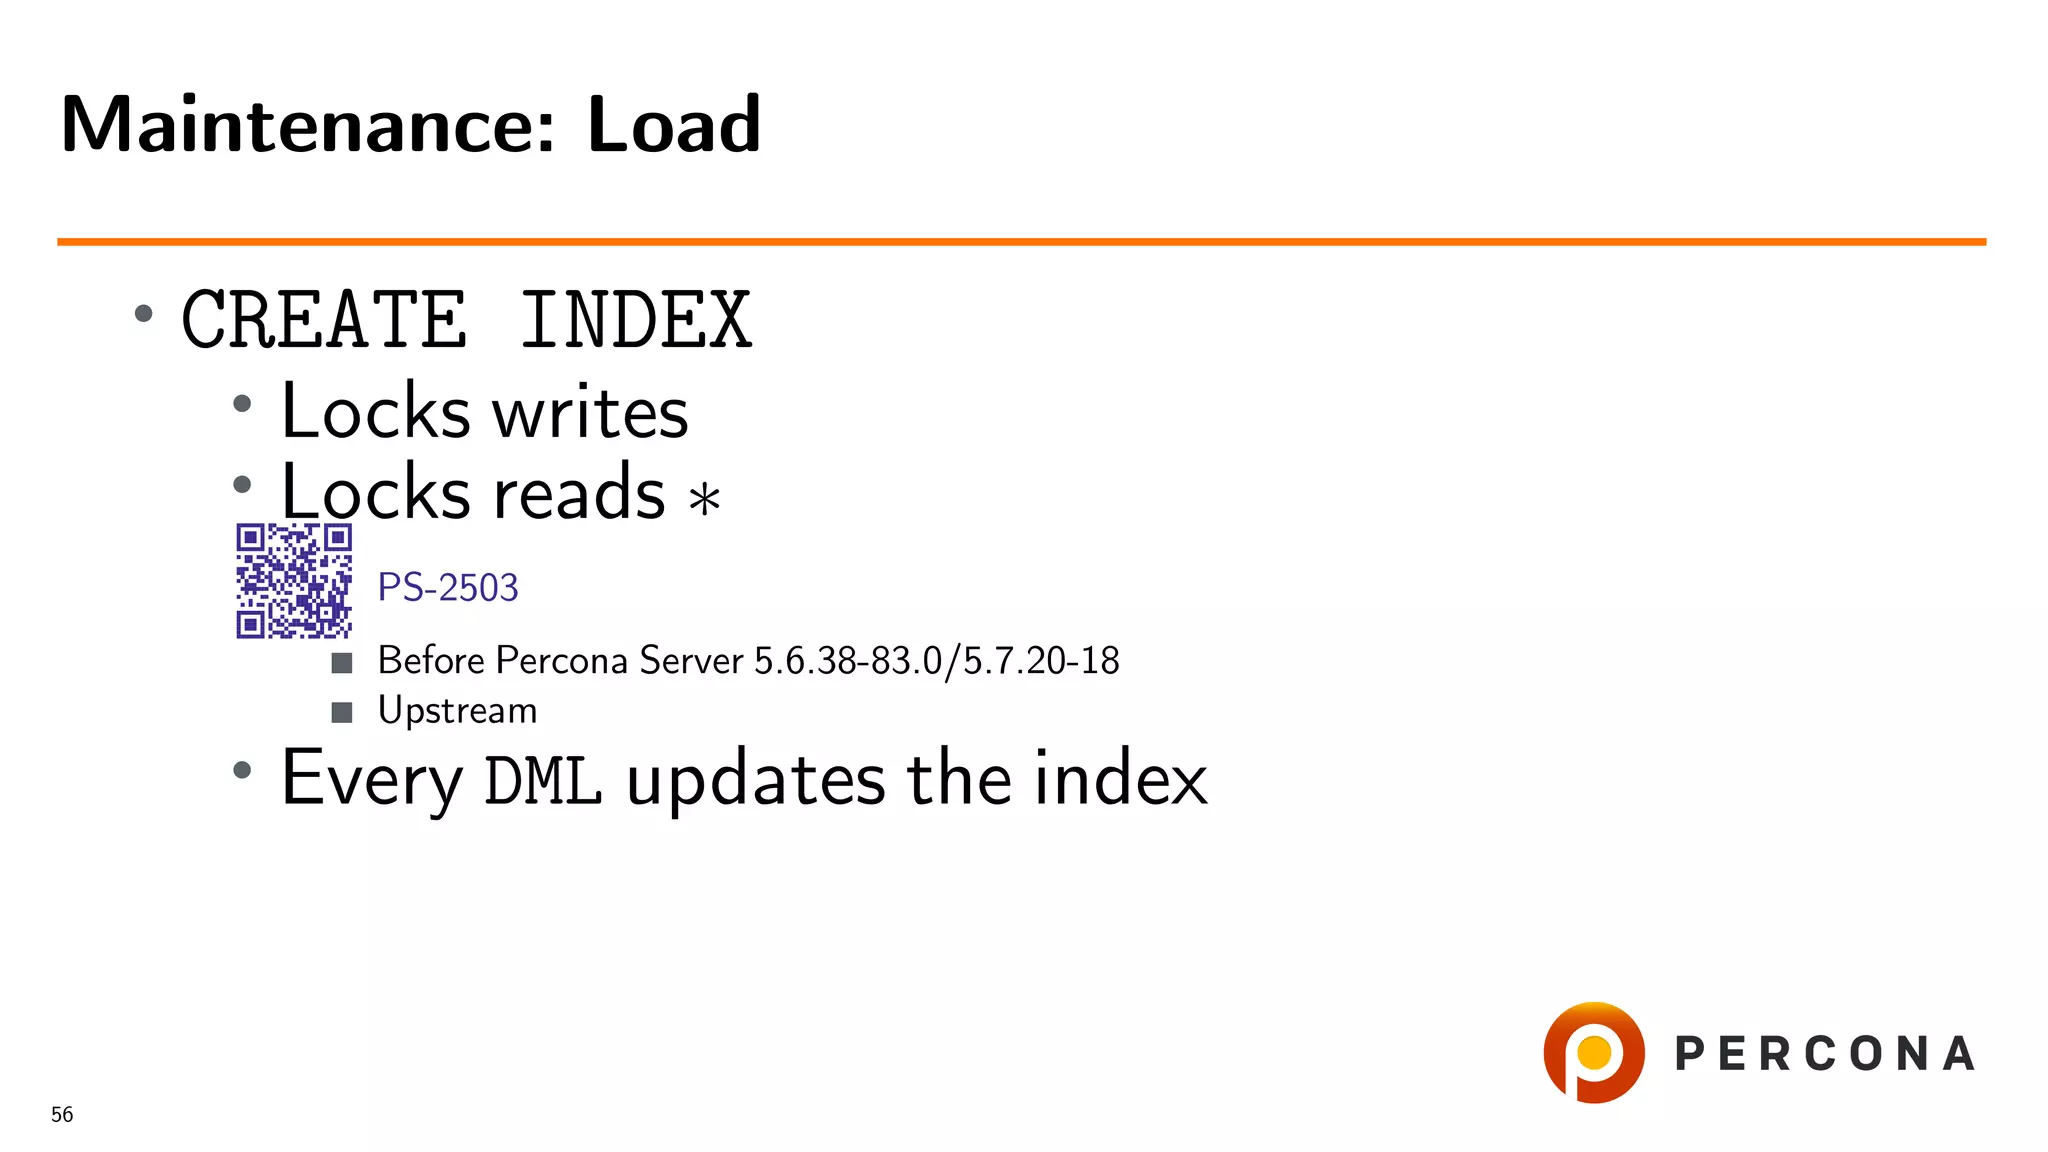
![•
CREATE INDEX index everything
(cat id, date added[, price[, ...]])
• It resolves the issue
What if We use Combined Indexes?
18](https://image.slidesharecdn.com/histogramsoow2019-190921043520/75/A-Billion-Goods-in-a-Few-Categories-When-Optimizer-Histograms-Help-and-When-They-Don-t-47-2048.jpg)
![•
CREATE INDEX index everything
(cat id, date added[, price[, ...]])
• It resolves the issue
• But not in all cases
What if We use Combined Indexes?
18](https://image.slidesharecdn.com/histogramsoow2019-190921043520/75/A-Billion-Goods-in-a-Few-Categories-When-Optimizer-Histograms-Help-and-When-They-Don-t-48-2048.jpg)

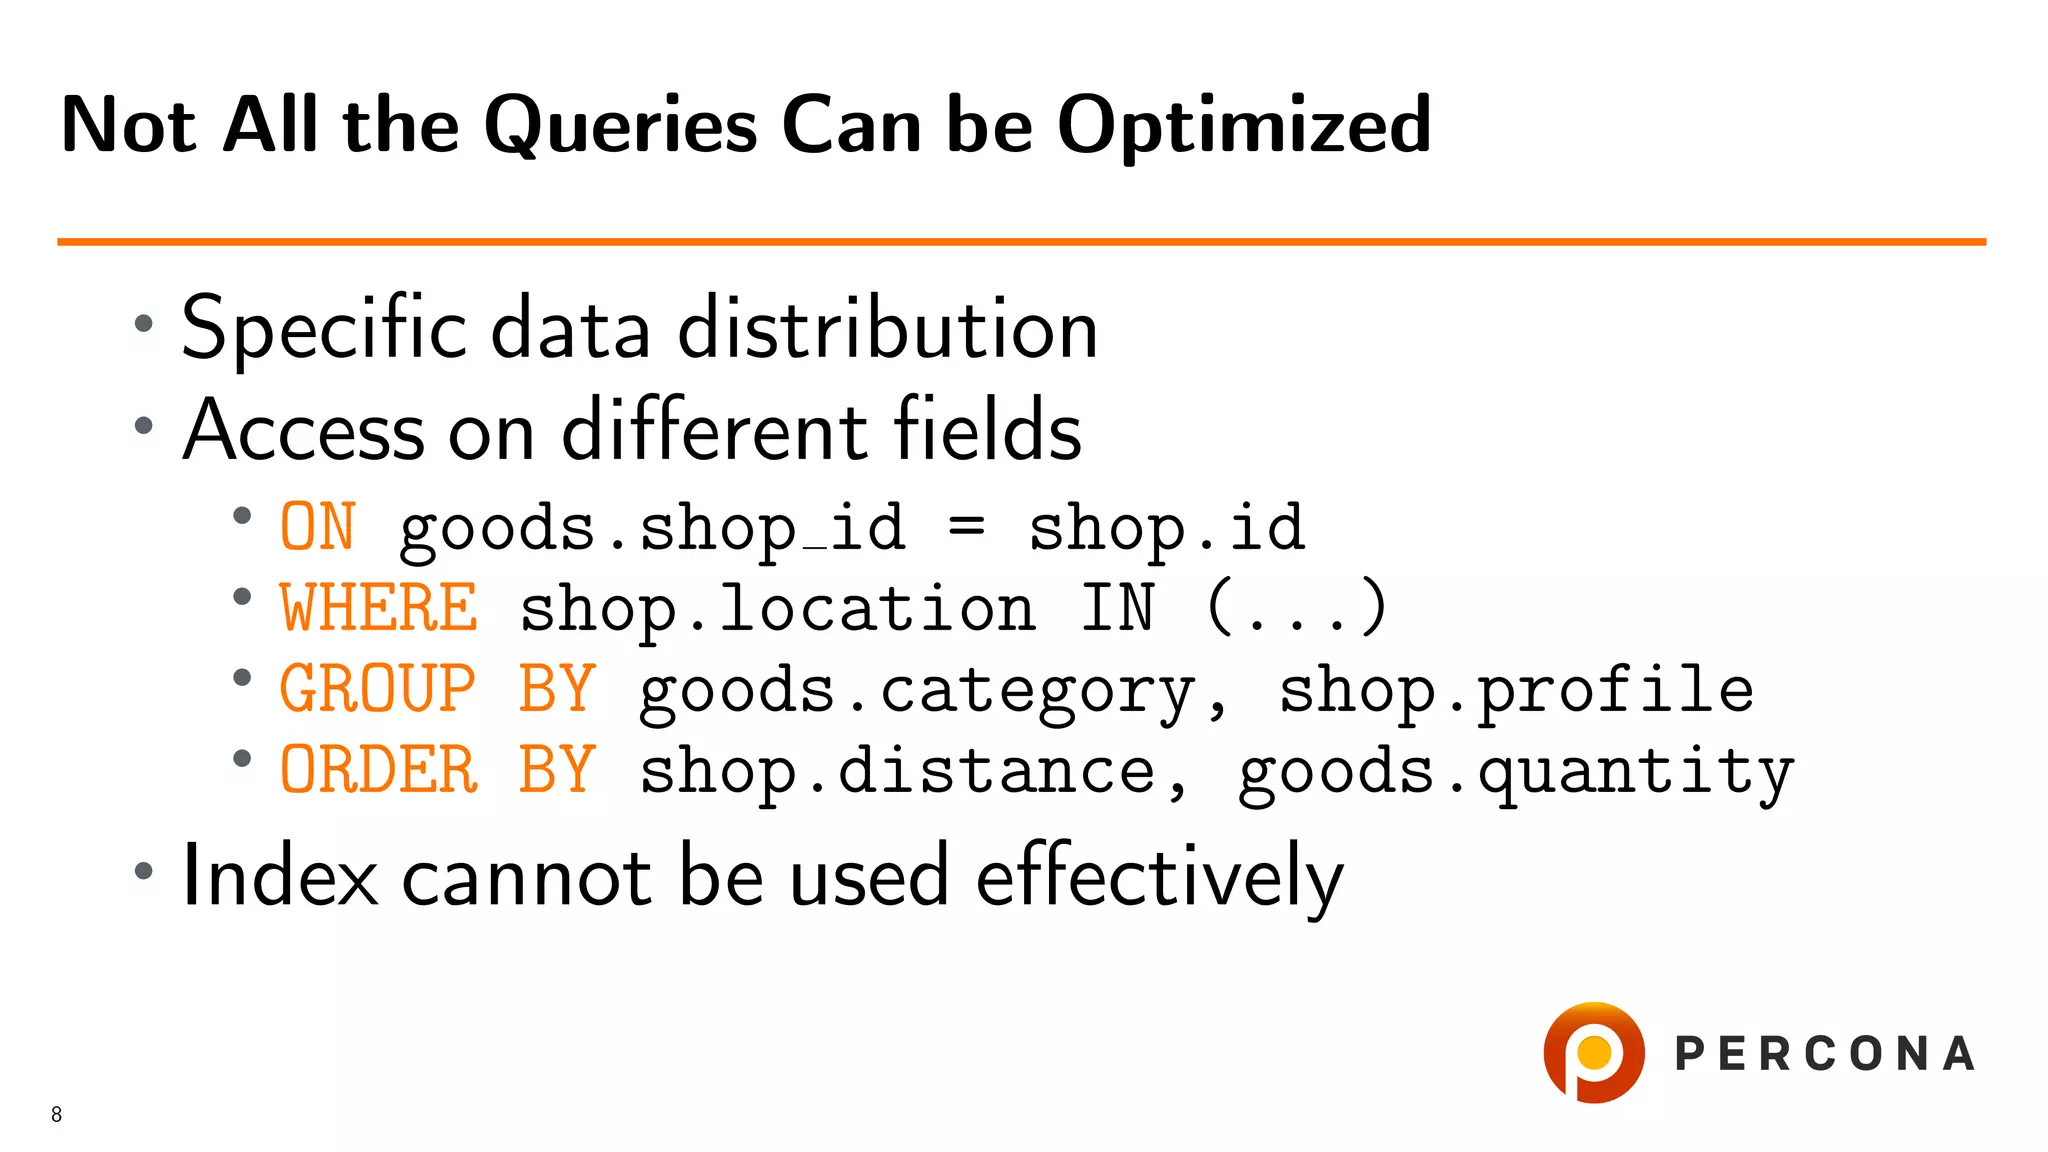
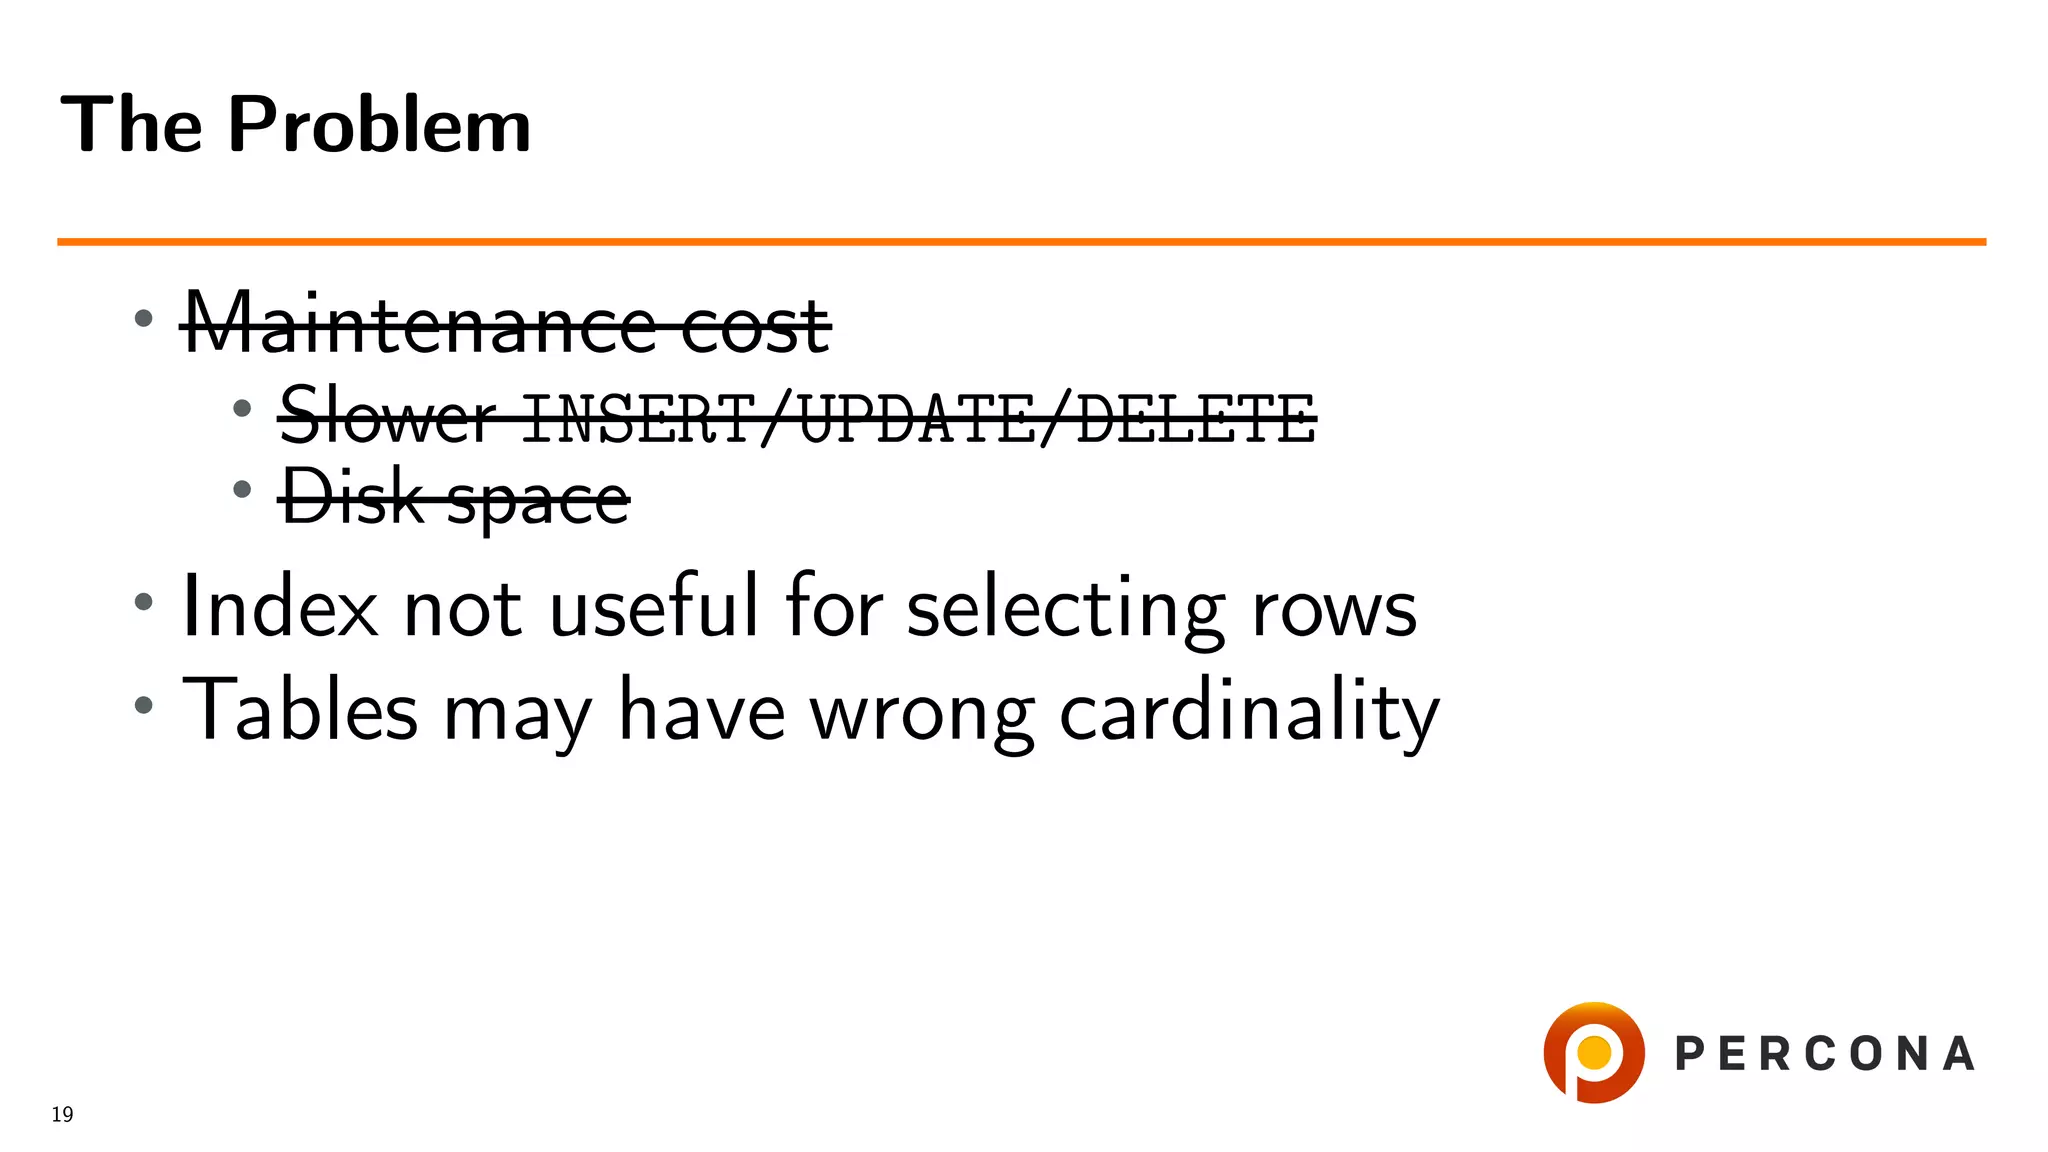
![• Maintenance cost
•
Slower INSERT/UPDATE/DELETE
• Disk space
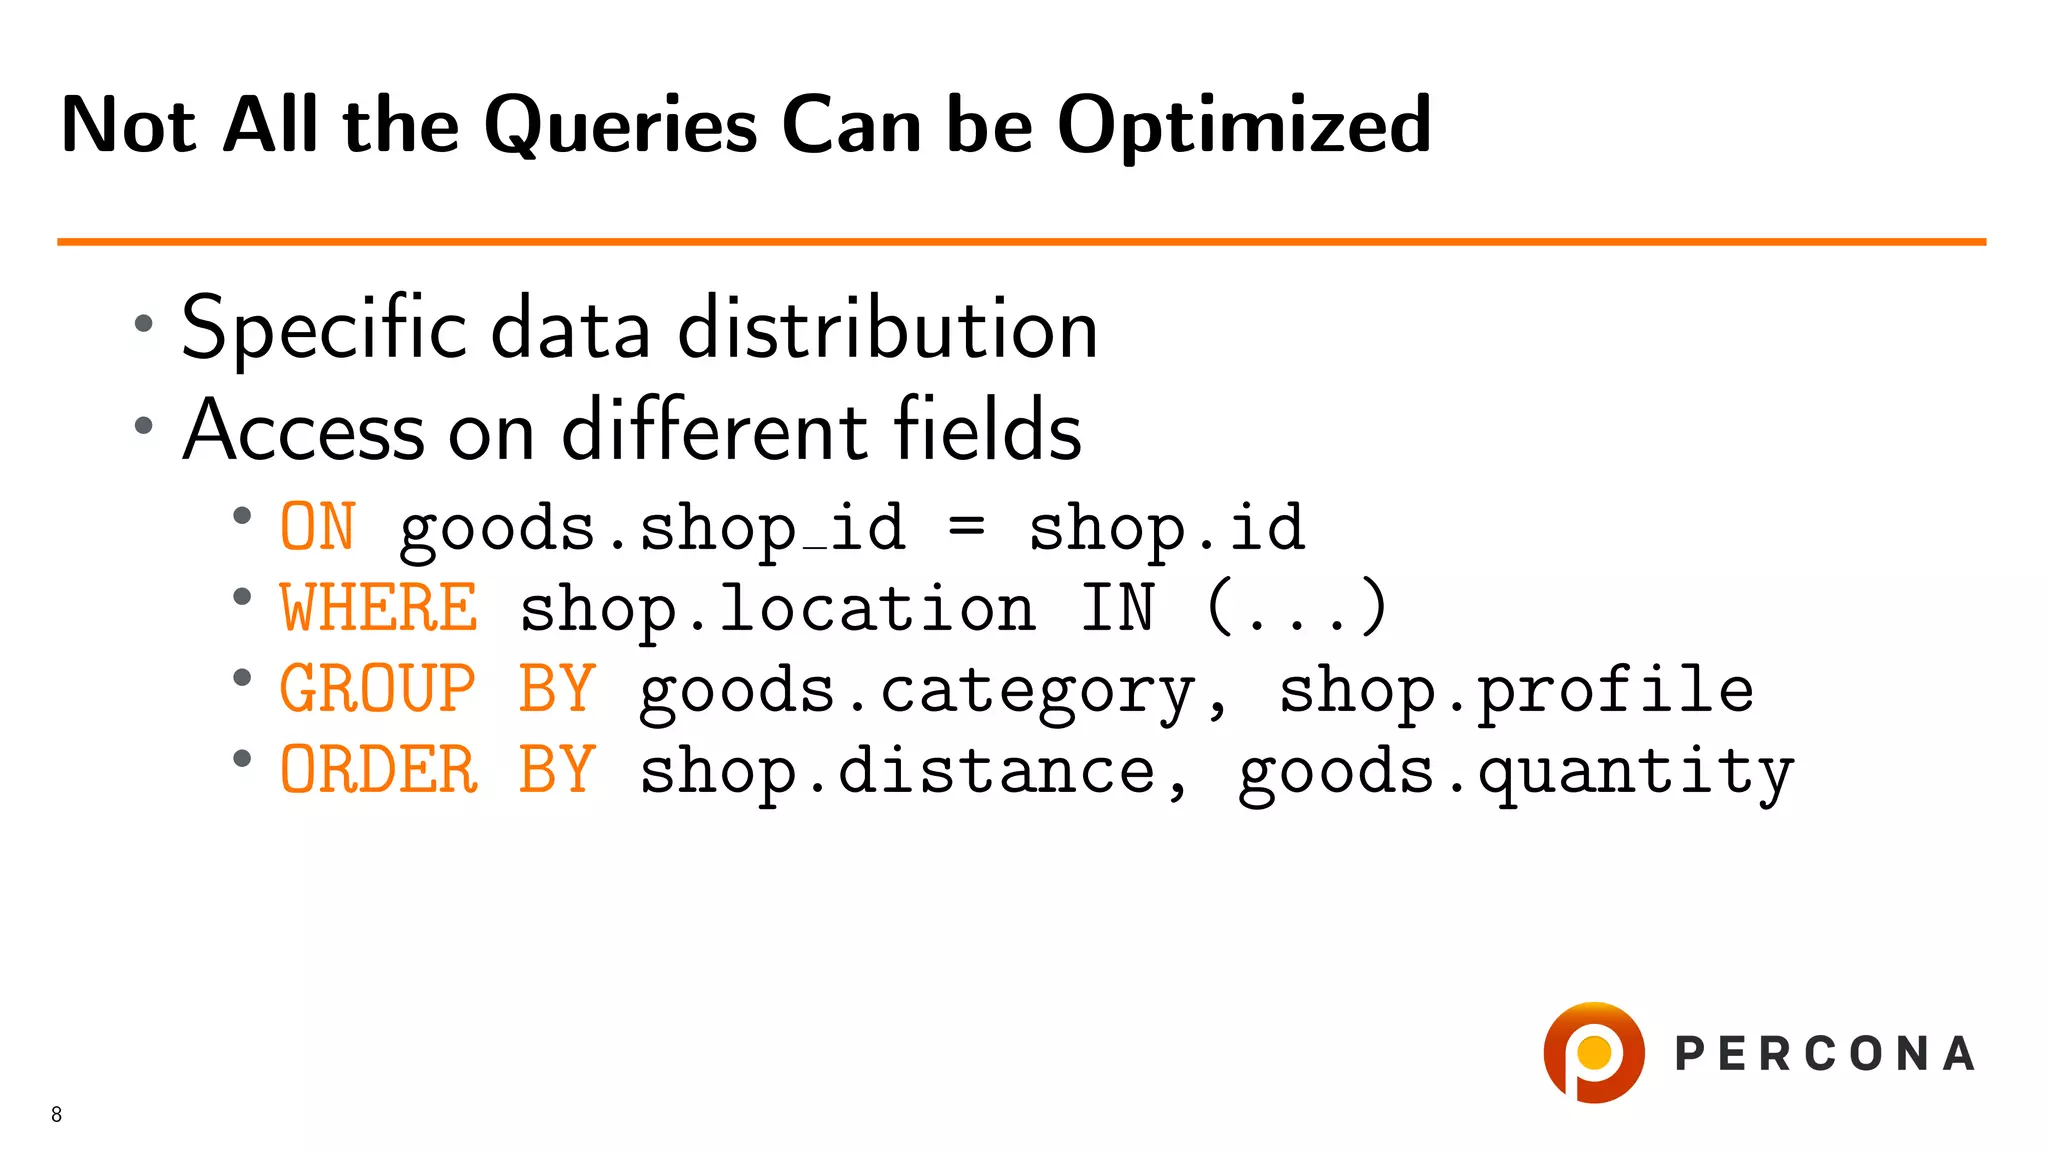
• Index not useful for selecting rows
JOIN categories ON (categories.id=goods.cat_id)
JOIN shops ON (shops.id=goods.shop_id)
[ JOIN ... ]
WHERE
date_added between ’2018-07-01’ and ’2018-08-01’
AND
cat_id in (16,11) AND price >= 1000 AND price <=10000 [ AND ... ]
GROUP BY product_type
ORDER BY date_updated DESC
LIMIT 50,100
The Problem
19](https://image.slidesharecdn.com/histogramsoow2019-190921043520/75/A-Billion-Goods-in-a-Few-Categories-When-Optimizer-Histograms-Help-and-When-They-Don-t-50-2048.jpg)


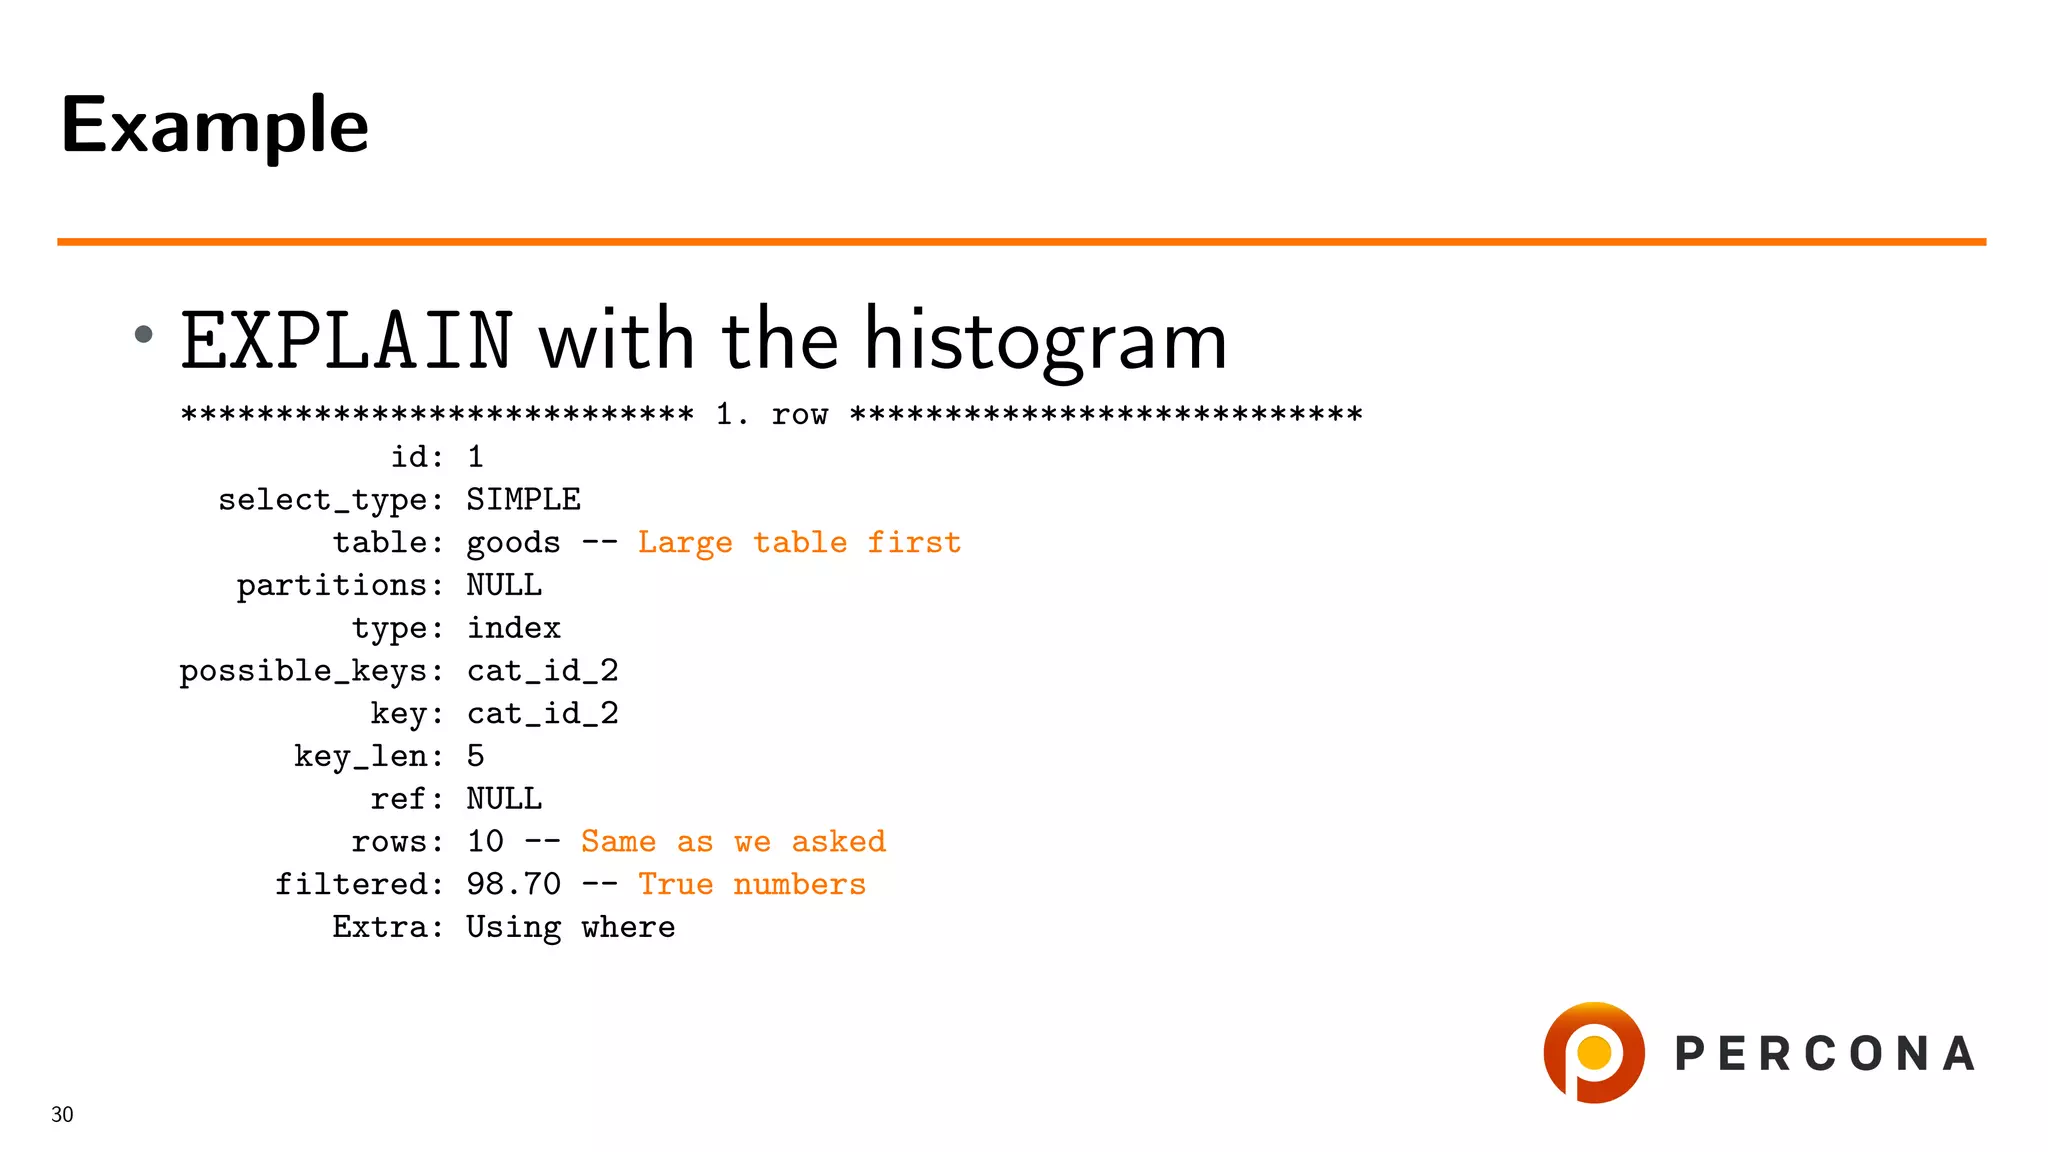
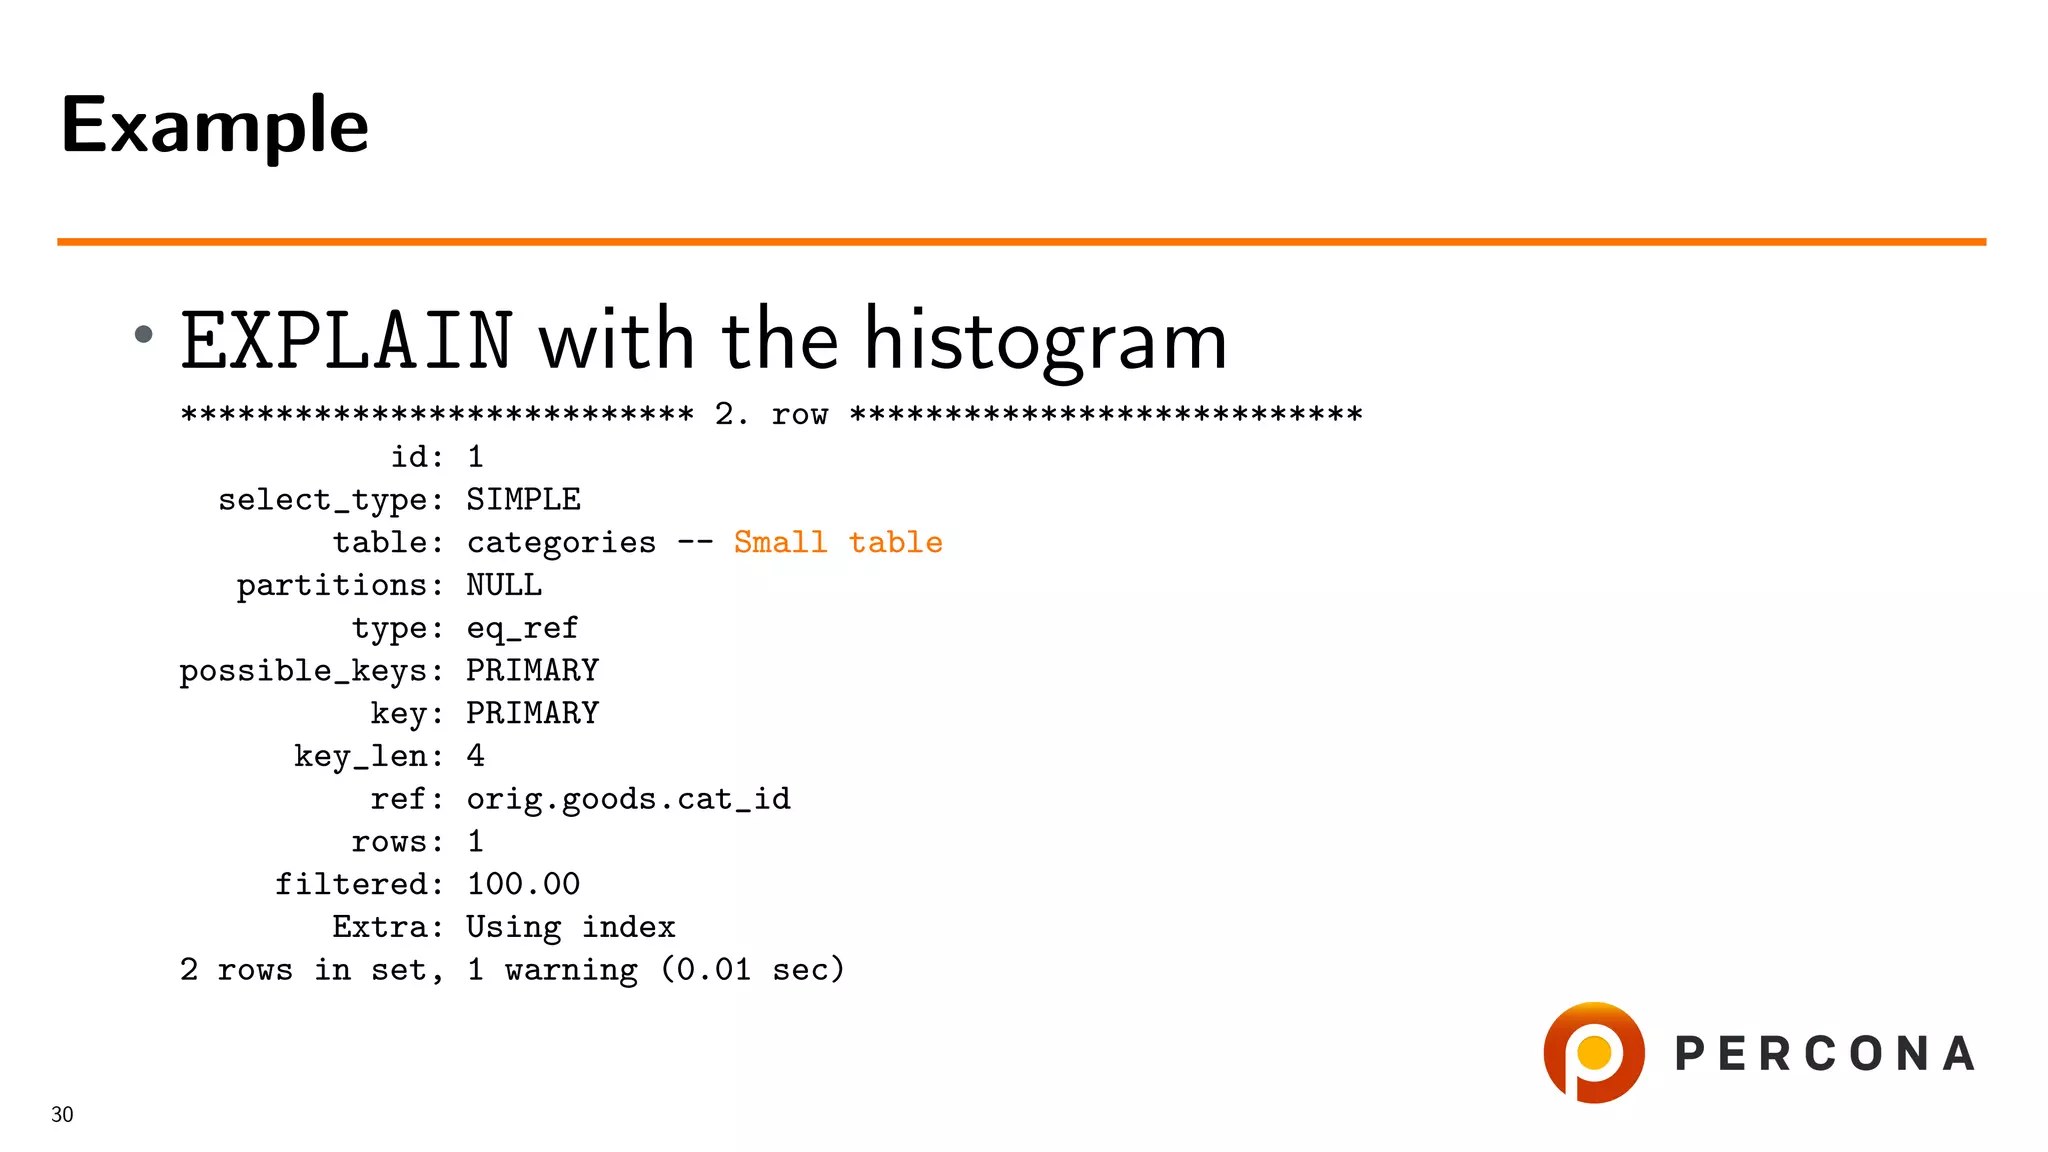


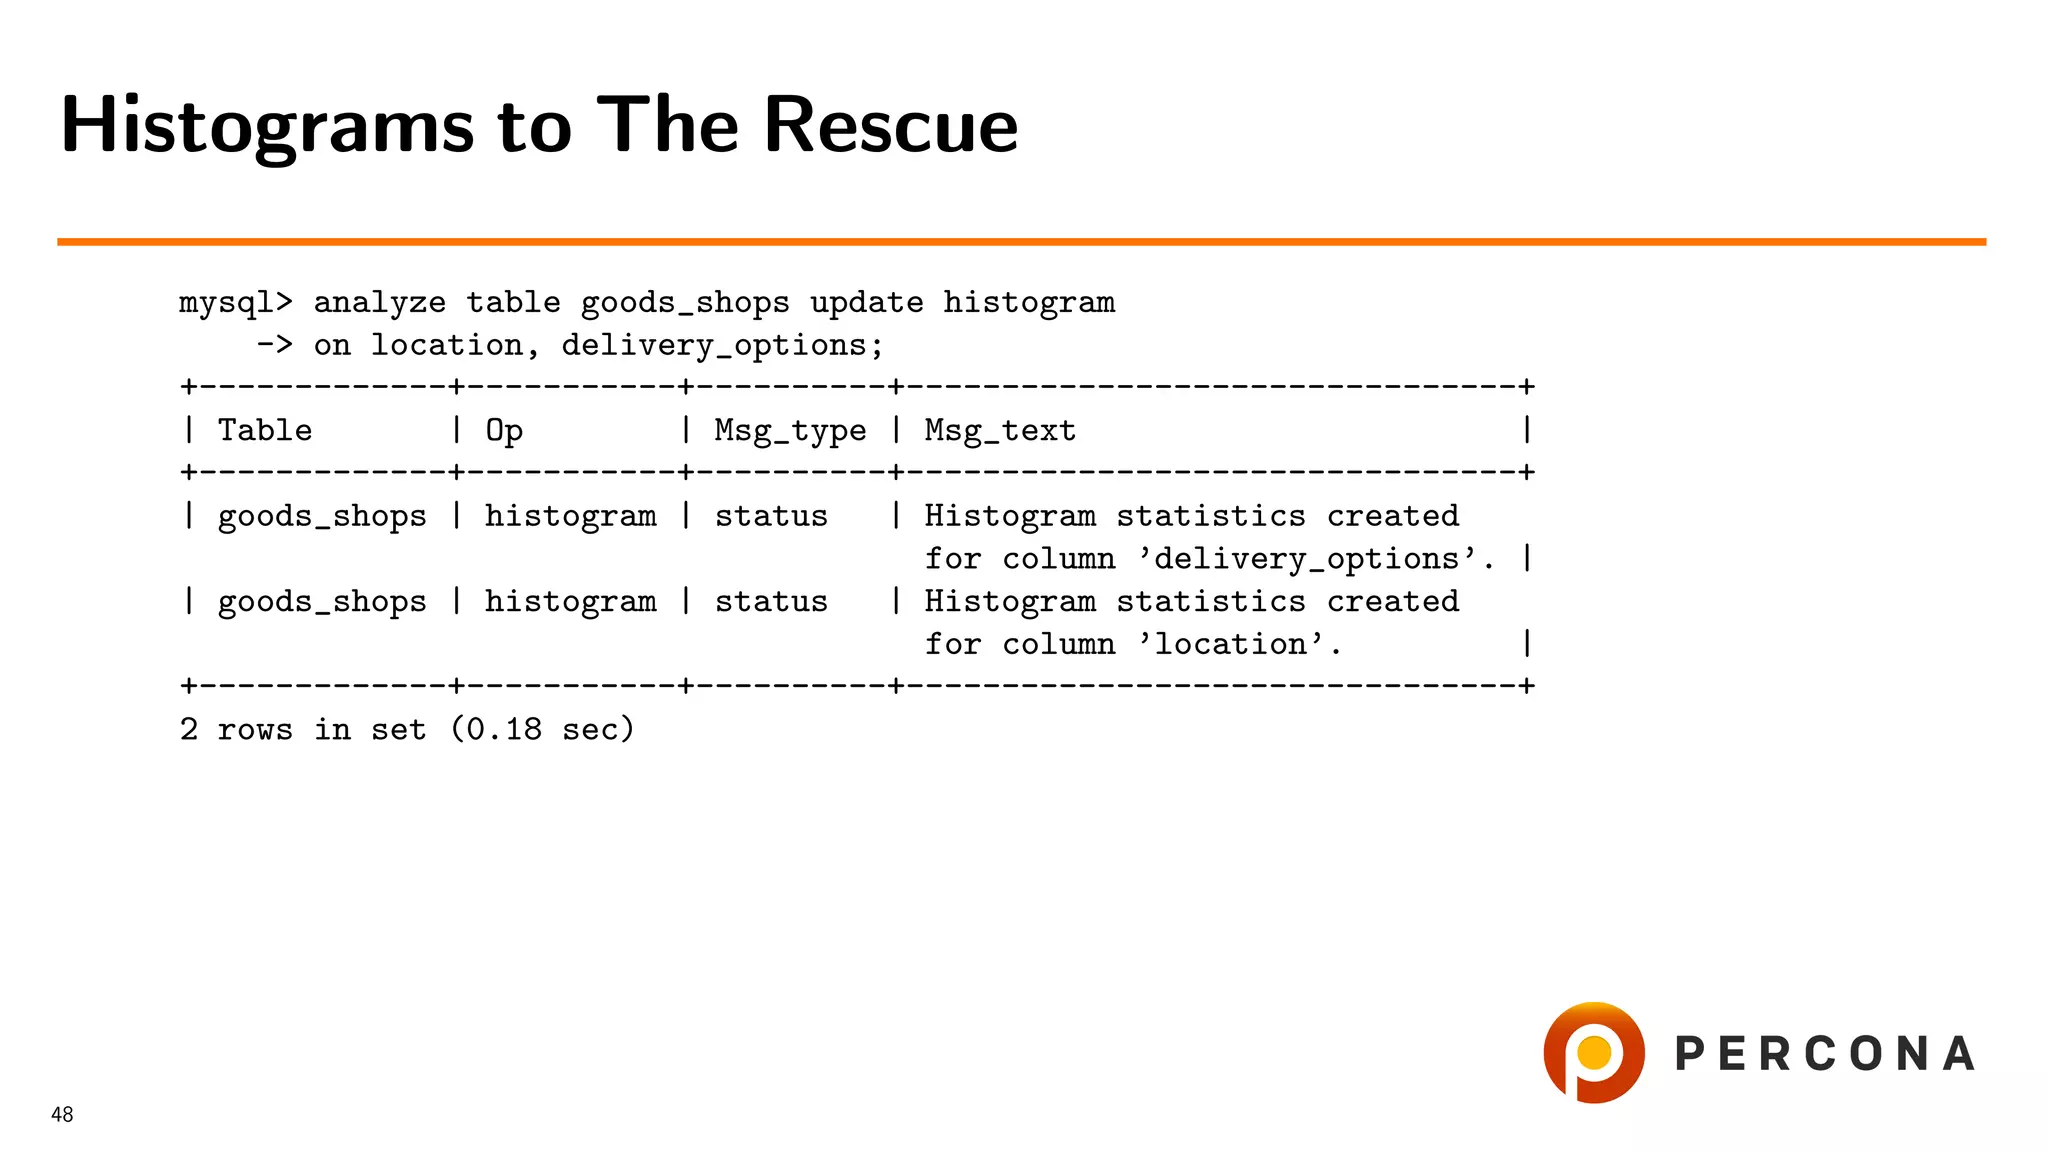
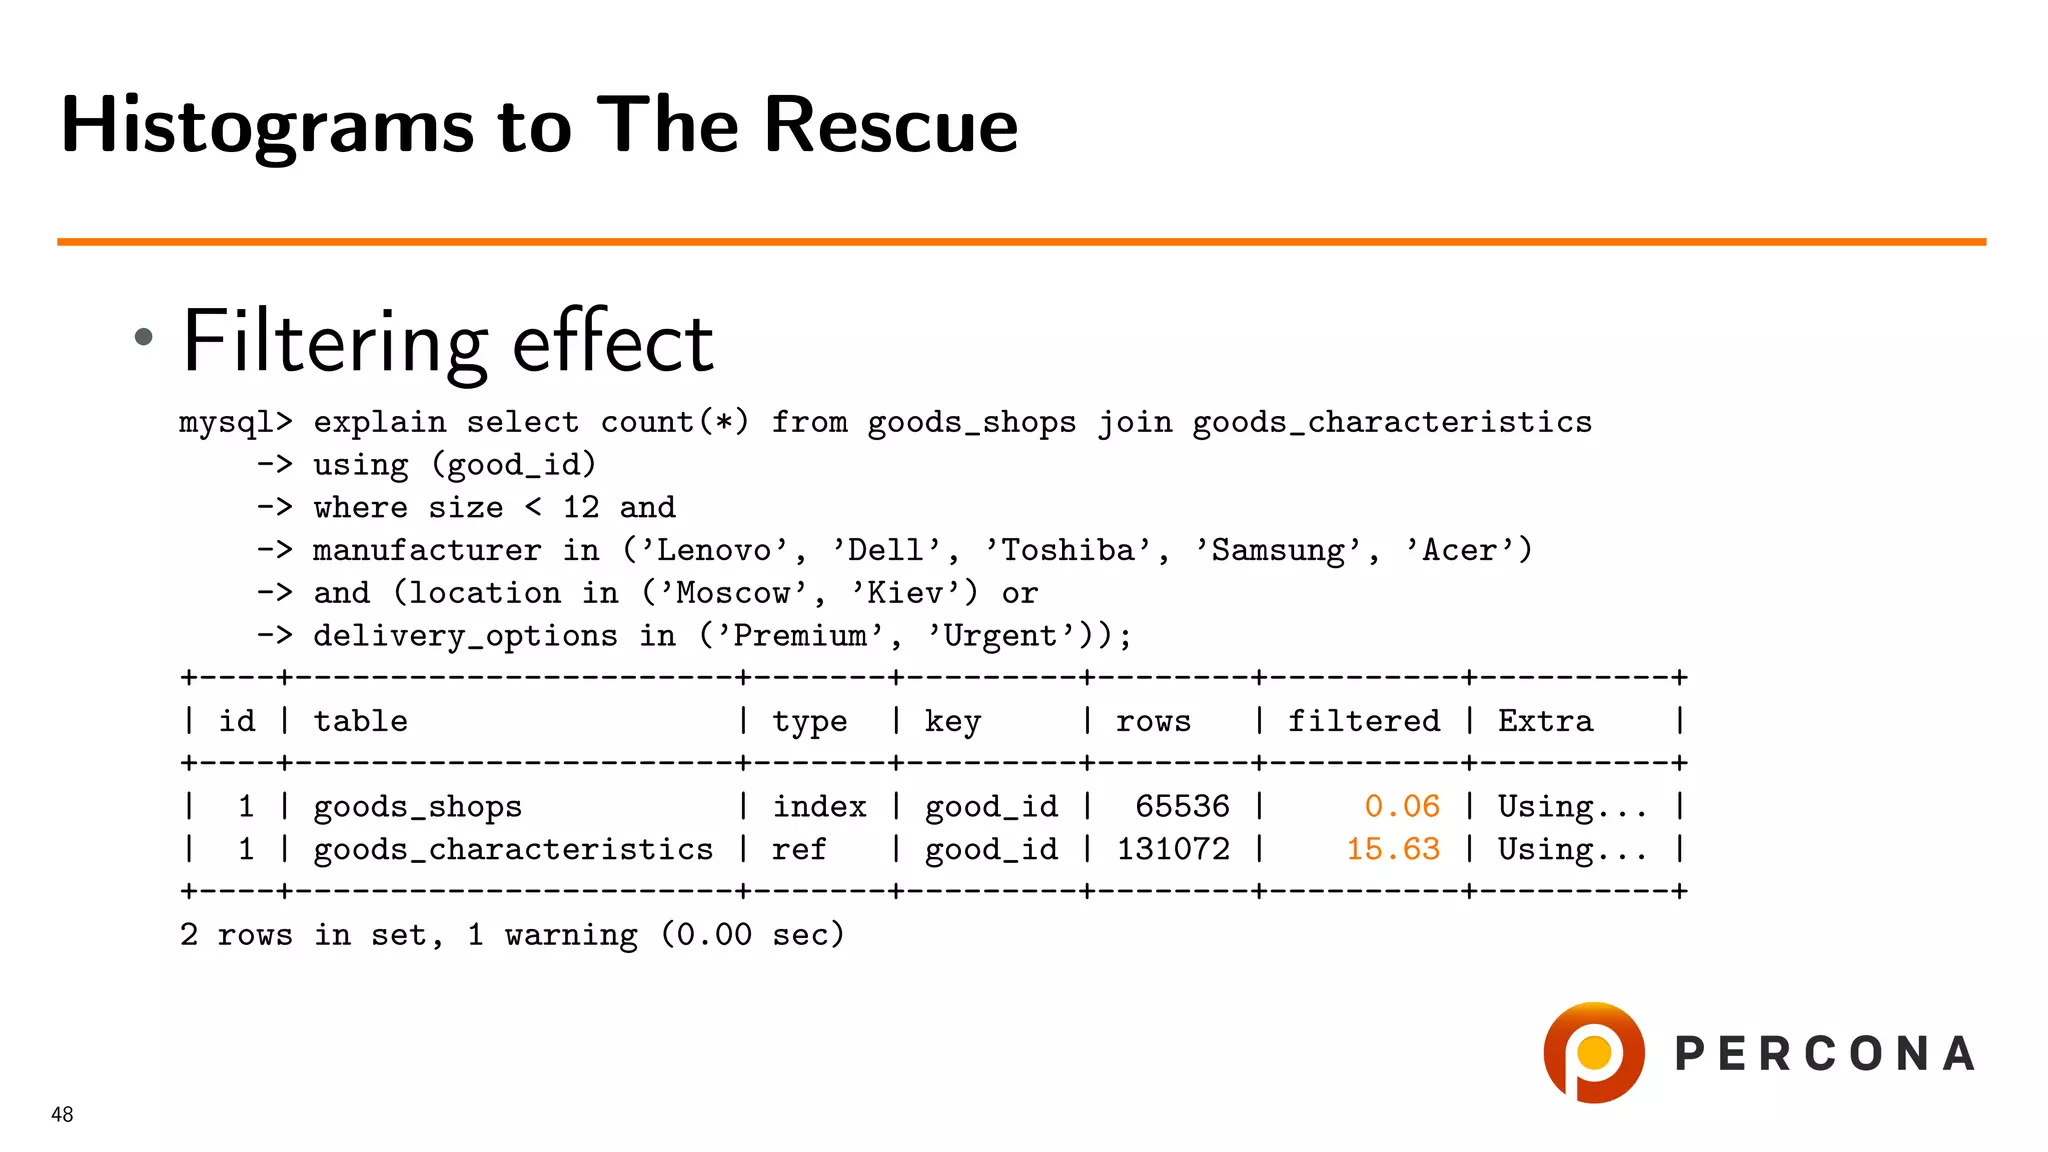


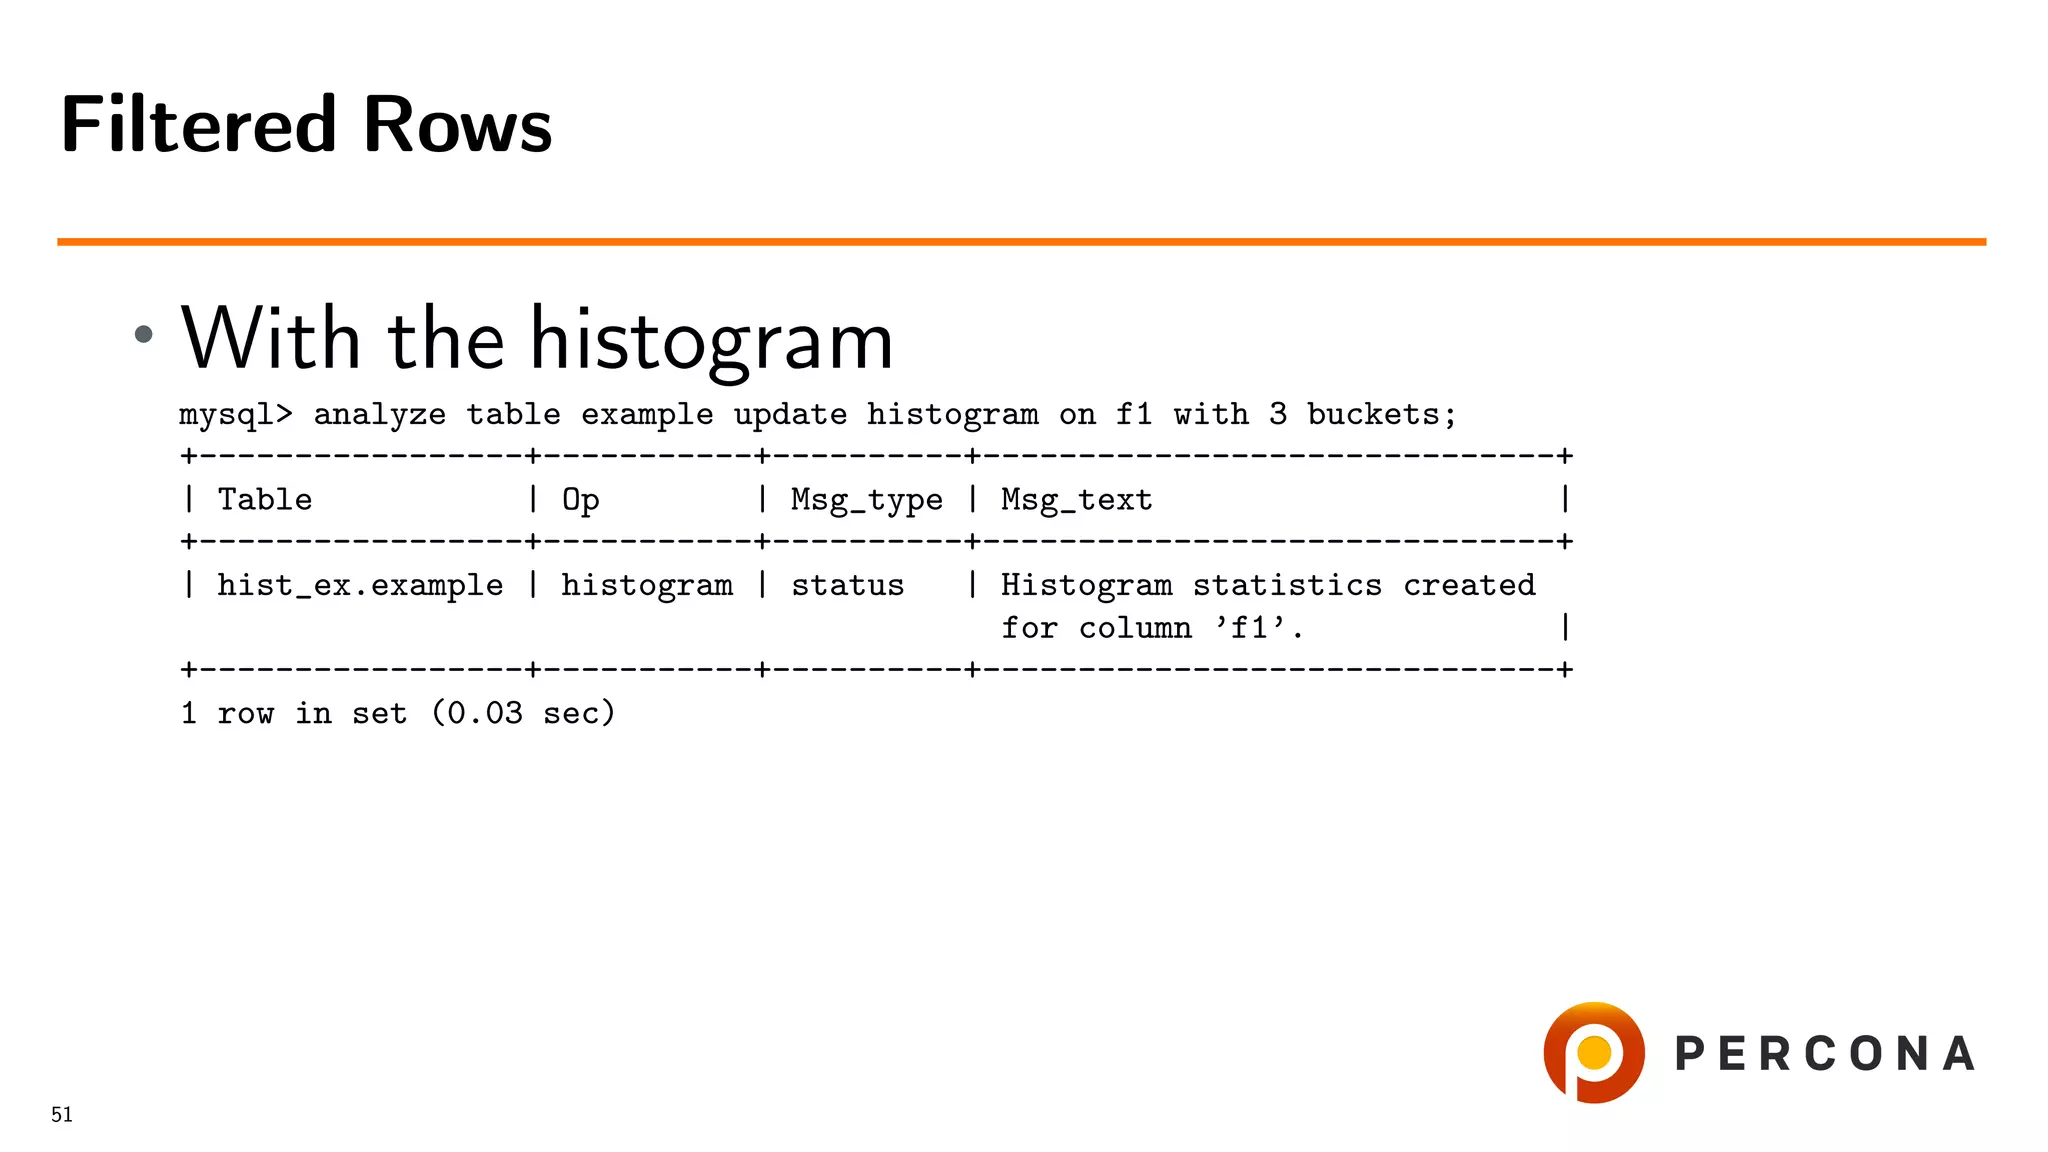
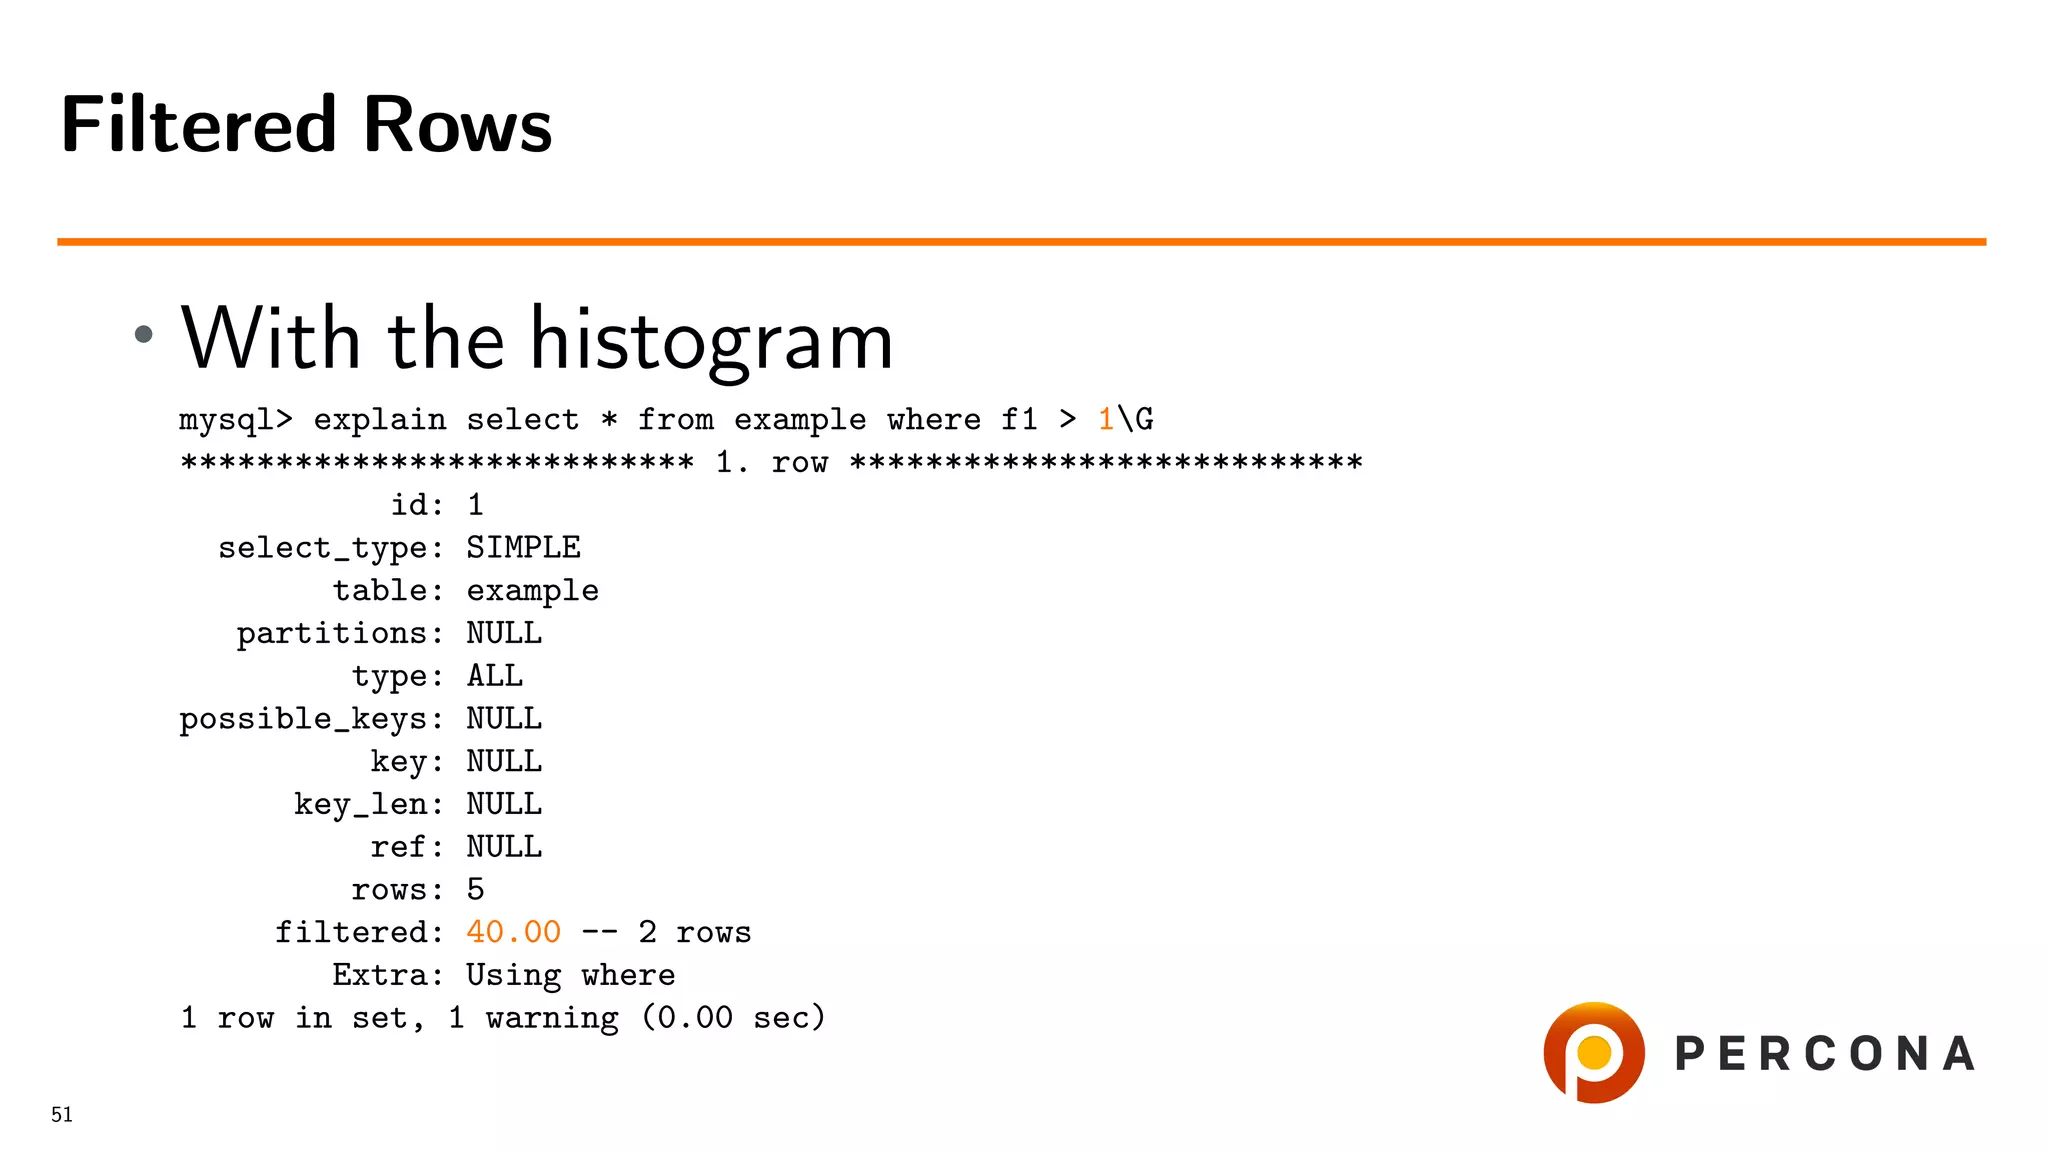
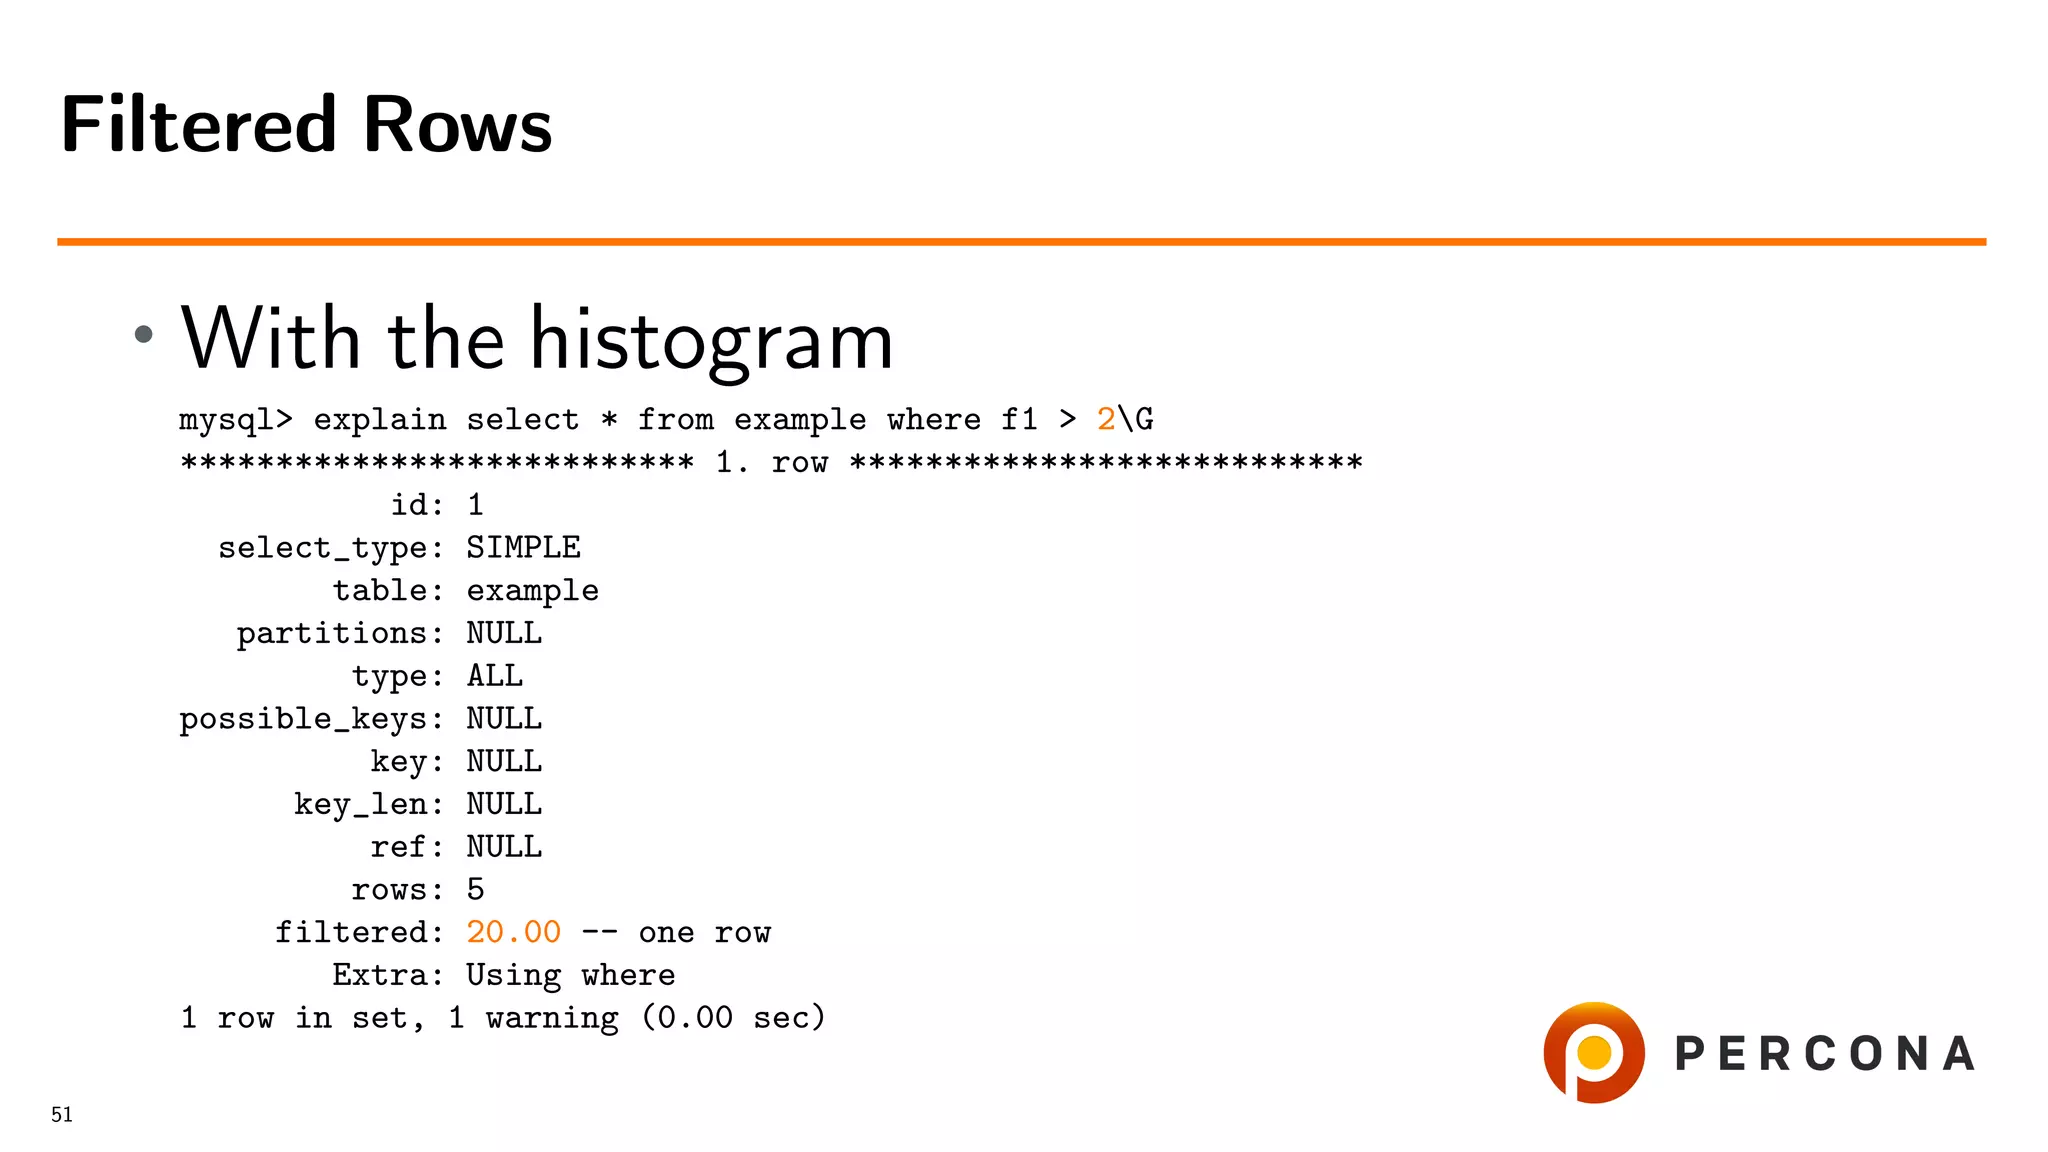
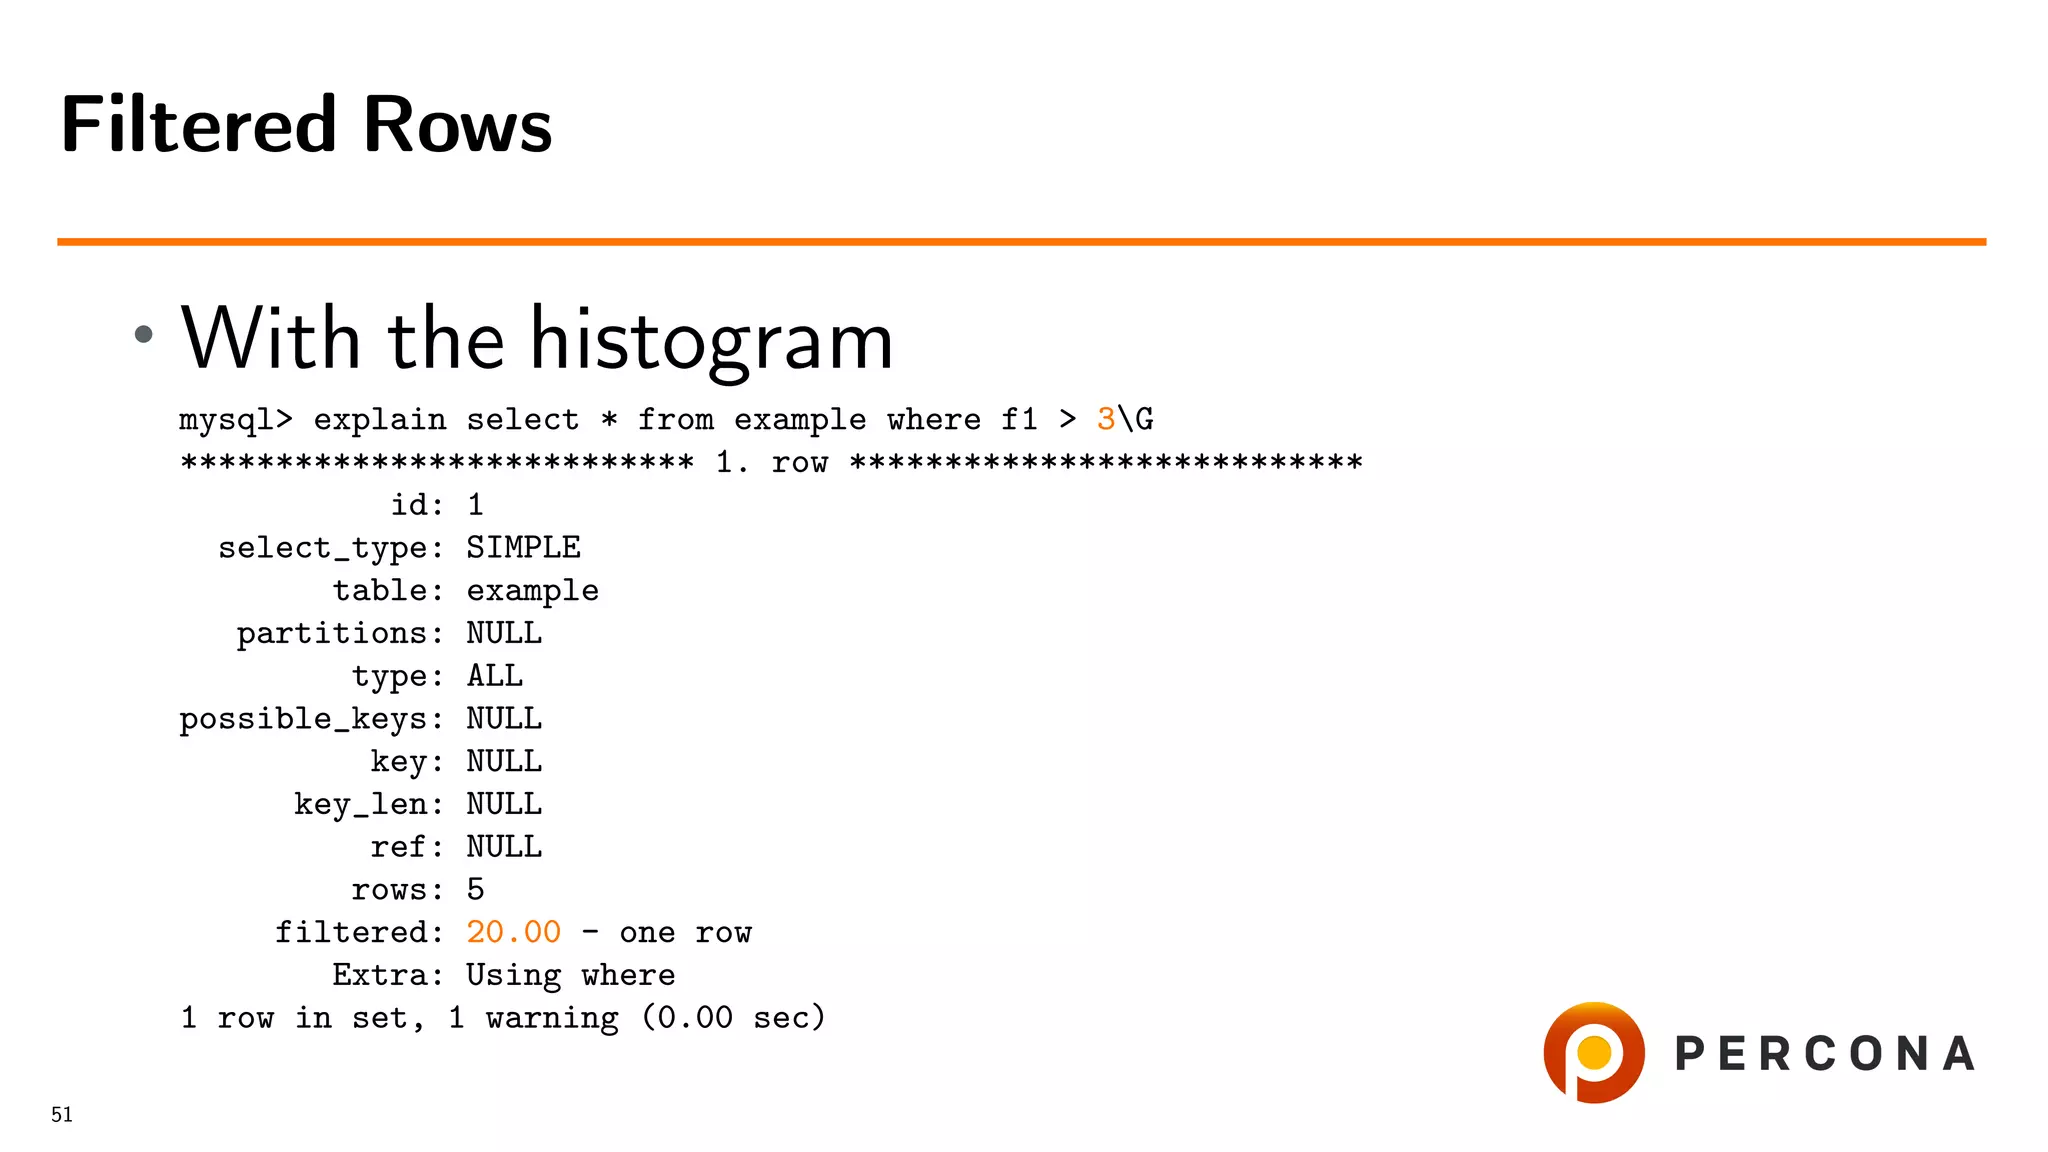
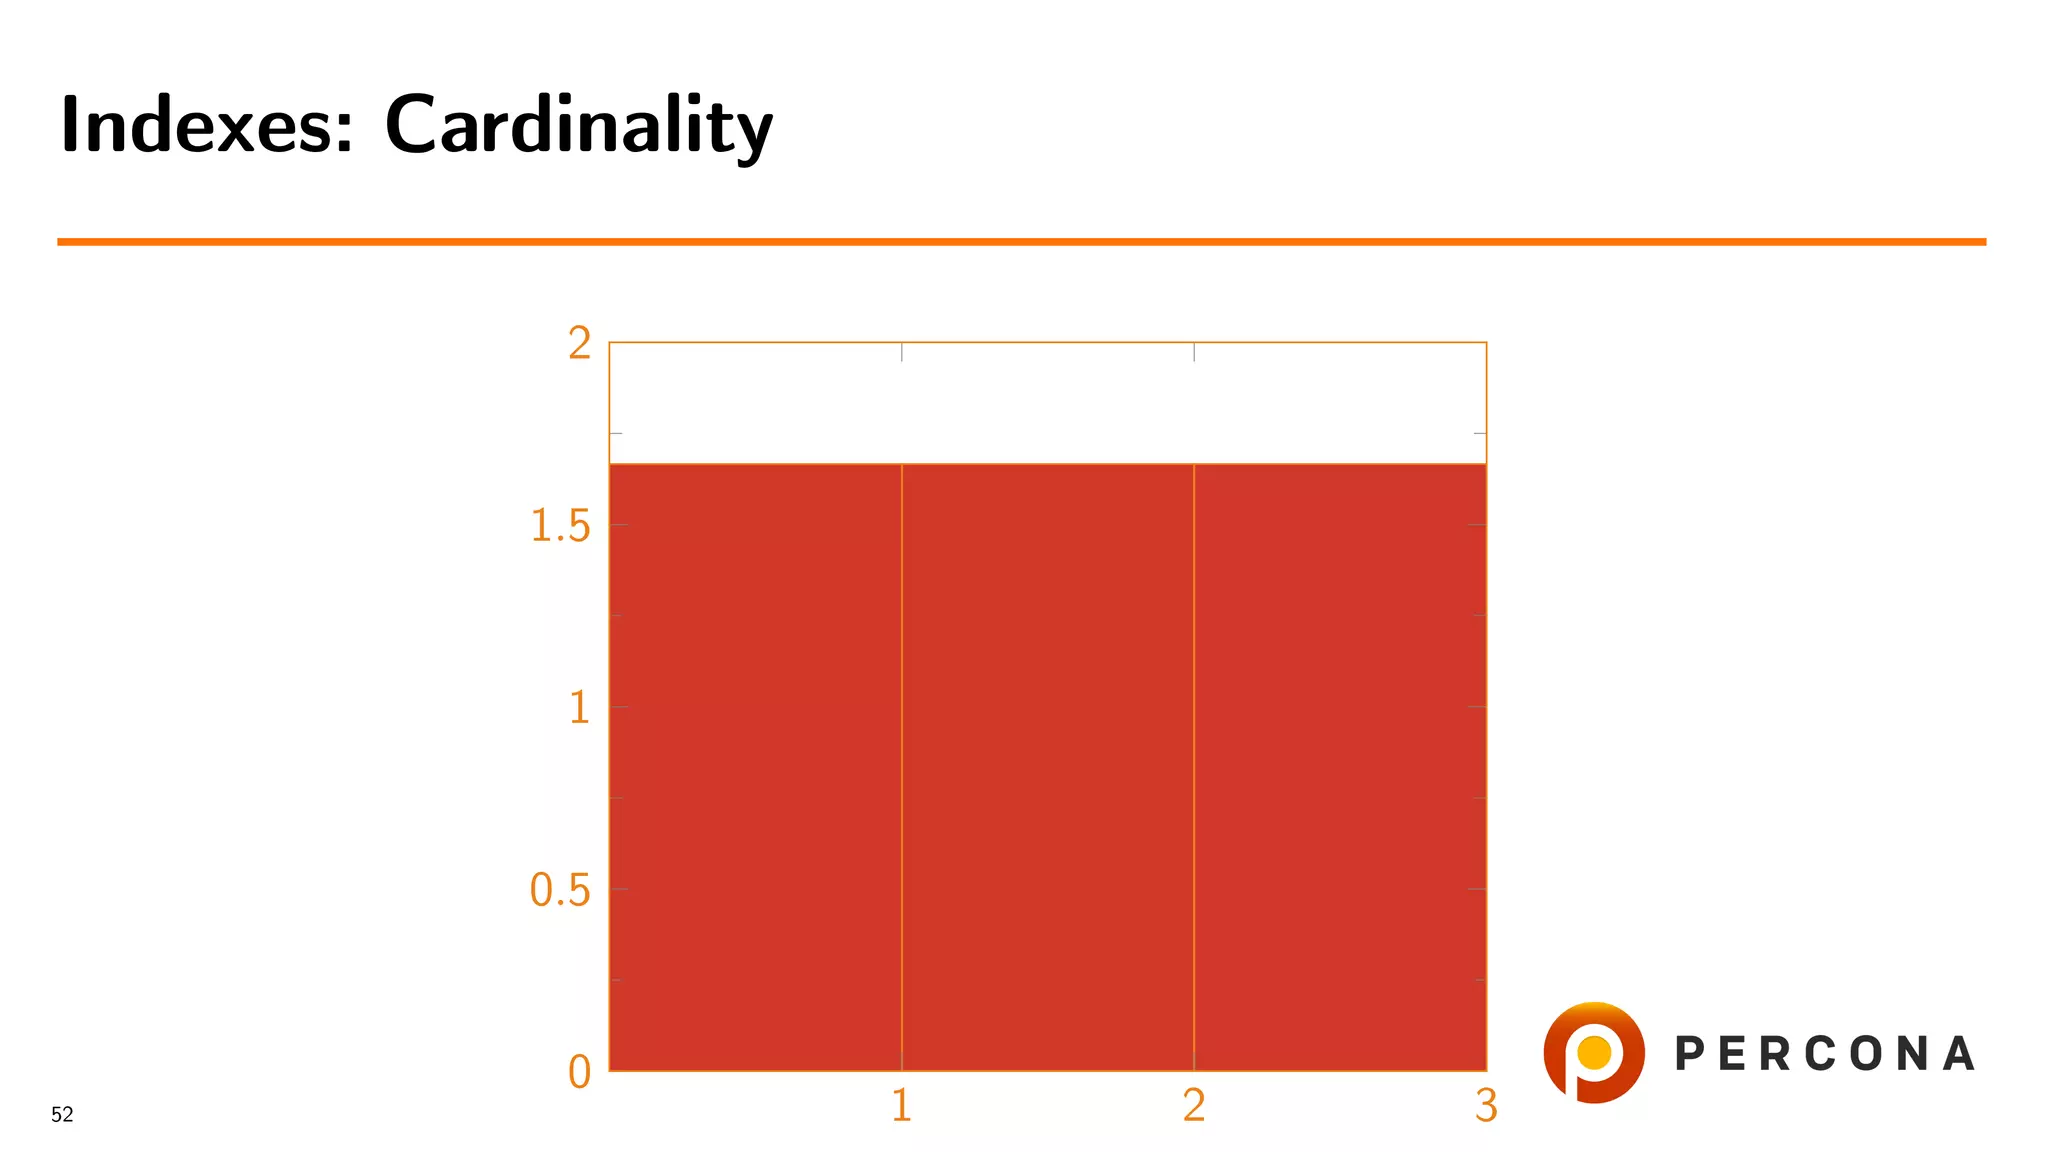
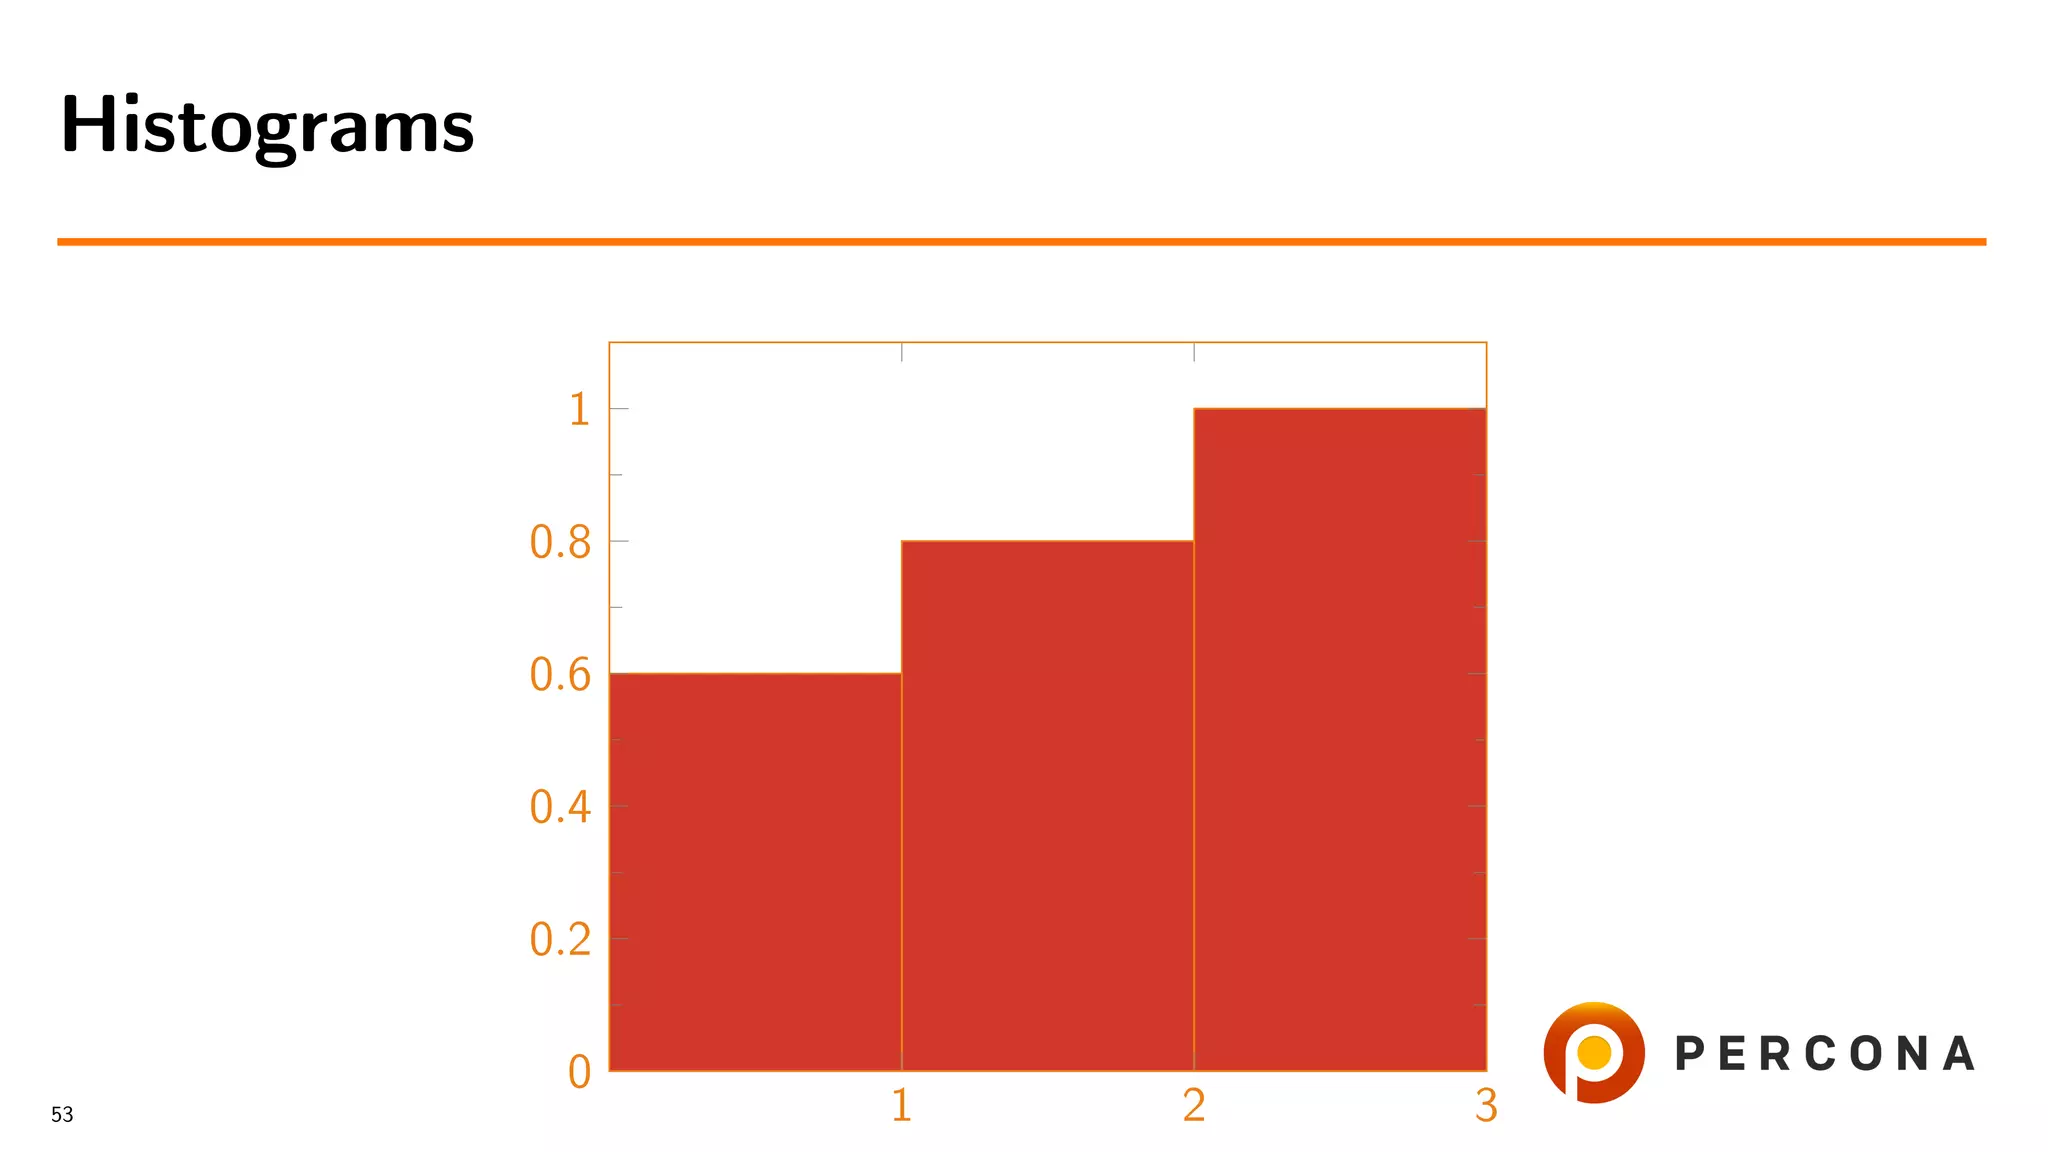
![• With the histogram
mysql> select * from information_schema.column_statistics
-> where table_name=’example’G
*************************** 1. row ***************************
SCHEMA_NAME: hist_ex
TABLE_NAME: example
COLUMN_NAME: f1
HISTOGRAM:
"buckets": [[1, 0.6], [2, 0.8], [3, 1.0]],
"data-type": "int", "null-values": 0.0, "collation-id": 8,
"last-updated": "2018-11-07 09:07:19.791470",
"sampling-rate": 1.0, "histogram-type": "singleton",
"number-of-buckets-specified": 3
1 row in set (0.00 sec)
Filtered Rows
51](https://image.slidesharecdn.com/histogramsoow2019-190921043520/75/A-Billion-Goods-in-a-Few-Categories-When-Optimizer-Histograms-Help-and-When-They-Don-t-144-2048.jpg)


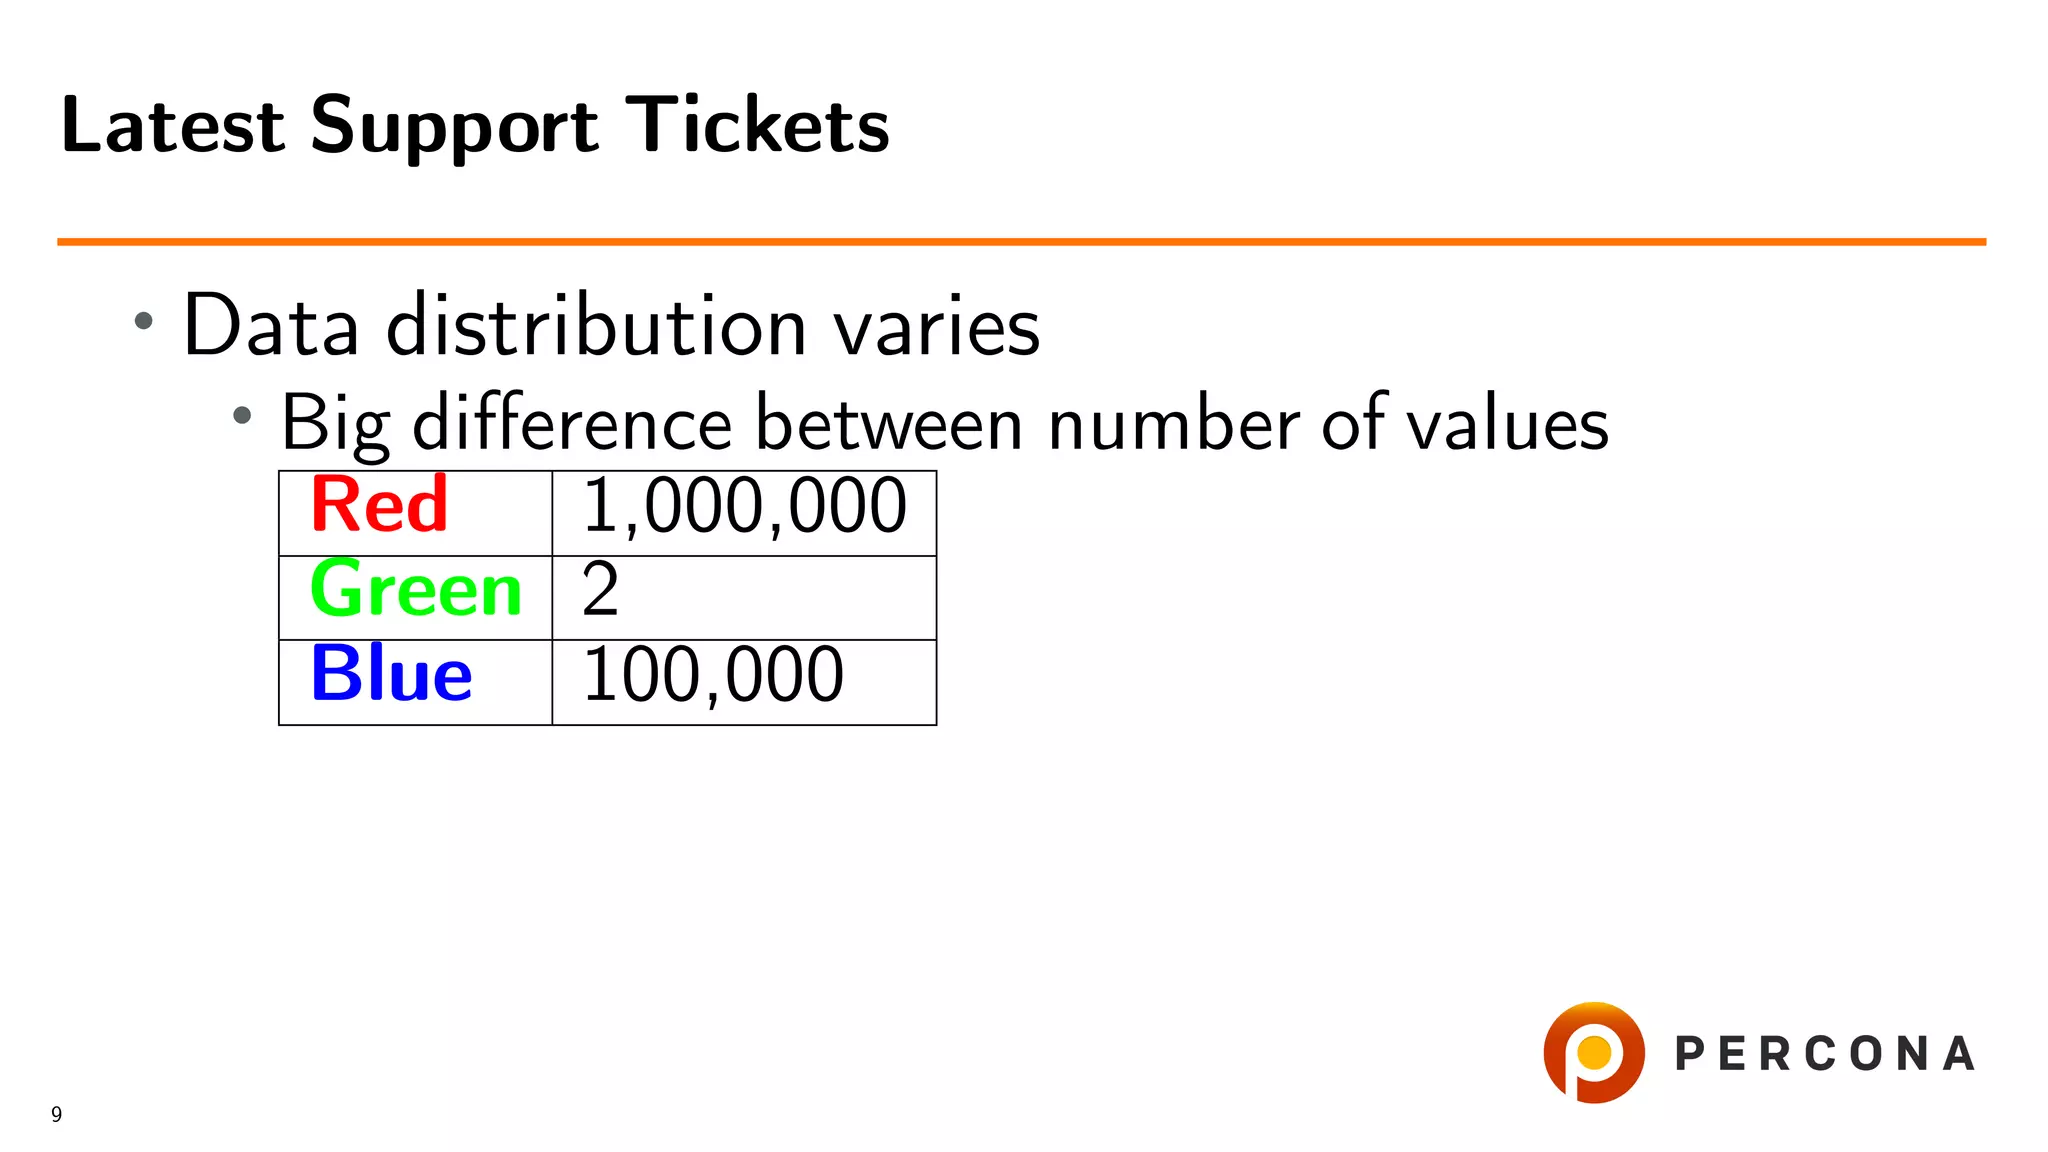
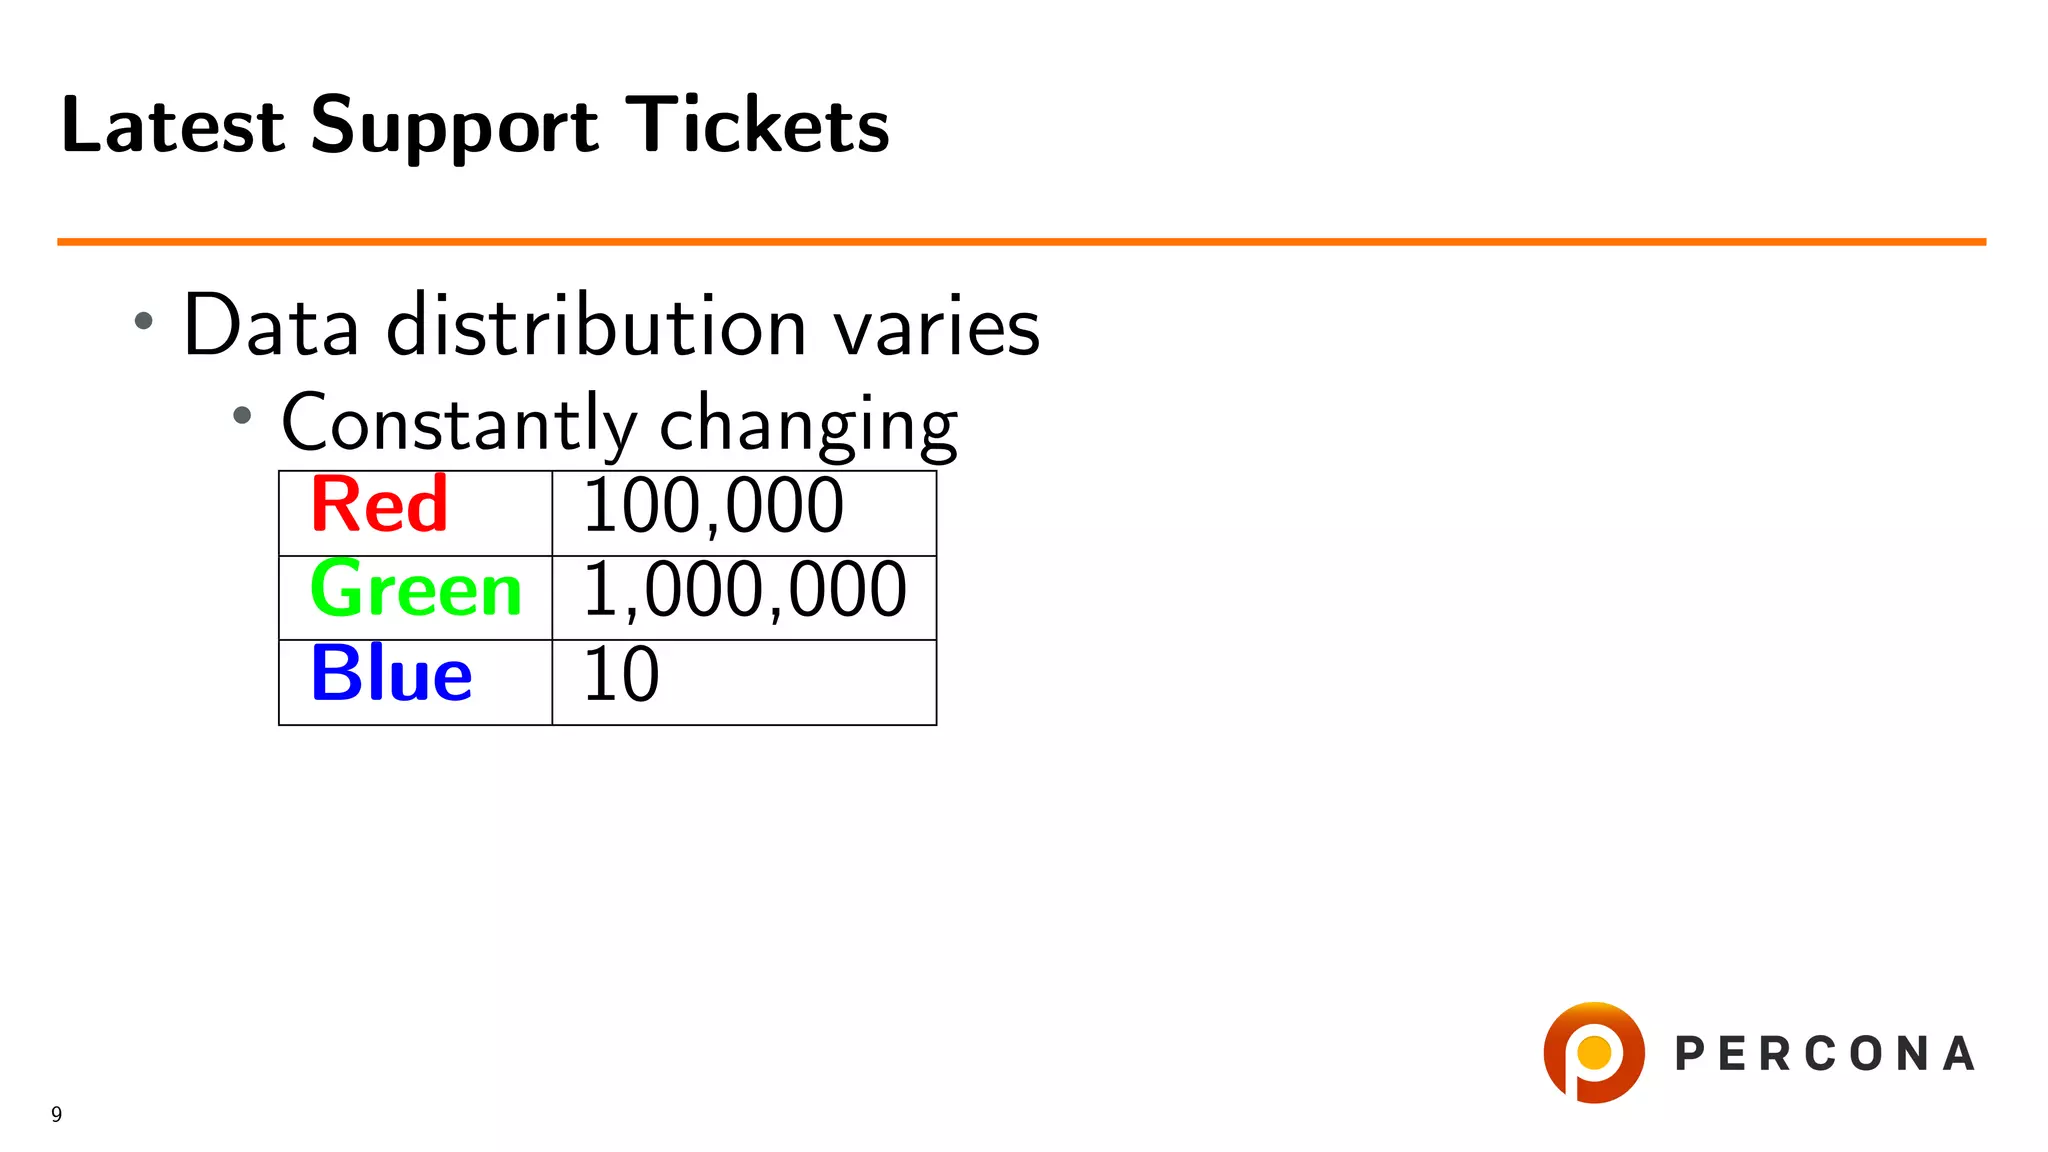
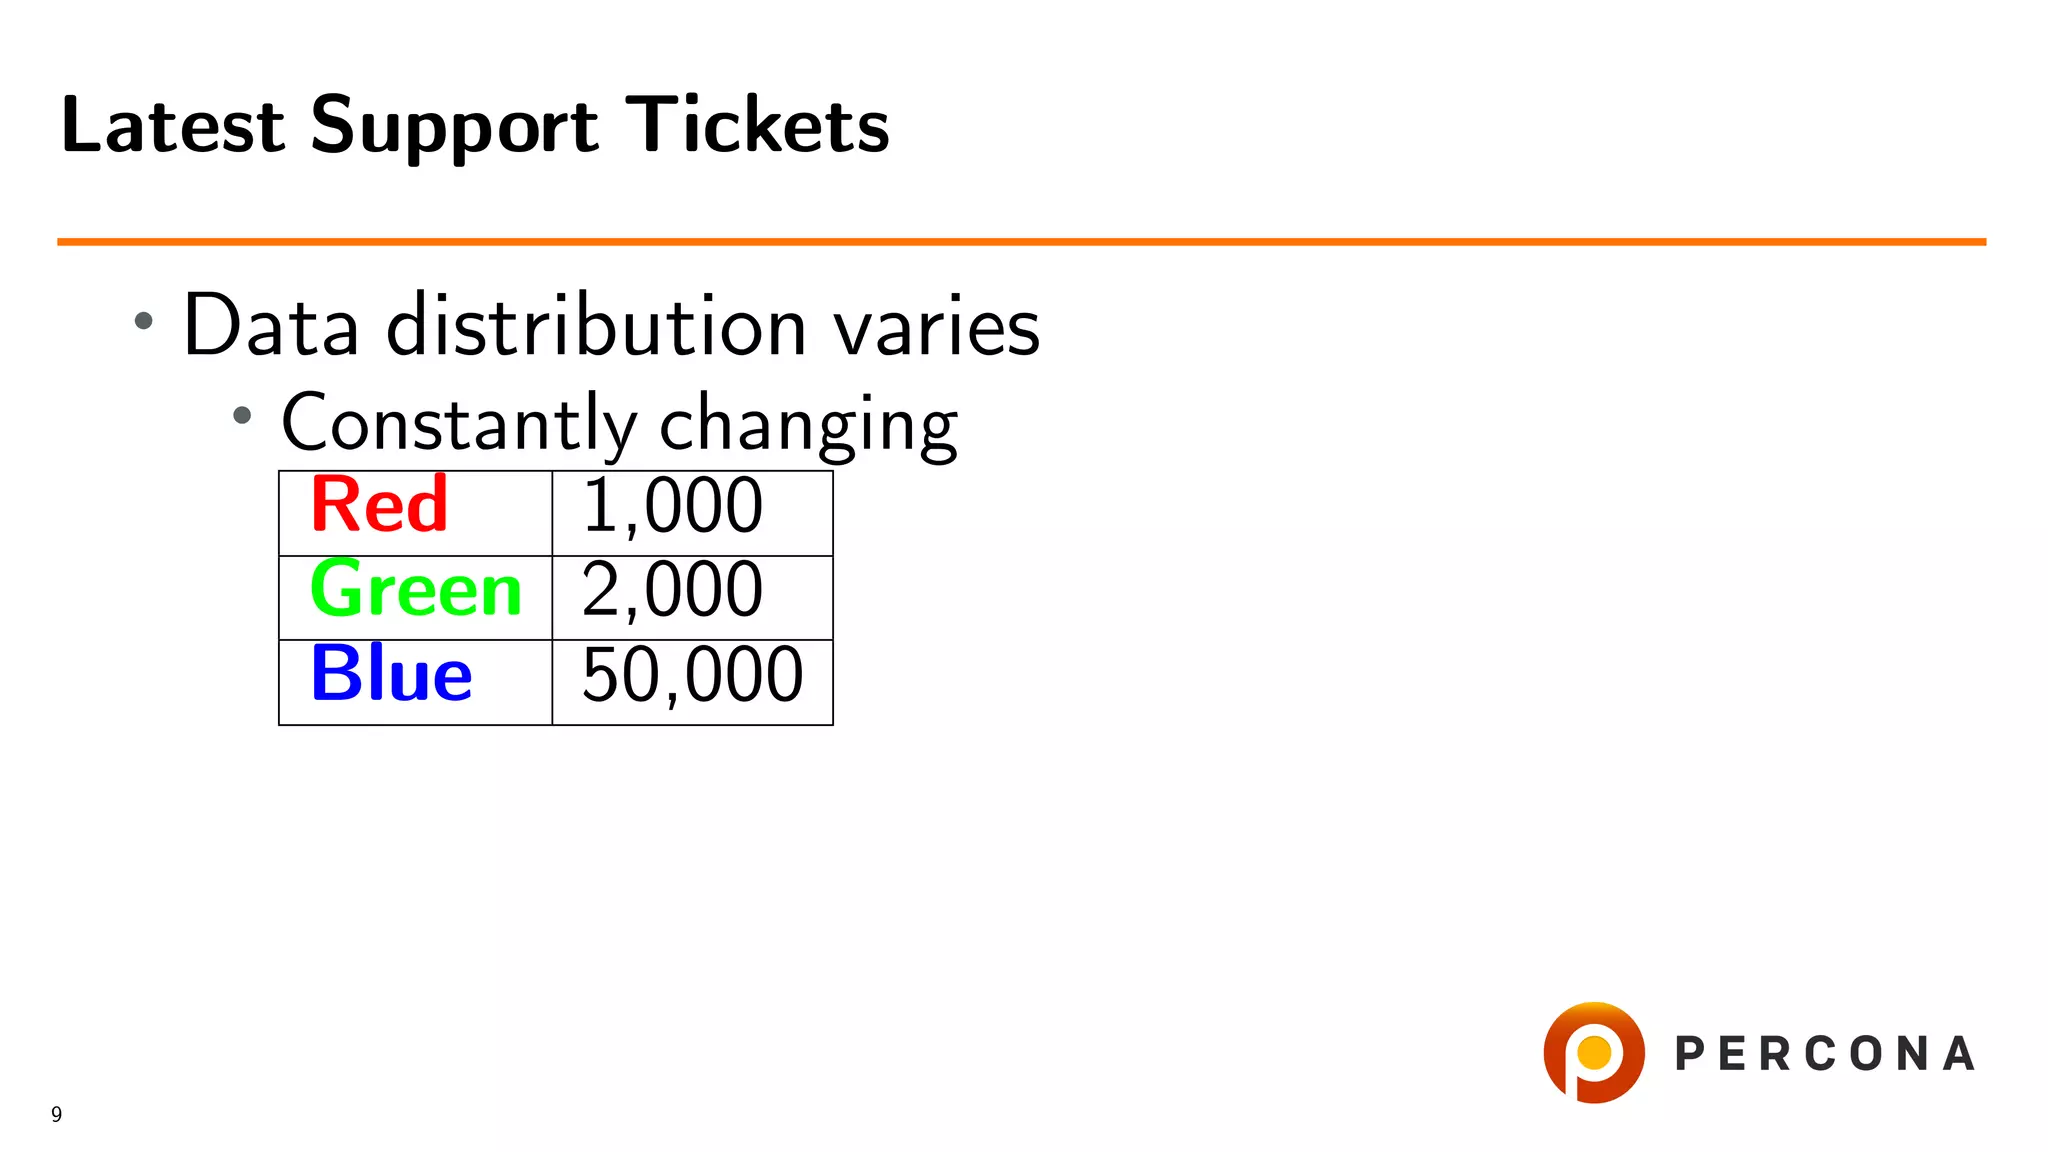
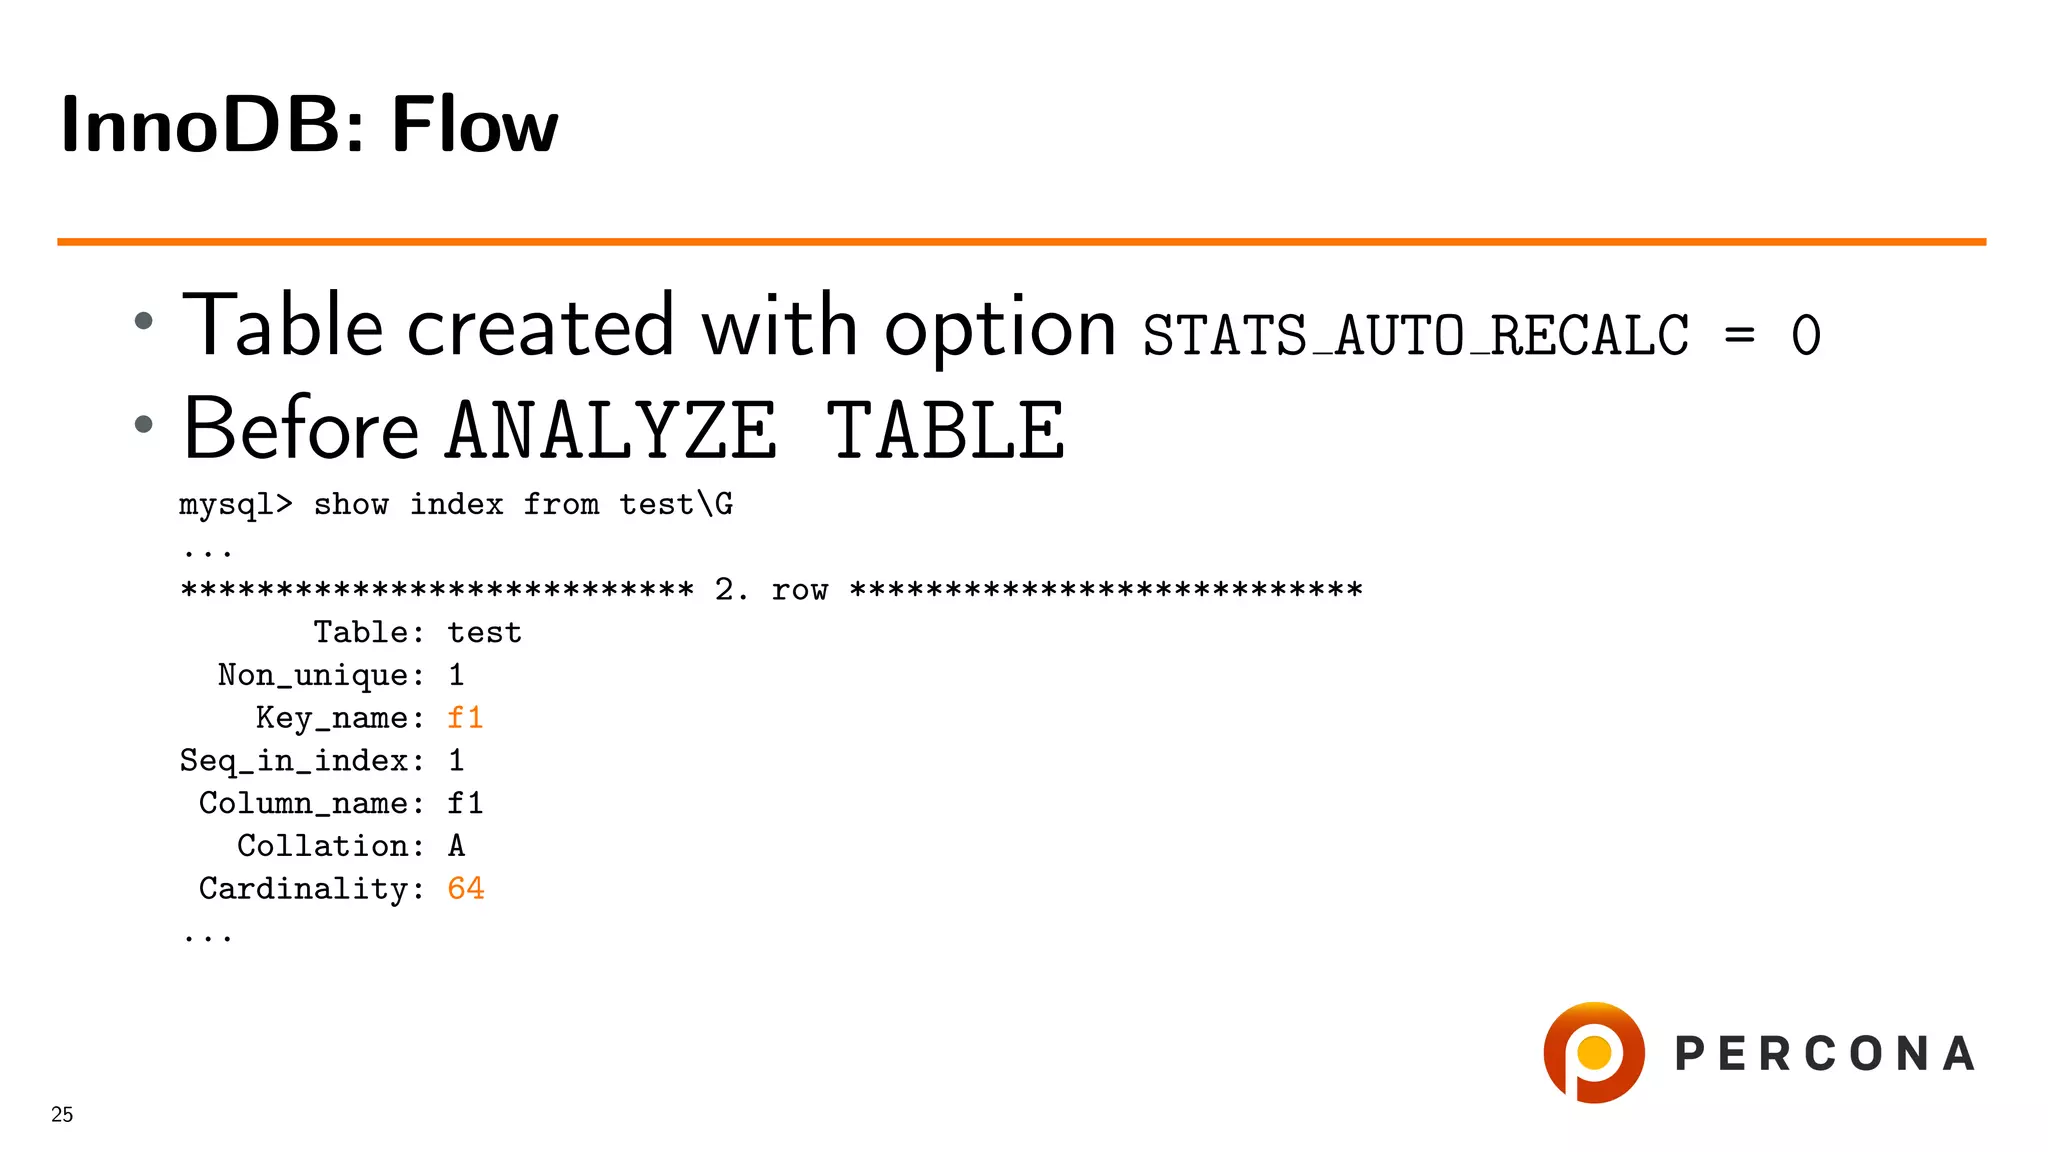
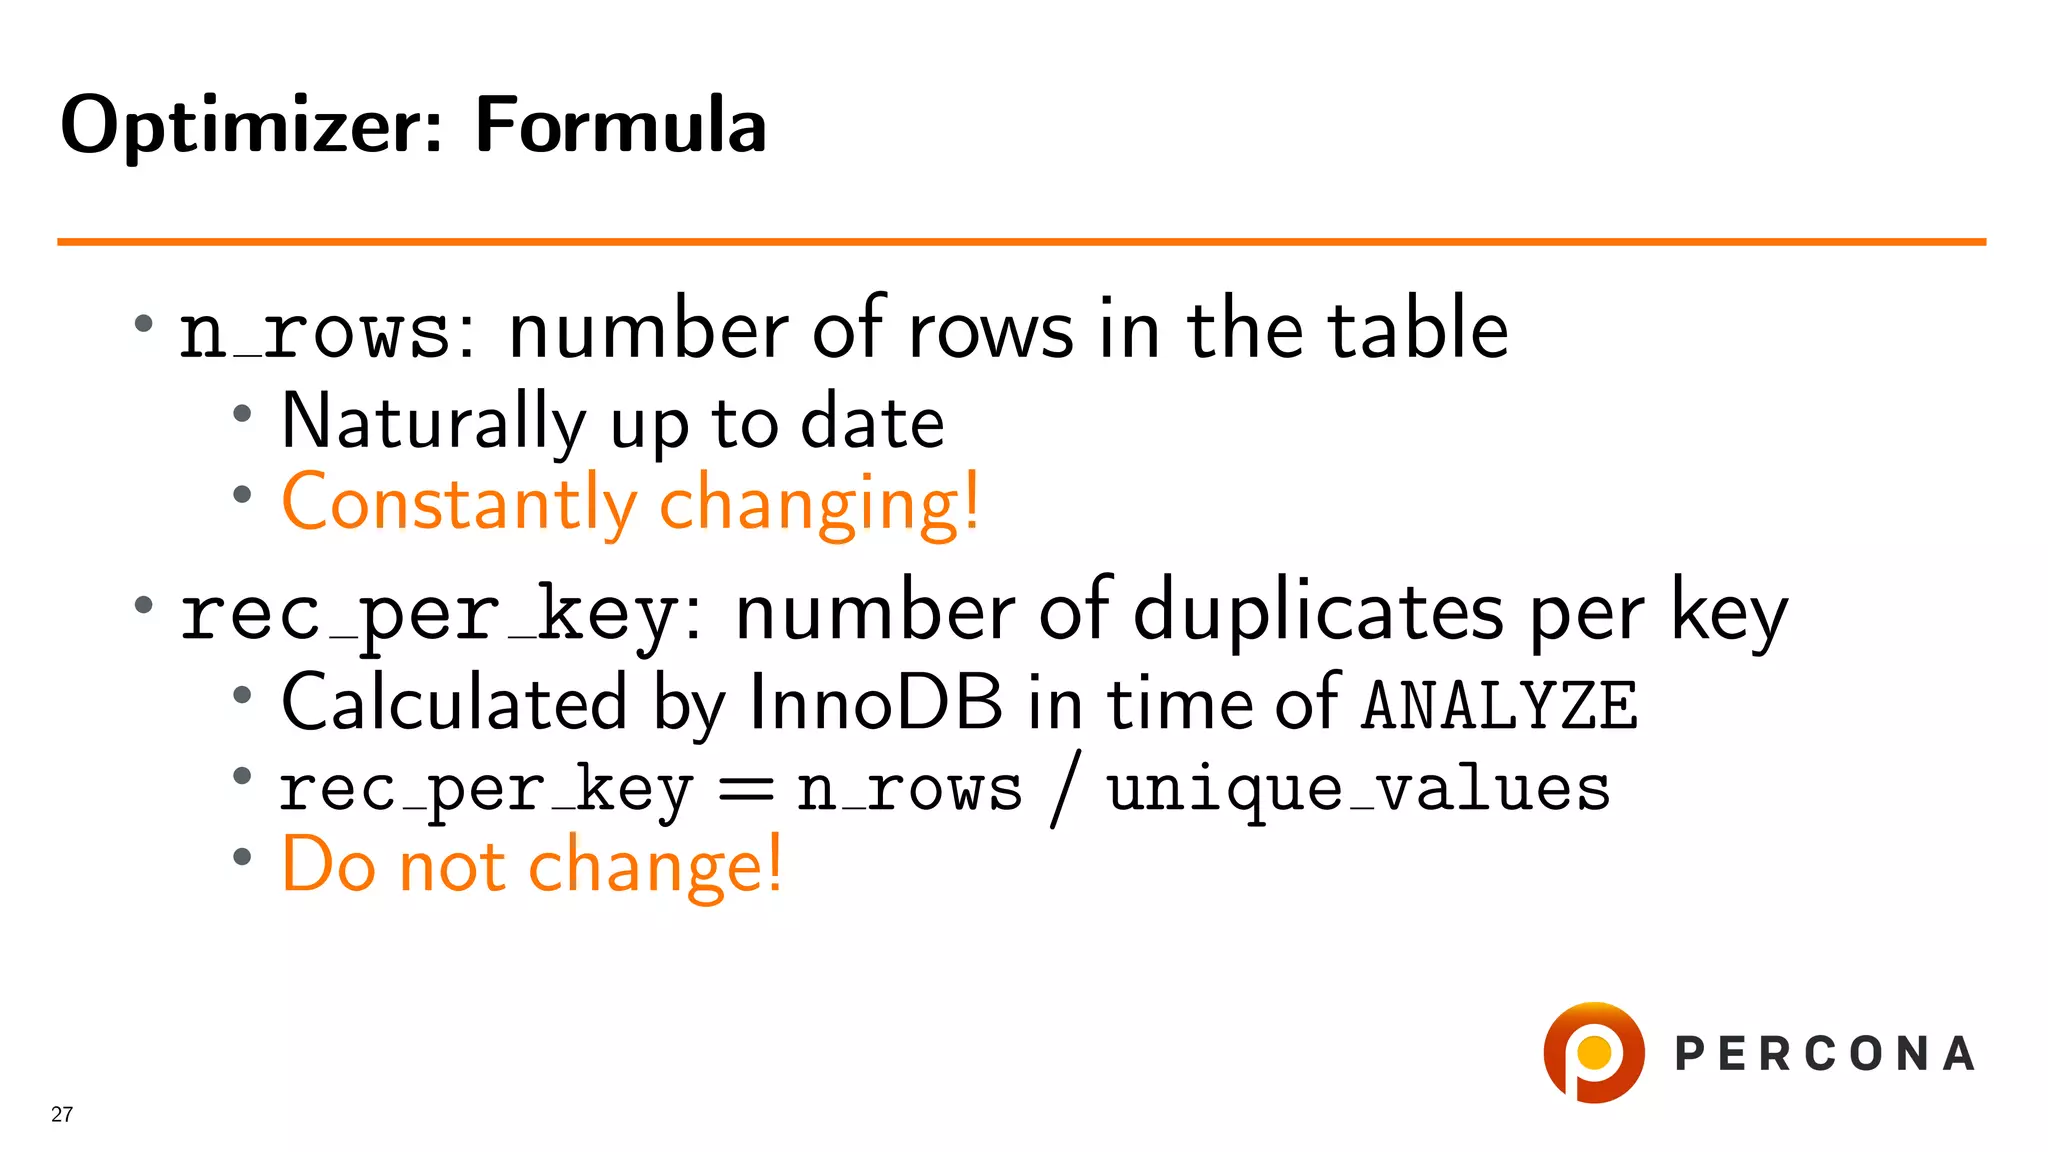
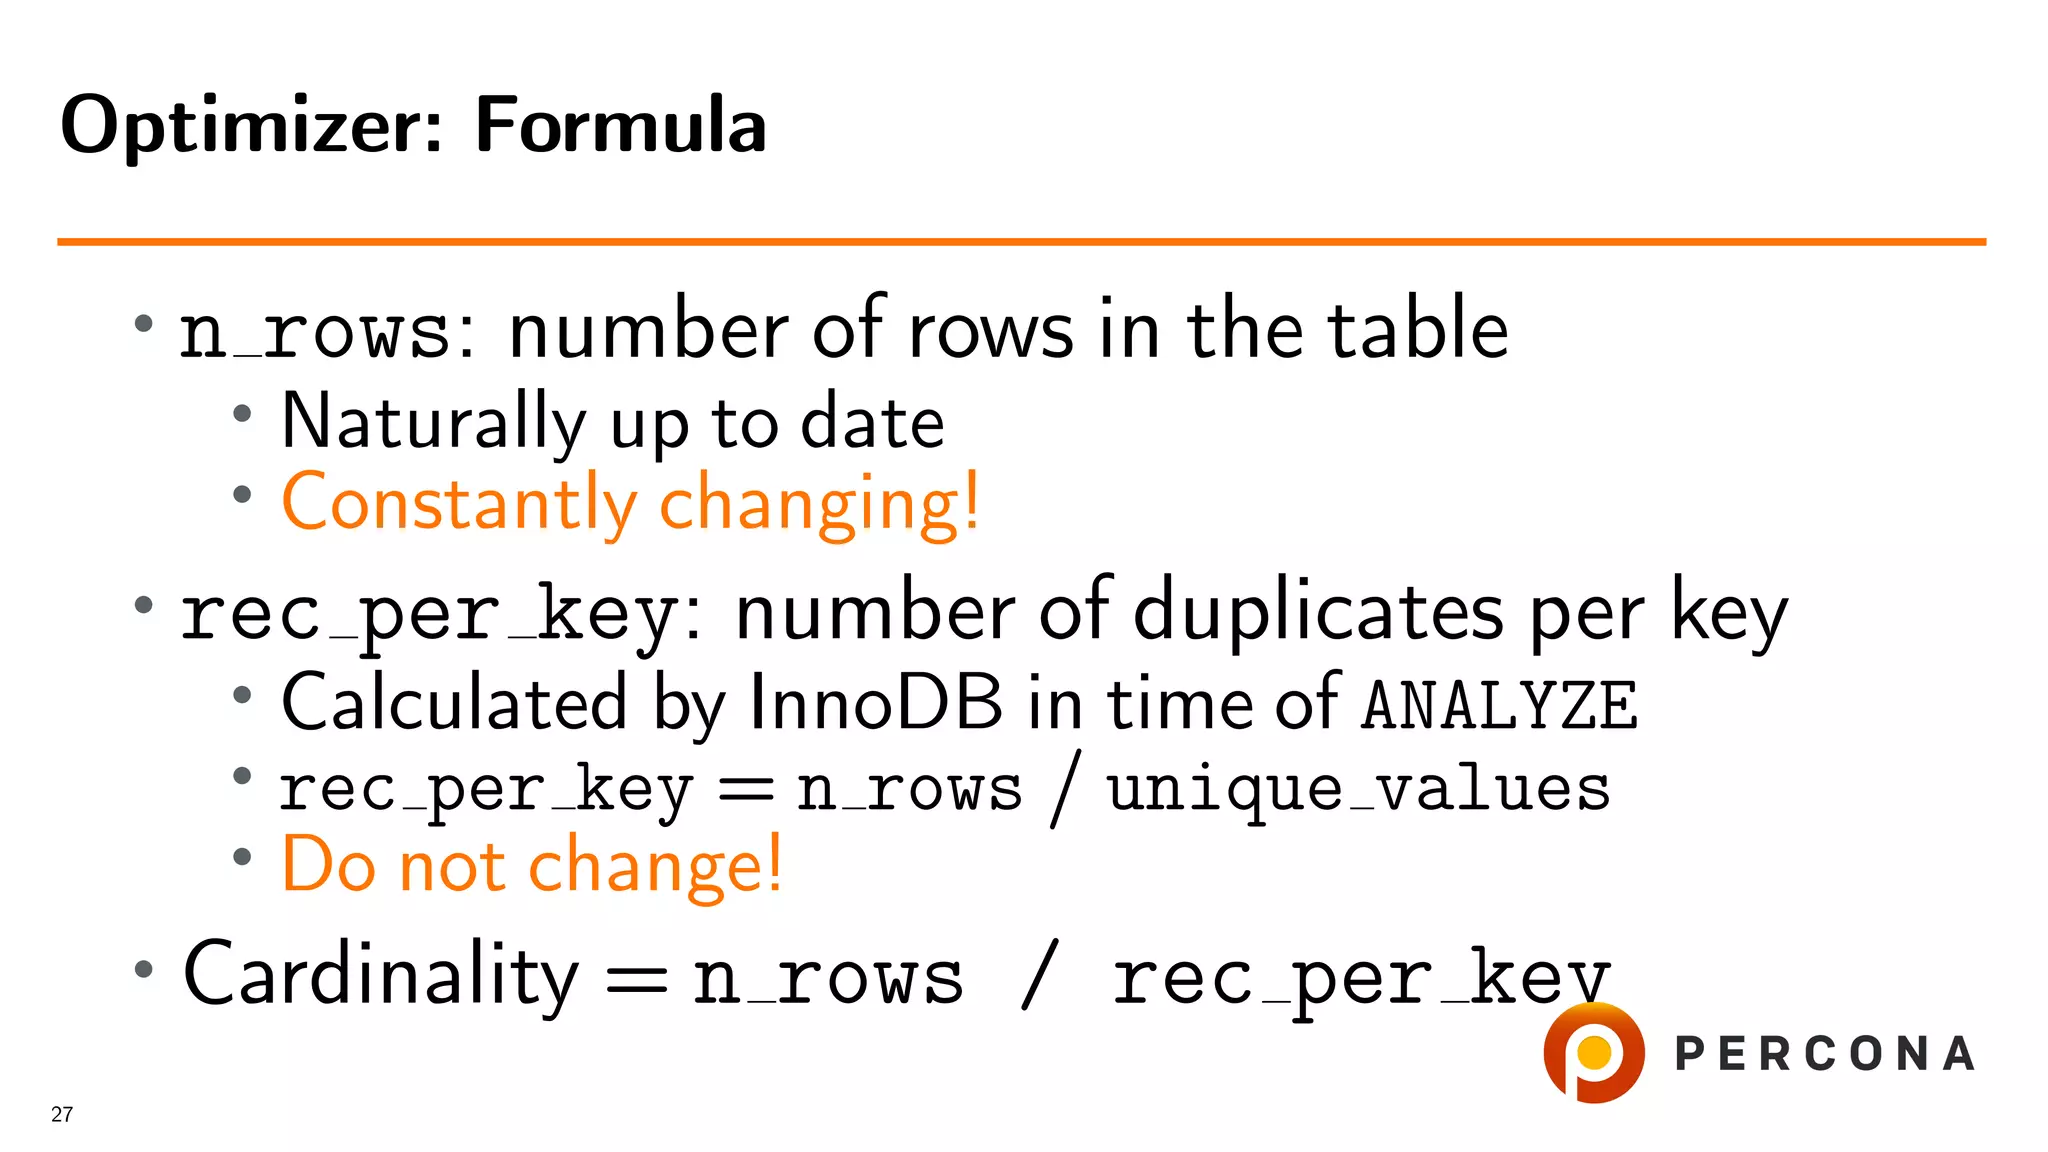
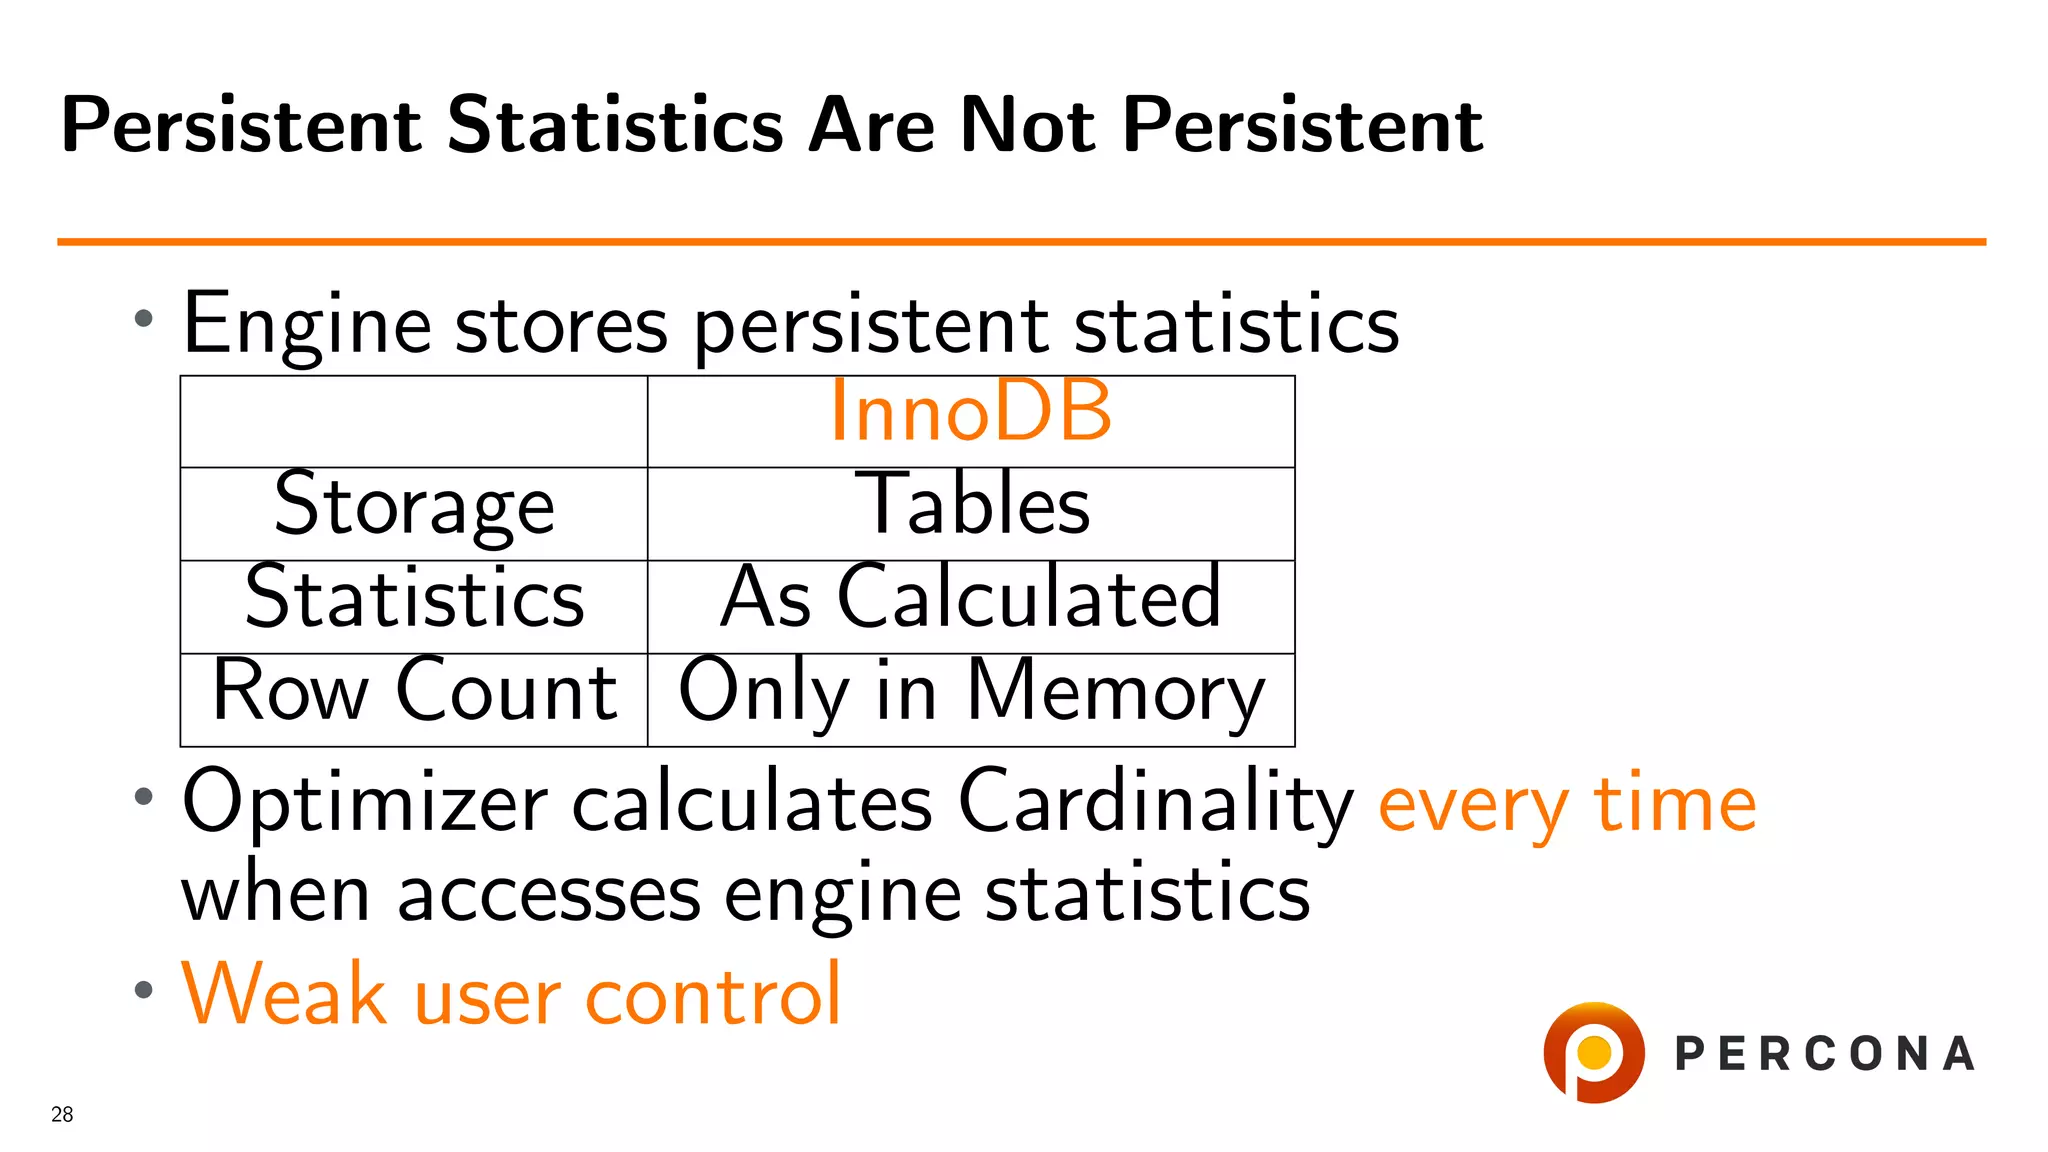
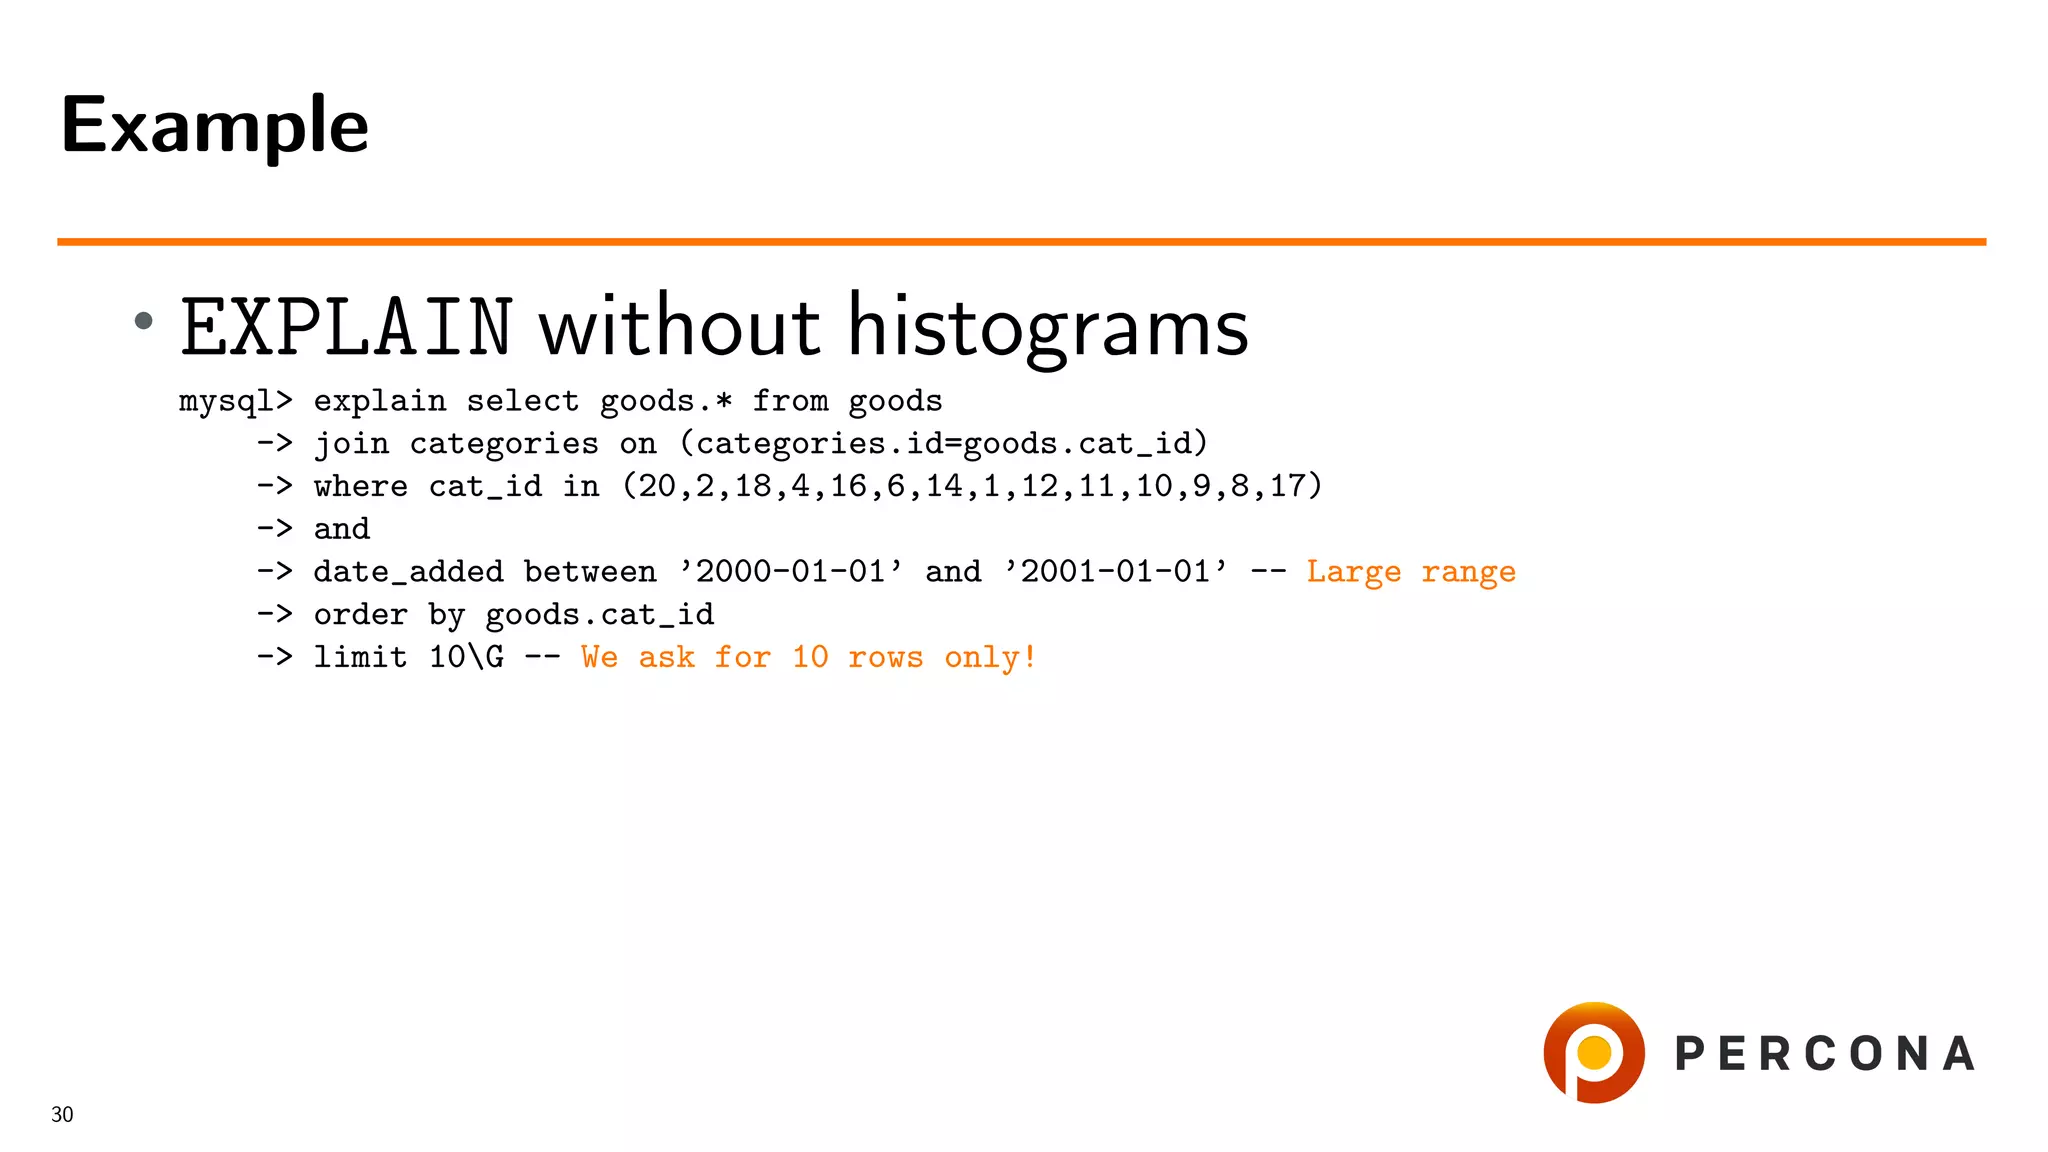
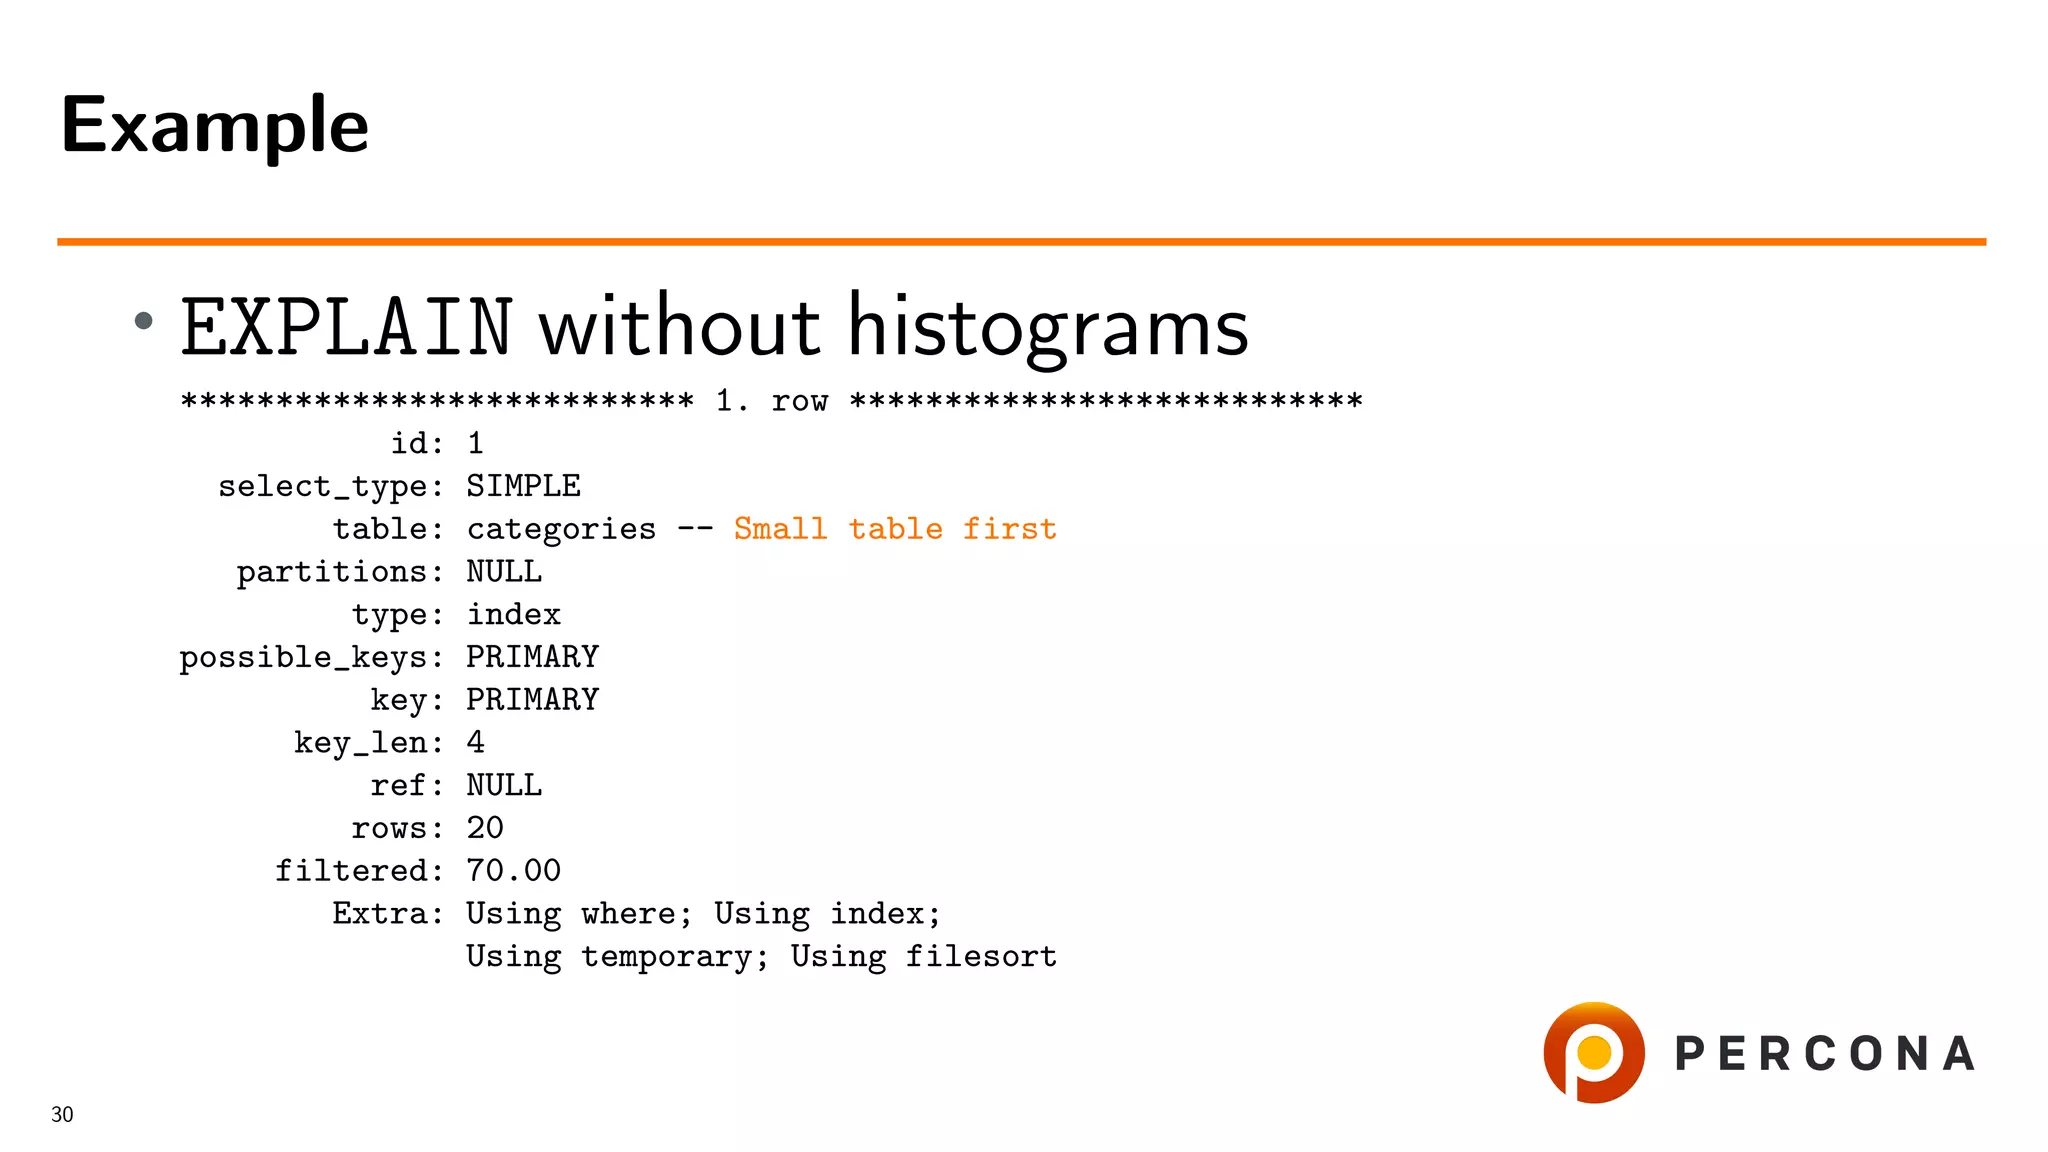
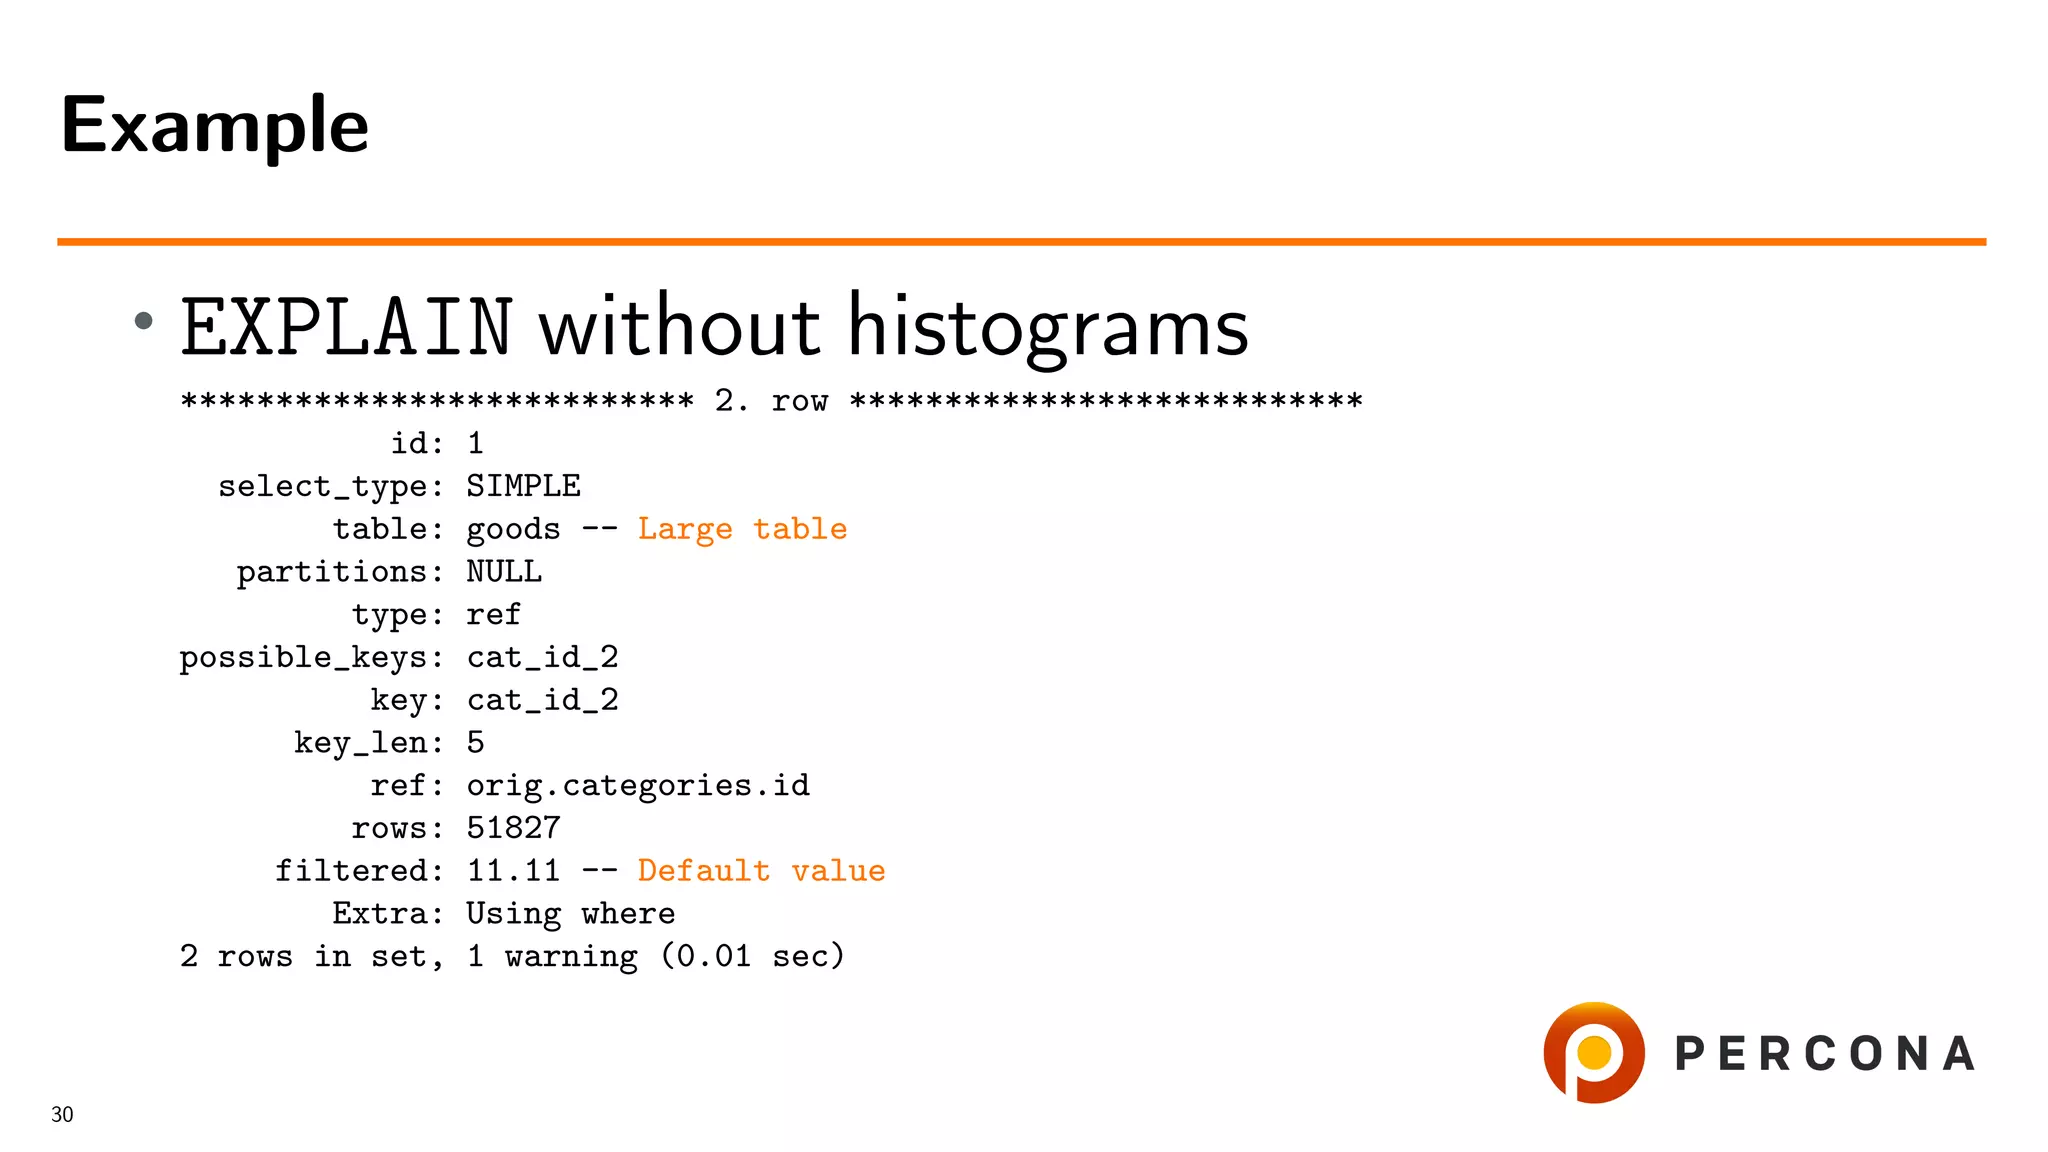
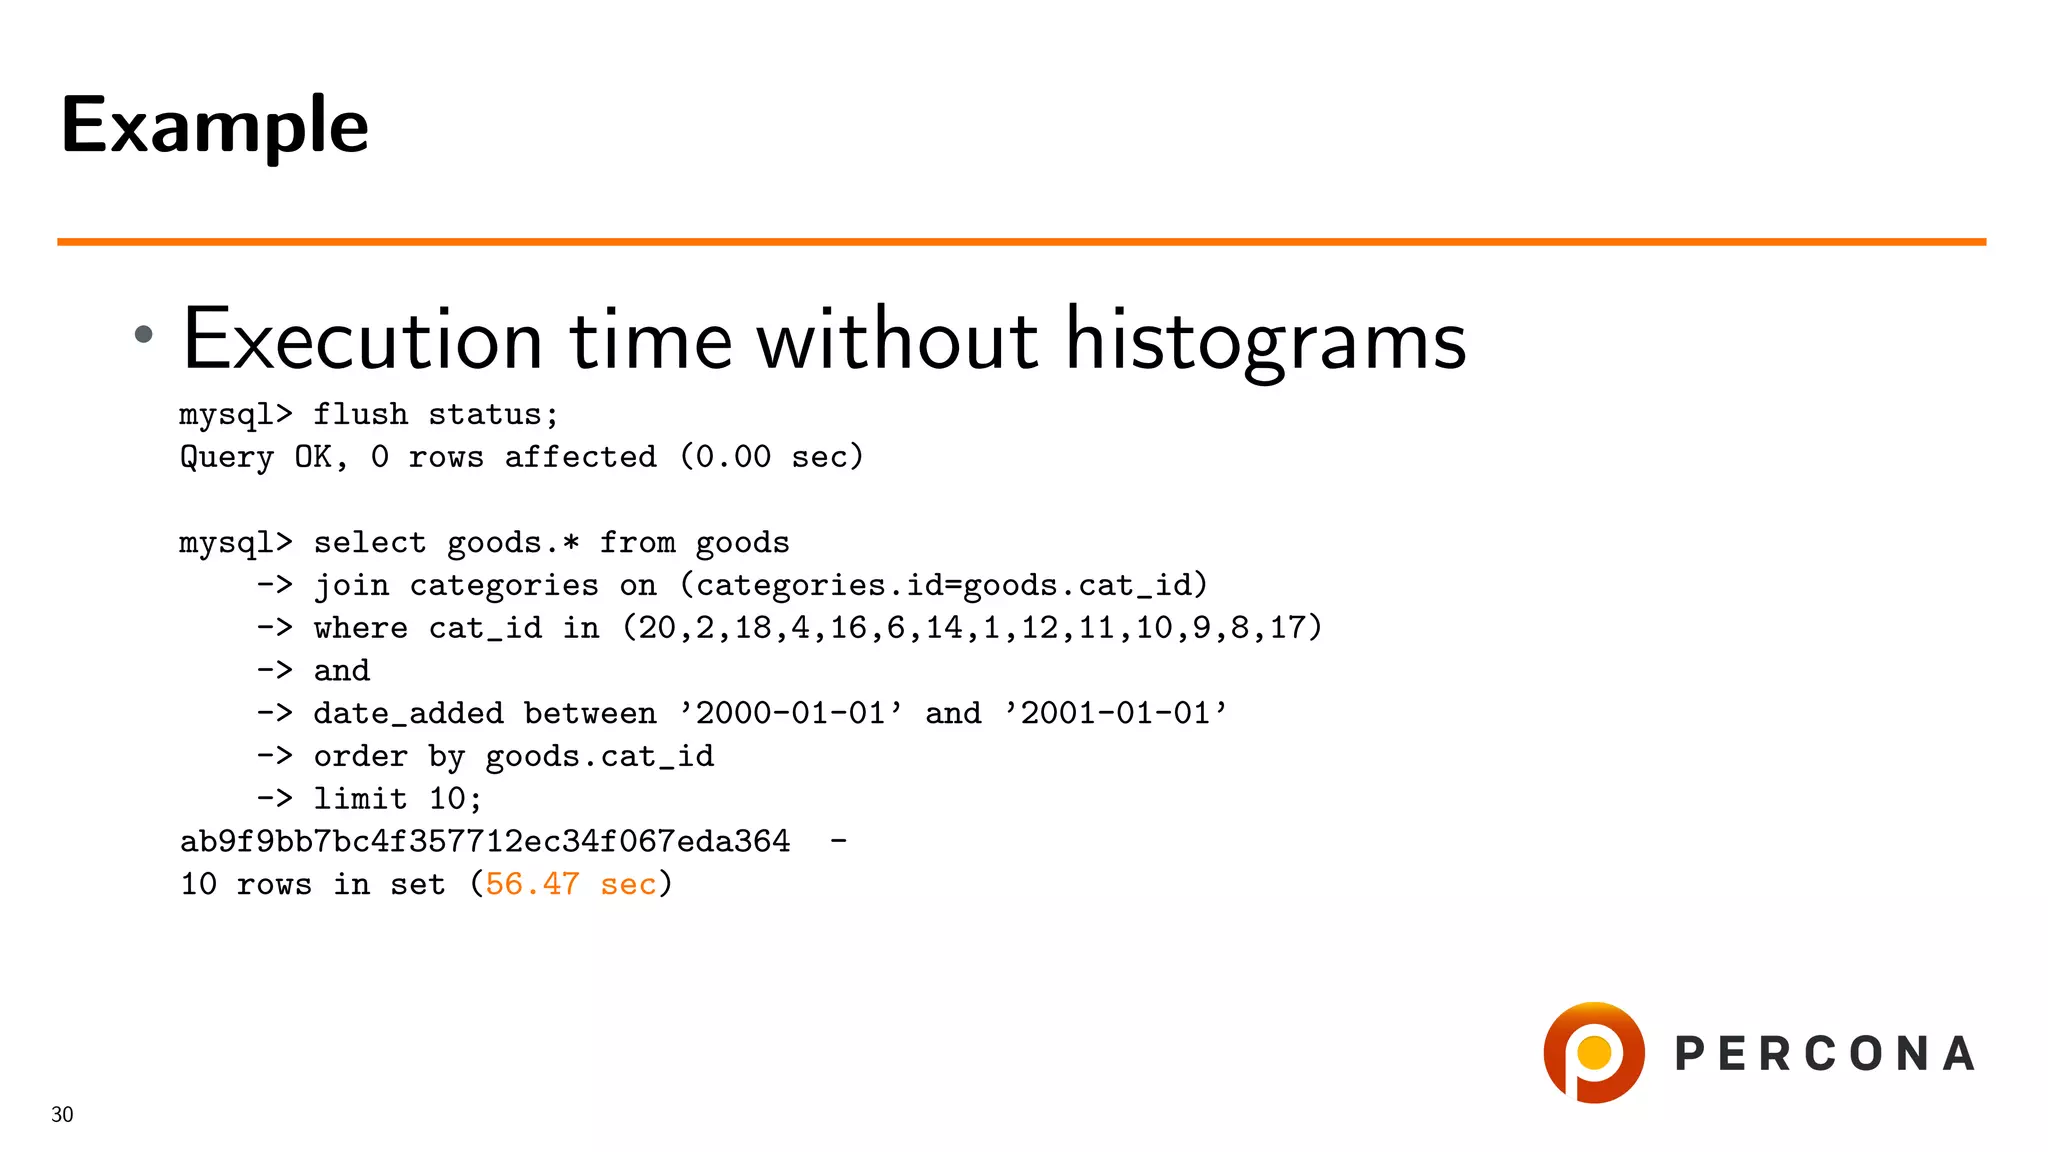
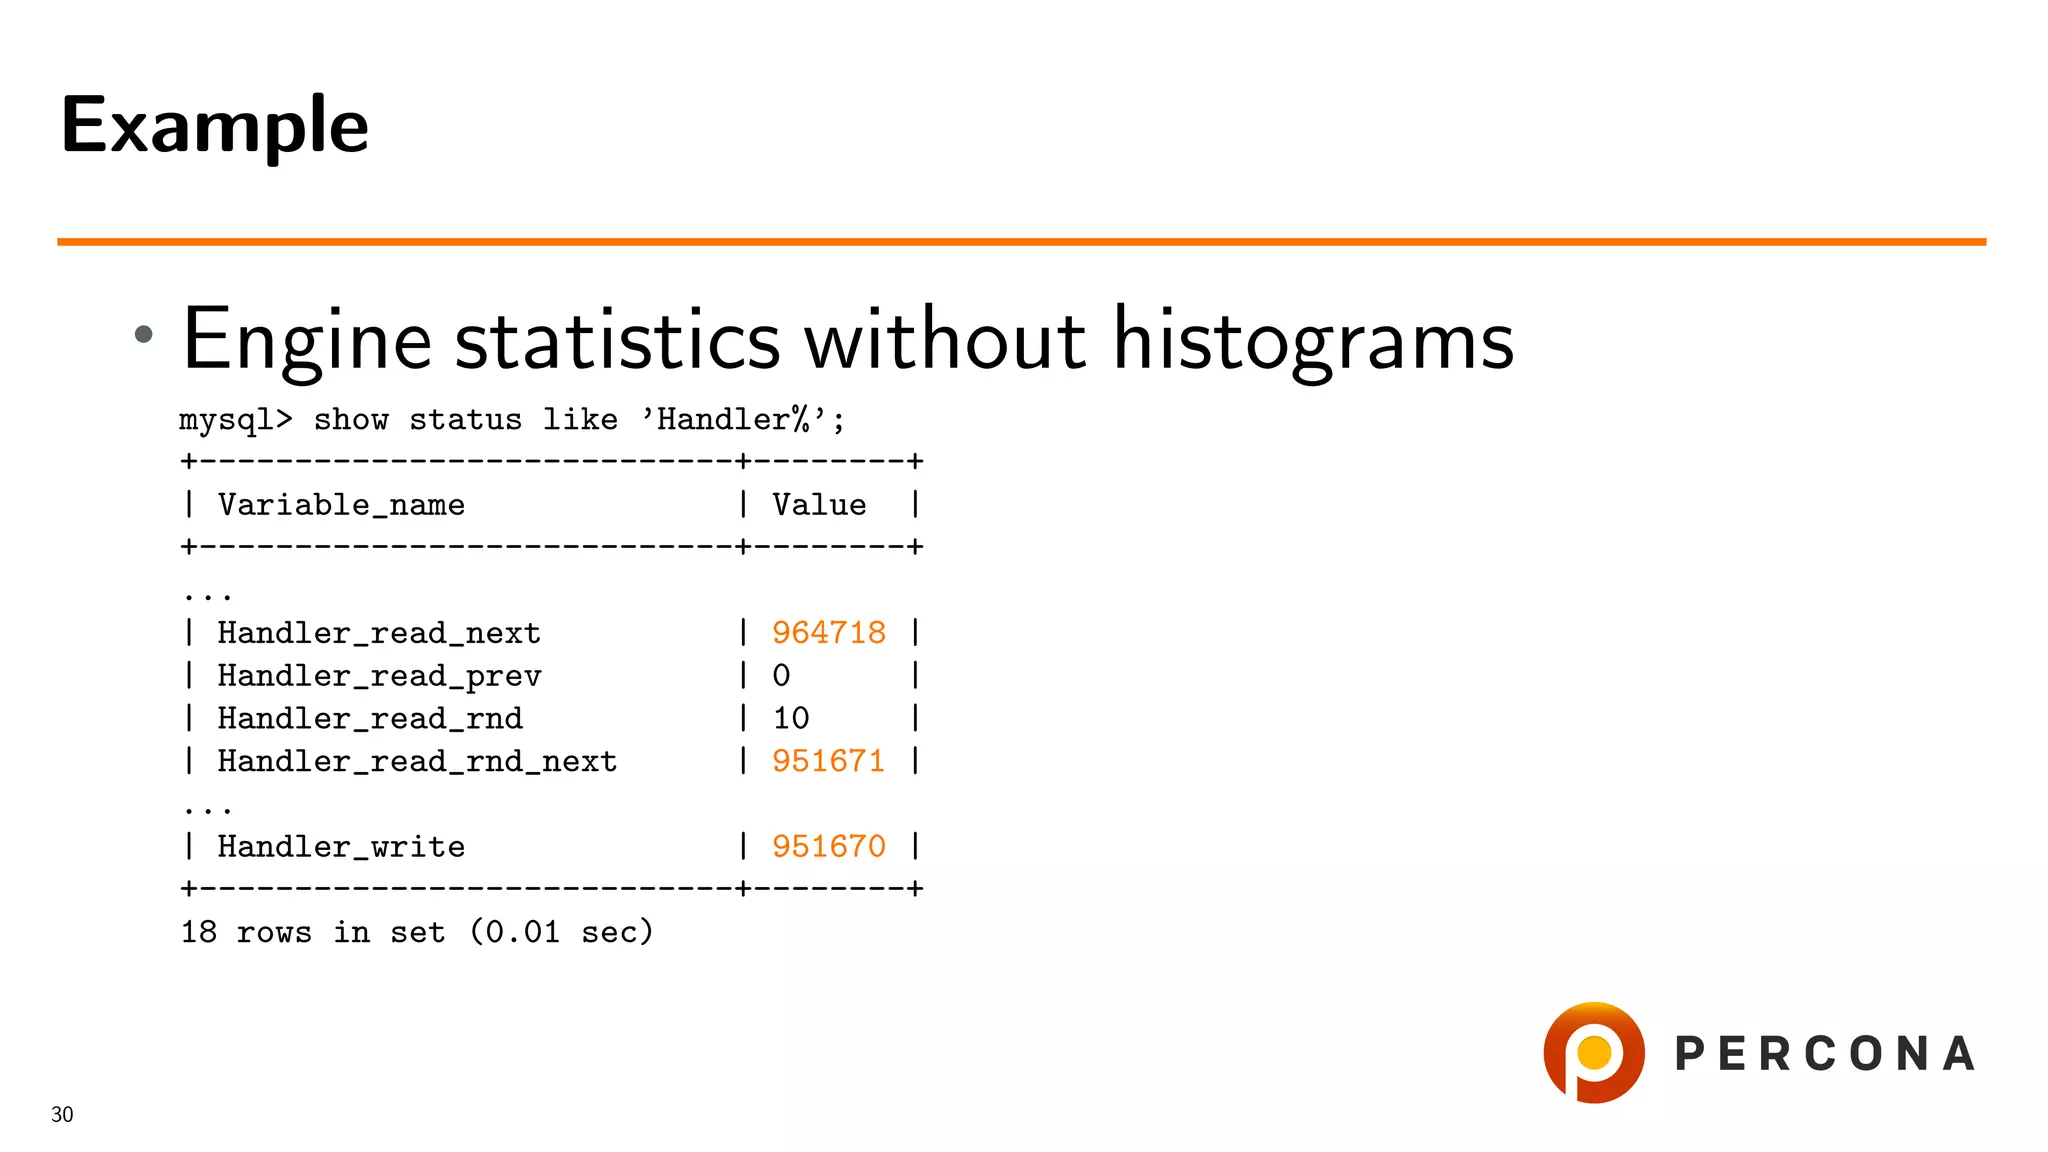
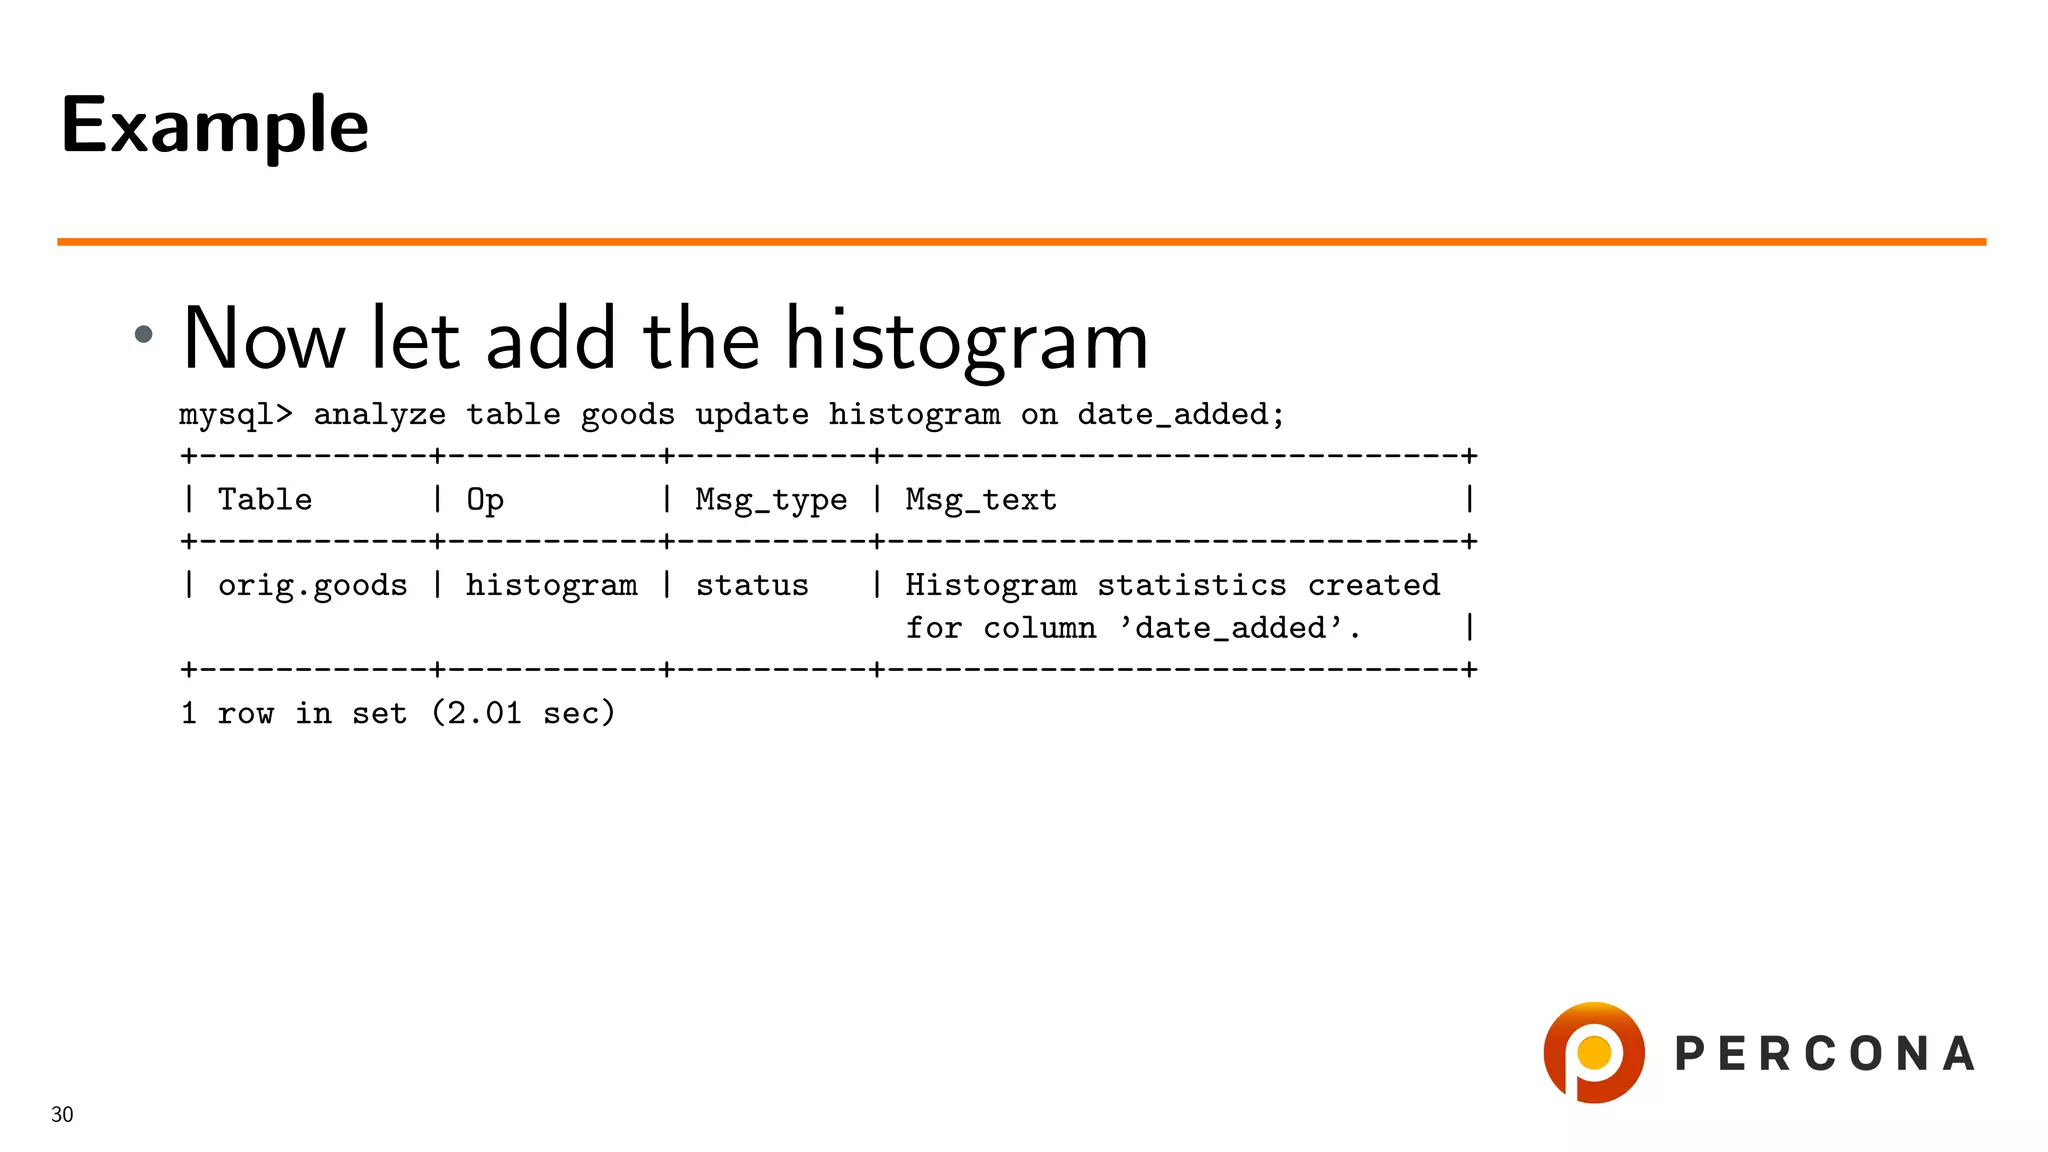
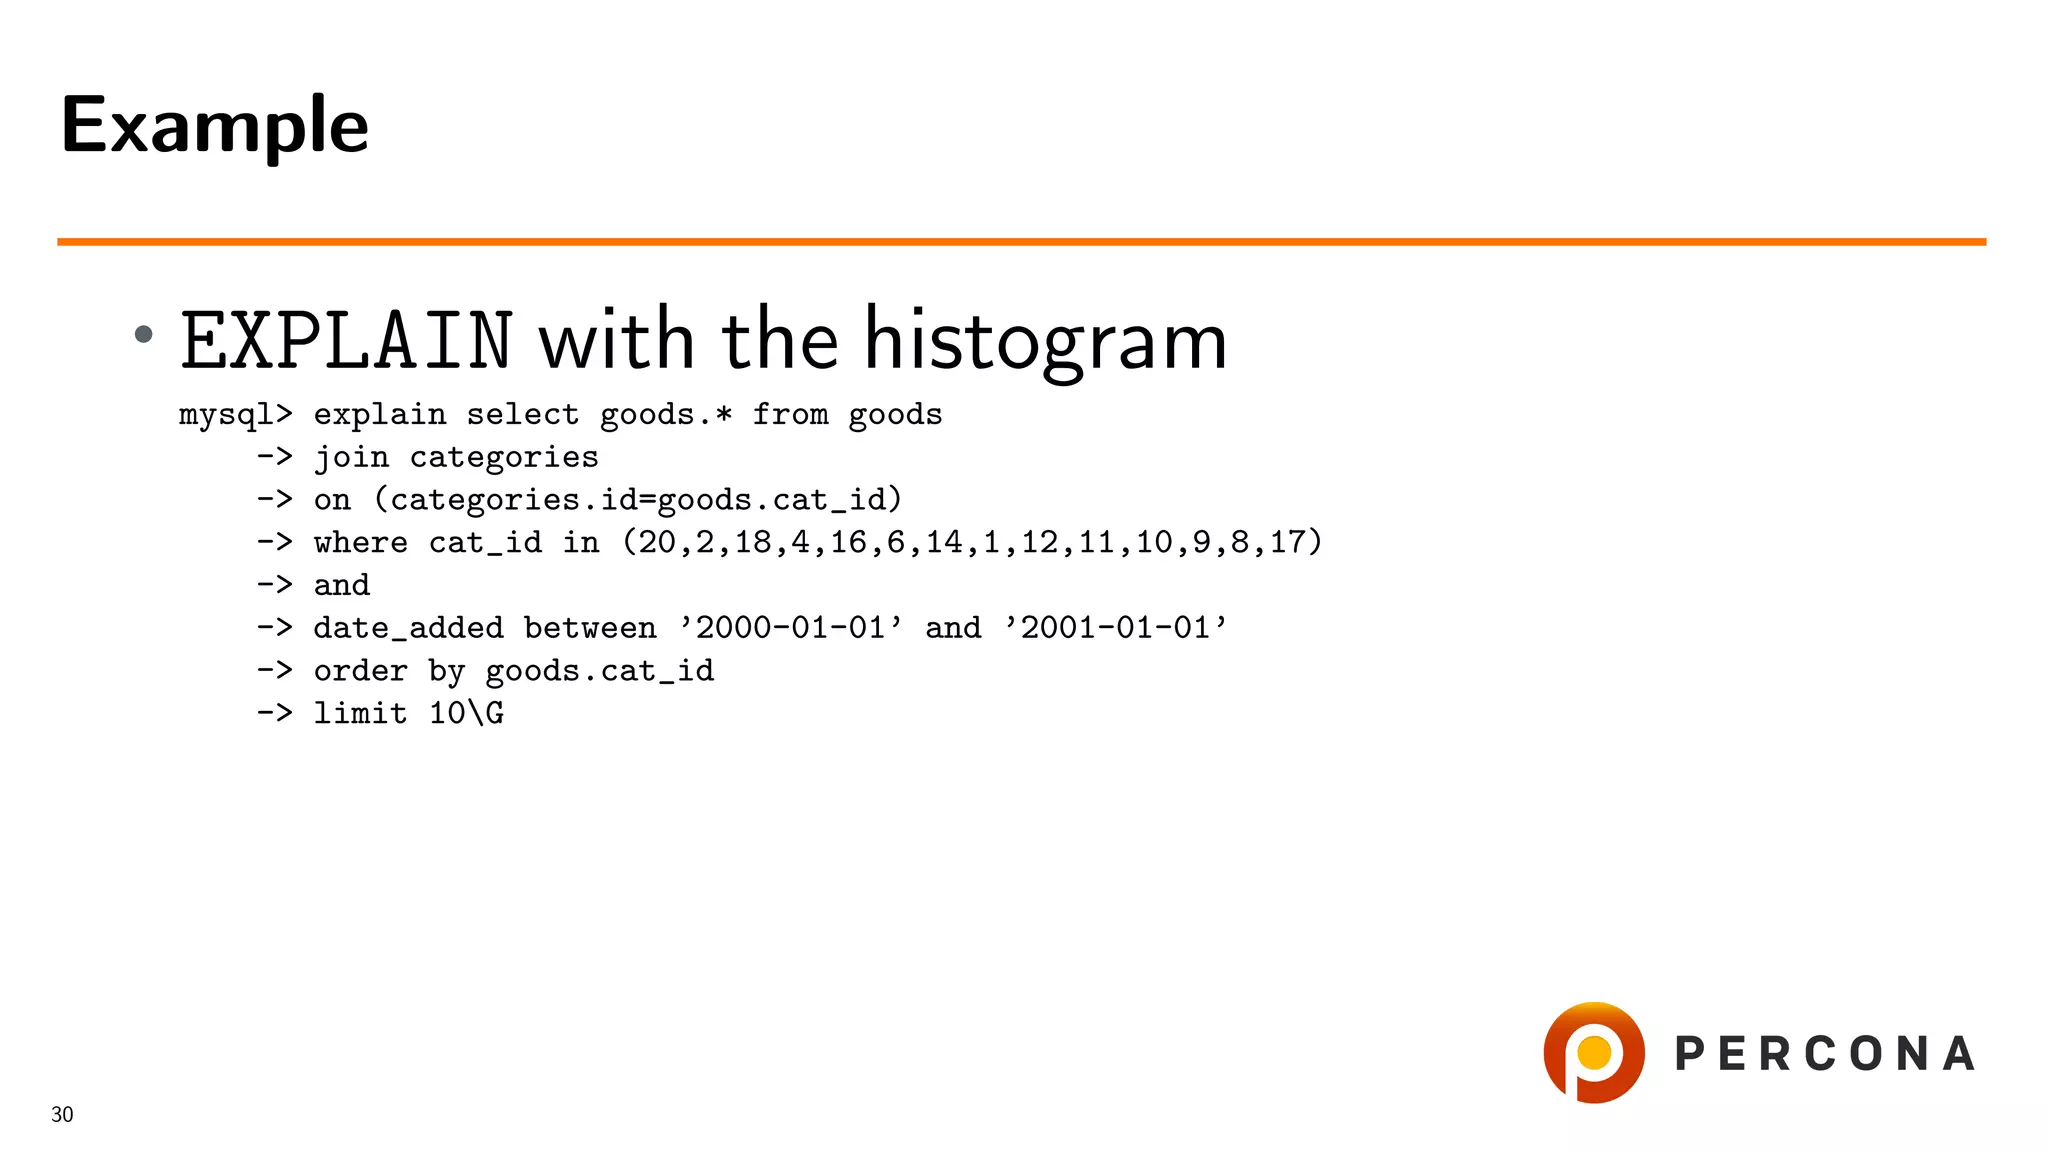
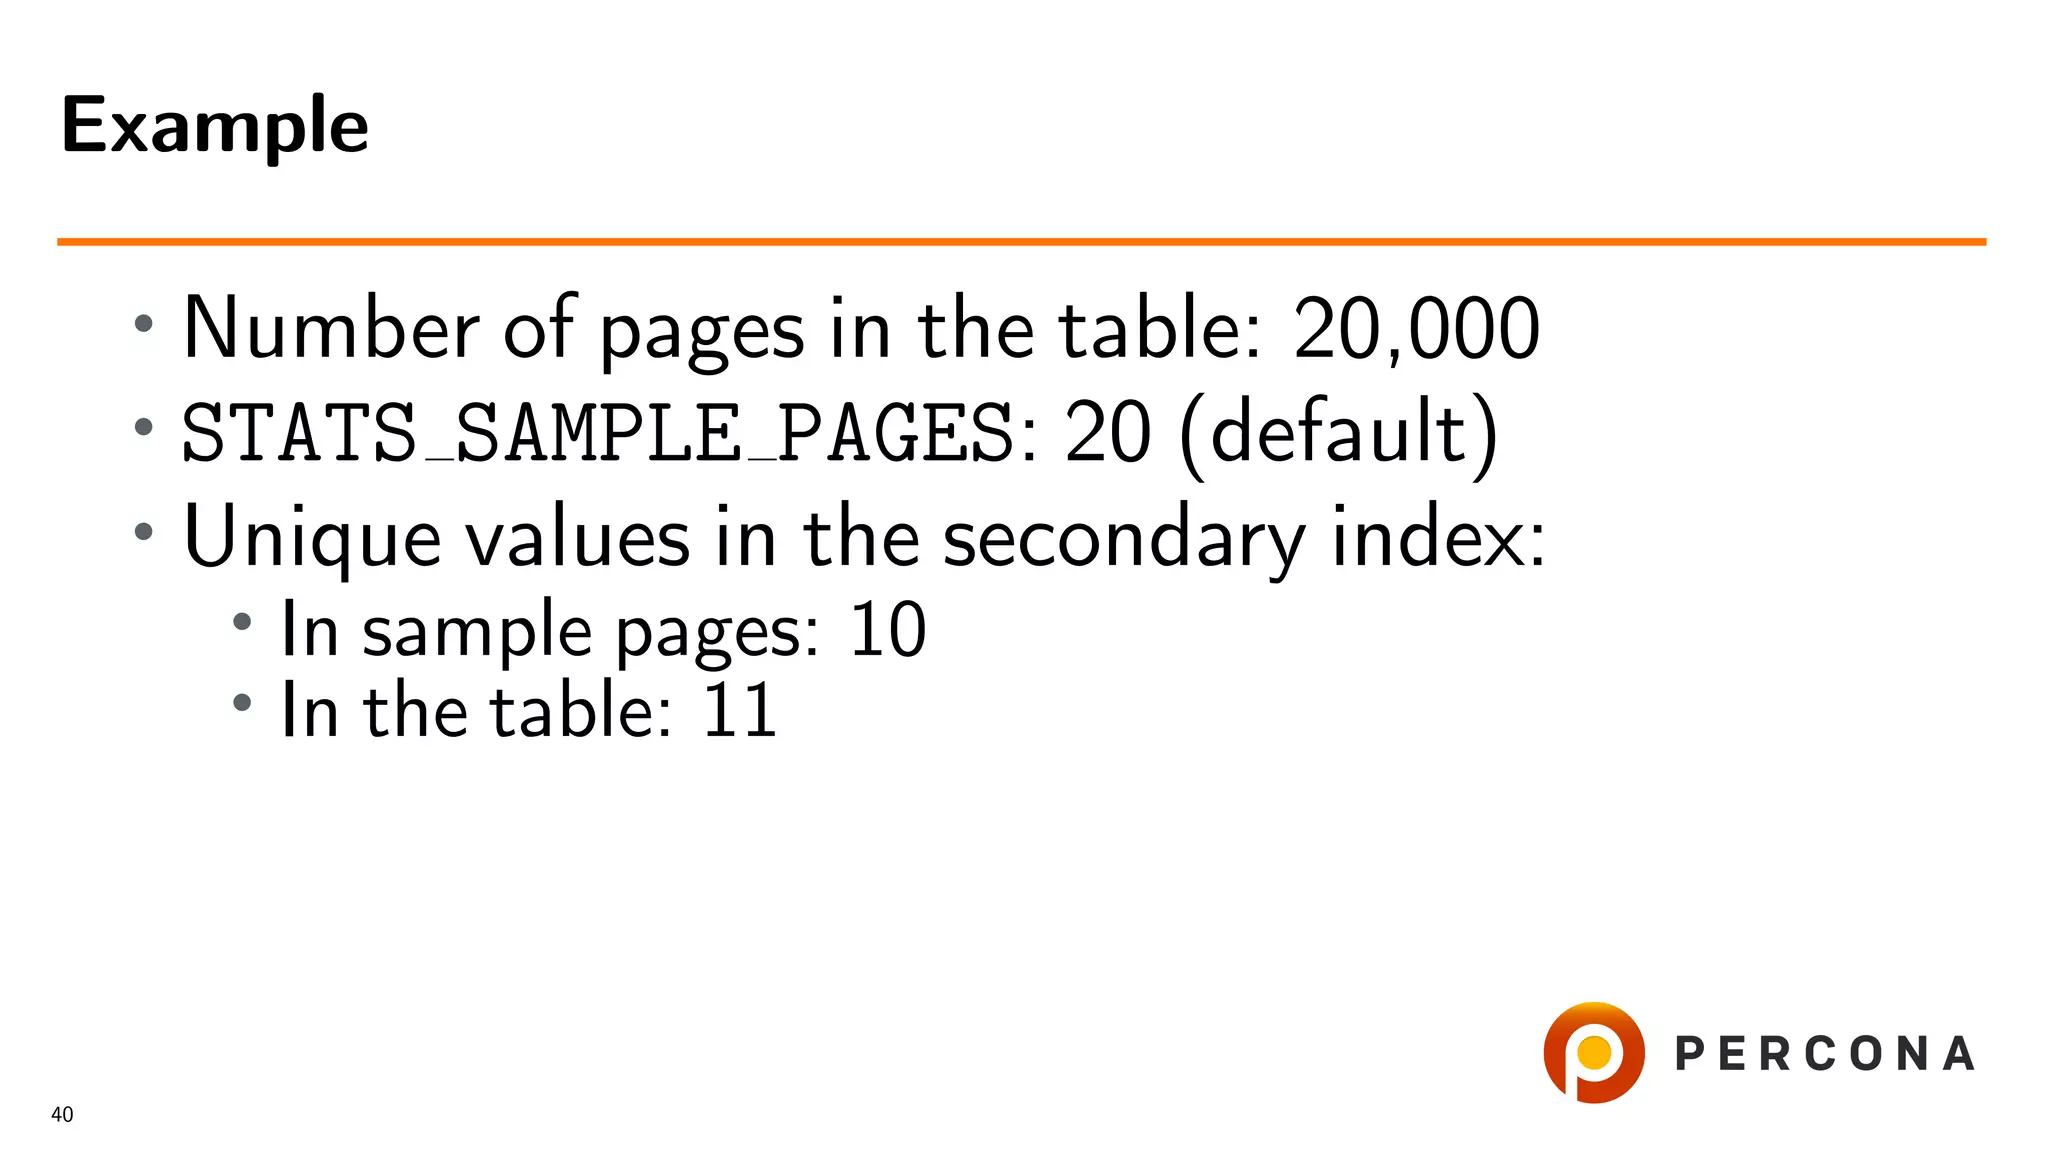
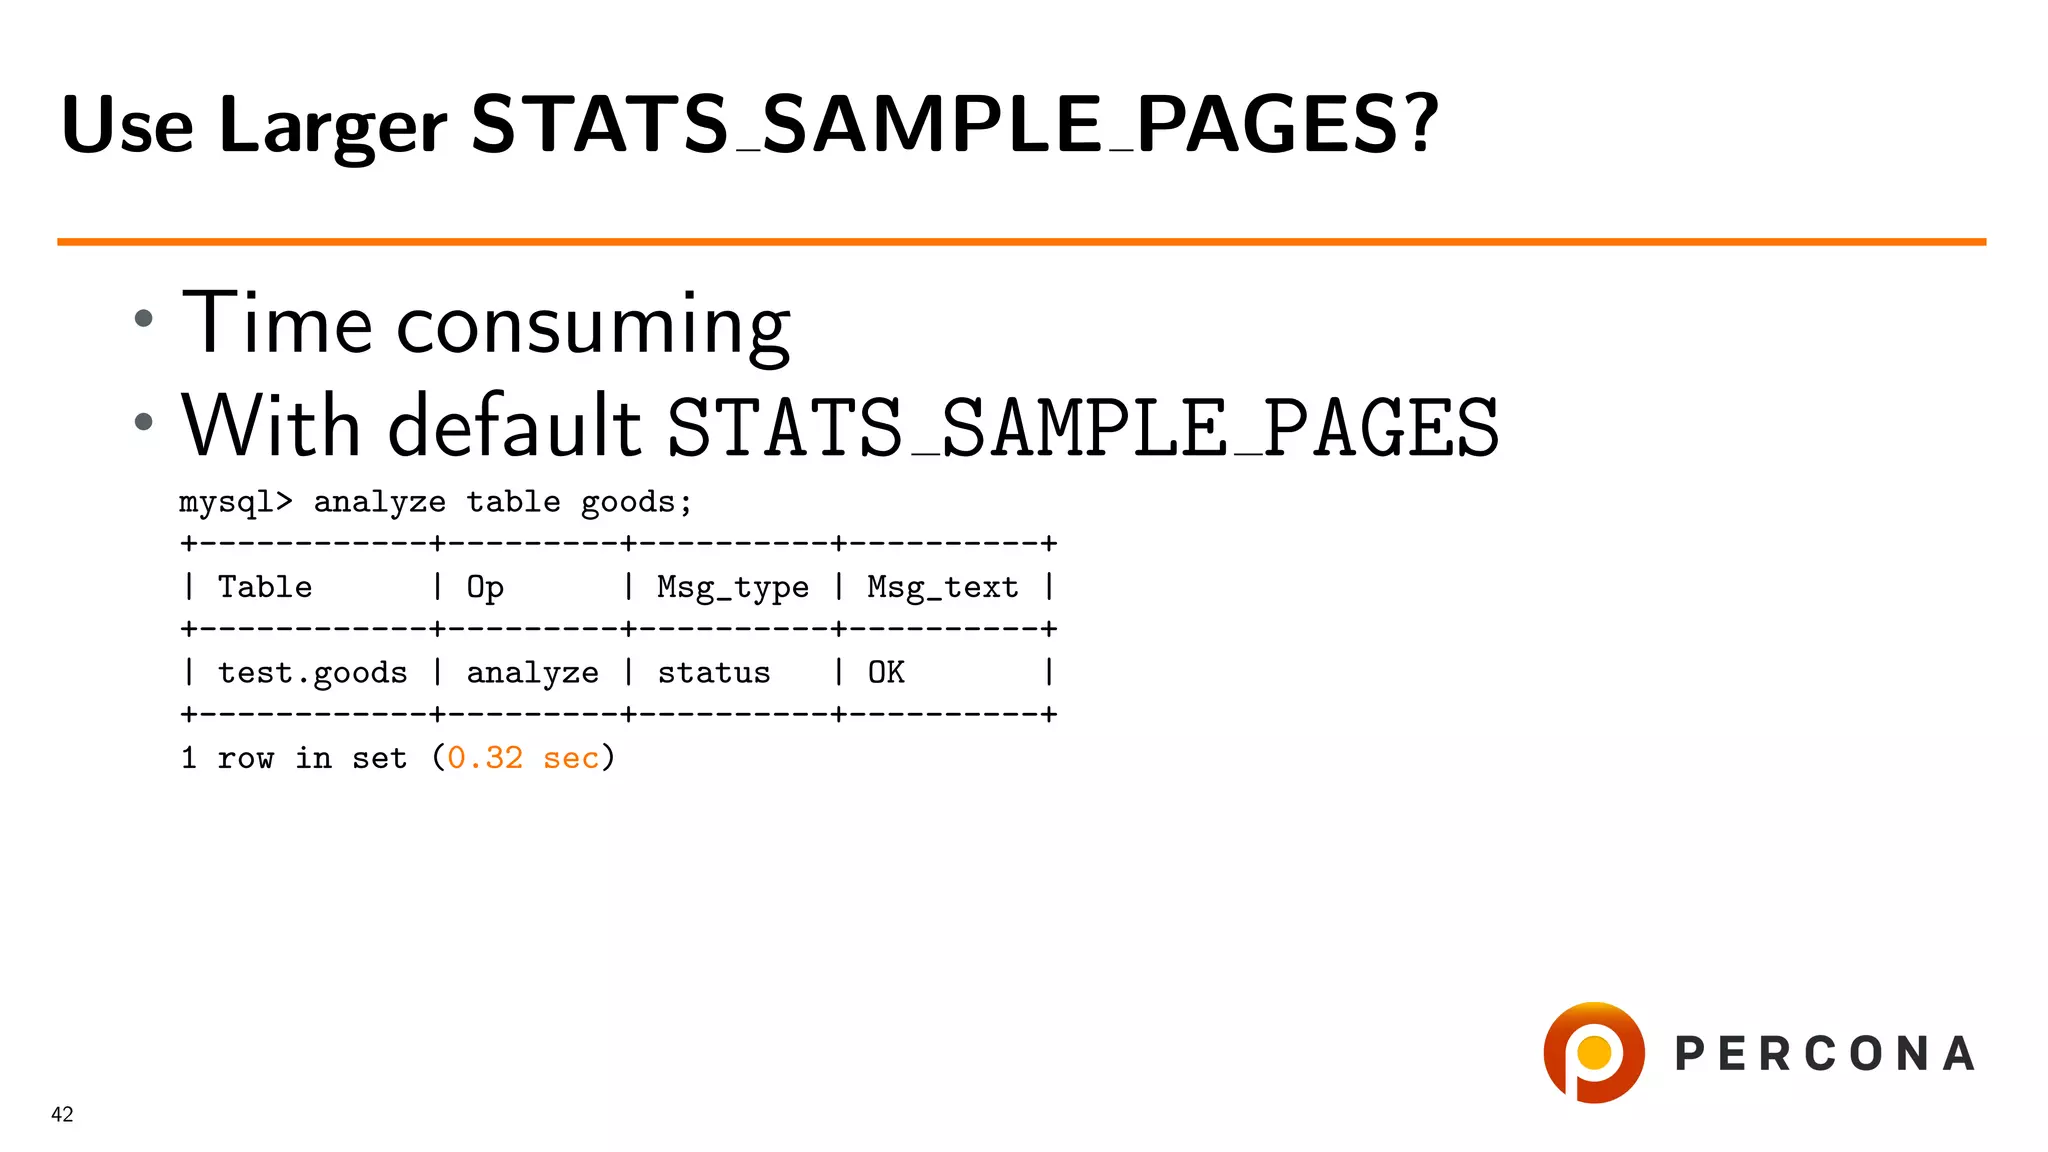
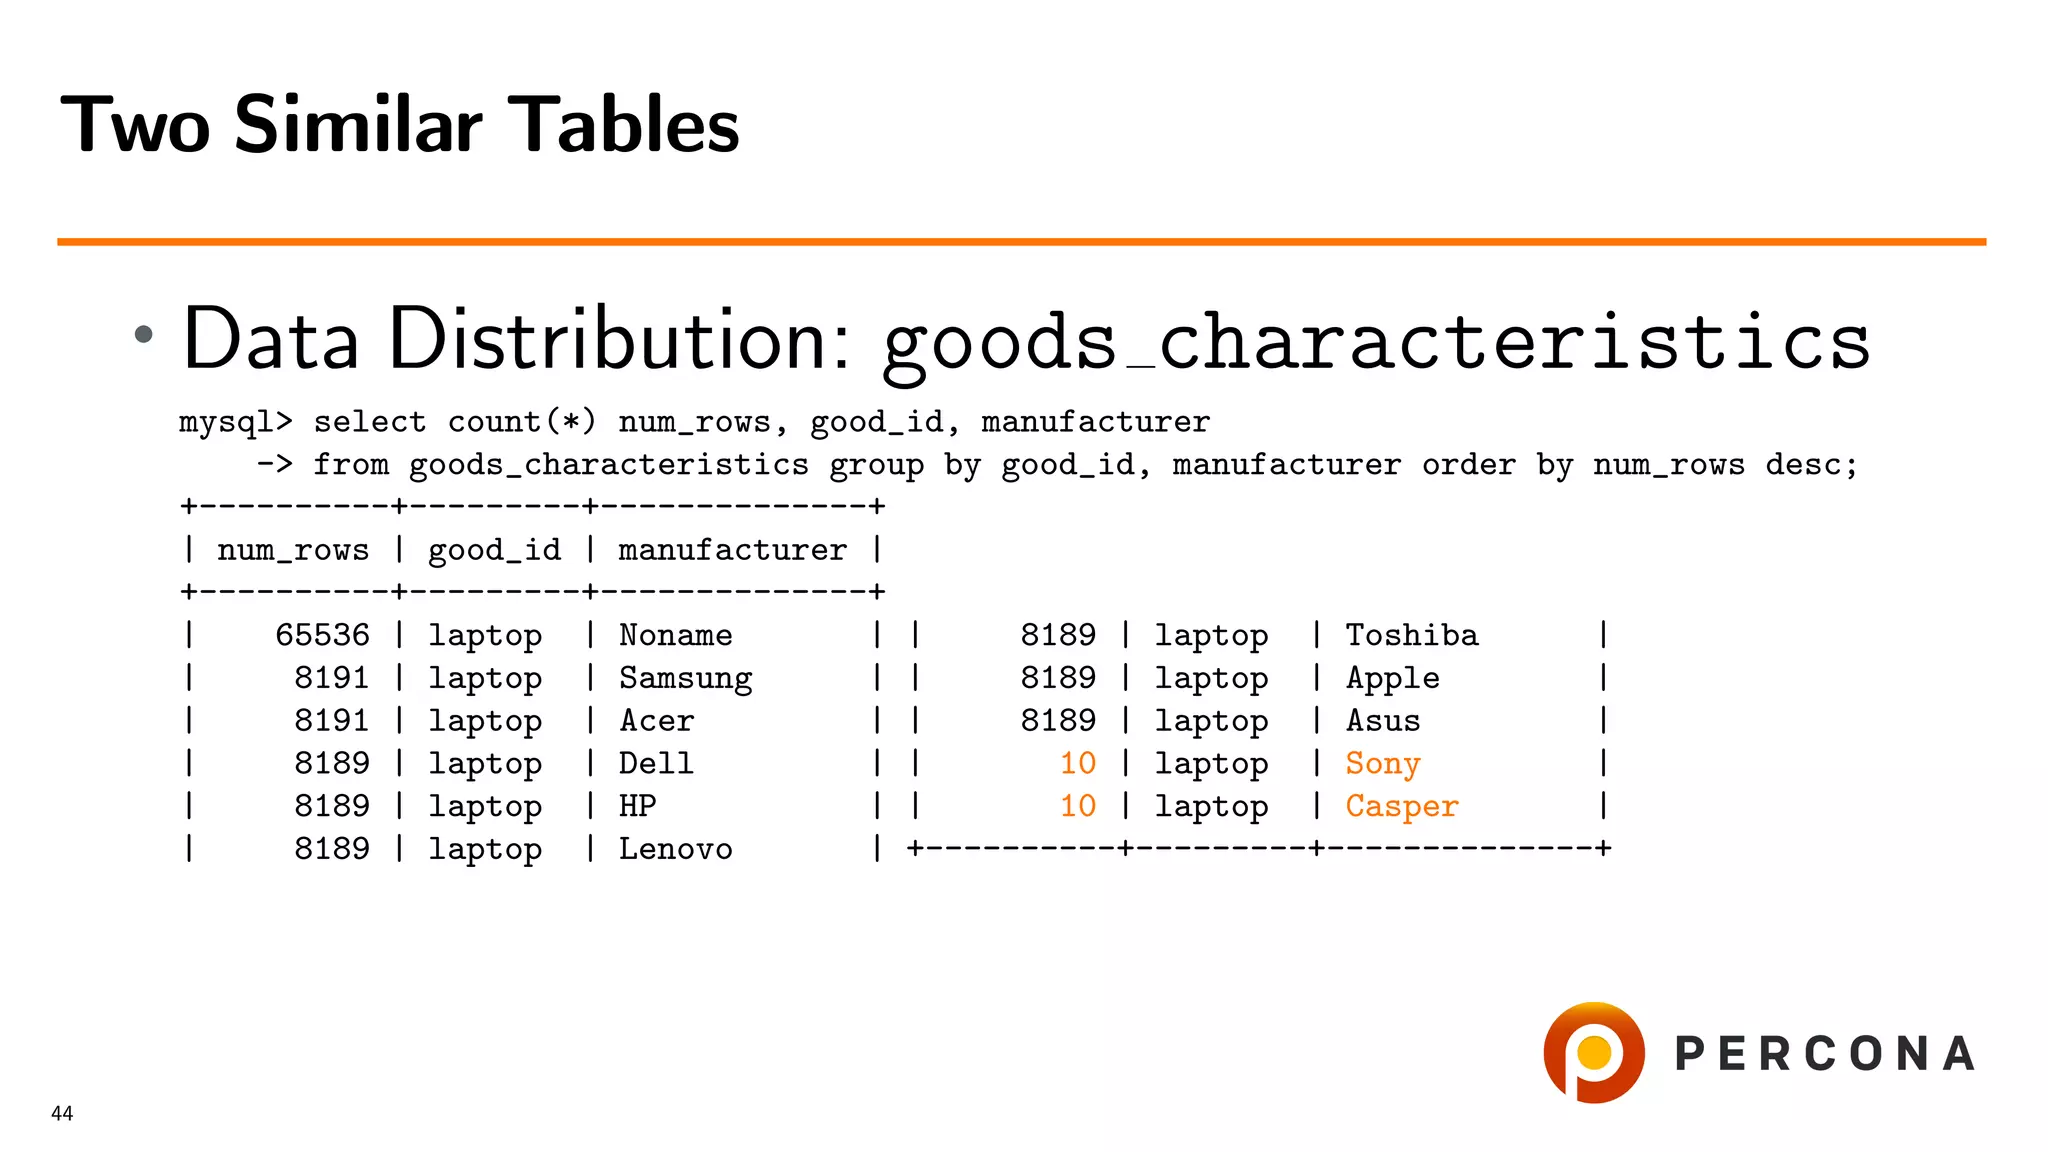
This document discusses the impact of histograms on optimizing MySQL queries, particularly in scenarios with varying data distributions. It highlights the challenges of maintaining accurate cardinality statistics and provides examples demonstrating performance improvements when using histograms. The presentation is based on real support cases and emphasizes the balance between index maintenance costs and query execution speed.


![Introduction into MySQL Query Tuning for Dev[Op]s](https://cdn.slidesharecdn.com/ss_thumbnails/qtdevops-210717011329-thumbnail.jpg?width=640&height=640&fit=bounds)


![Introduction to MySQL Query Tuning for Dev[Op]s](https://cdn.slidesharecdn.com/ss_thumbnails/qtdevops-191005204425-thumbnail.jpg?width=640&height=640&fit=bounds)