Download as PDF, PPTX

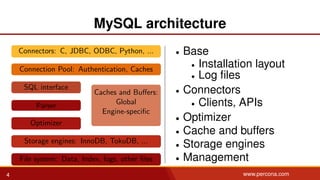

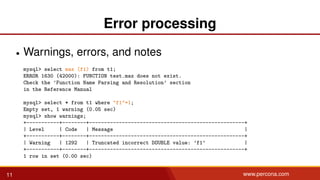
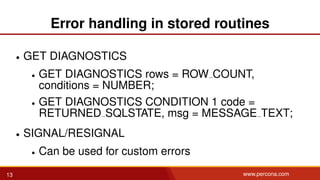
![More information about errors
[sveta@delly ~]$ perror 1630
MySQL error code 1630 (ER_FUNC_INEXISTENT_NAME_COLLISION):
FUNCTION %s does not exist. Check the ’Function Name Parsing and Resolution’
section in the Reference Manual
[sveta@delly ~]$ perror 1292
MySQL error code 1292 (ER_TRUNCATED_WRONG_VALUE):
Truncated incorrect %.32s value: ’%.128s’
[sveta@delly ~]$ perror 2
OS error code 2: No such file or directory
[sveta@delly ~]$ perror 150
MySQL error code 150: Foreign key constraint is incorrectly formed
14 www.percona.com](https://image.slidesharecdn.com/troubleshootingmysql-151102184013-lva1-app6891/85/Basic-MySQL-Troubleshooting-for-Oracle-Database-Administrators-14-320.jpg)
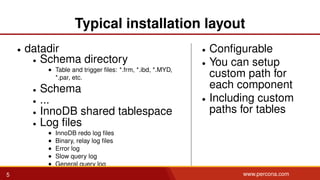
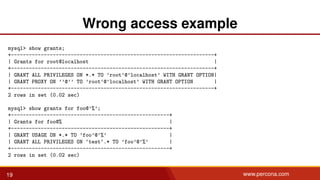
![Wrong access checklist
• SHOW GRANTS [FOR user@host]
• Grant tables
• mysql.db
• mysql.tables priv
• mysql.columns priv
• mysql.procs priv
• mysql.proxies priv
• SELECT USER(), CURRENT USER()
18 www.percona.com](https://image.slidesharecdn.com/troubleshootingmysql-151102184013-lva1-app6891/85/Basic-MySQL-Troubleshooting-for-Oracle-Database-Administrators-18-320.jpg)
![System Variables: how to set
• SET [GLOBAL] var name = NEW VAL
• Command-line option
• Configuration file
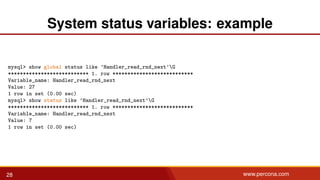
• In default location
• Specified by option –defaults-file
24 www.percona.com](https://image.slidesharecdn.com/troubleshootingmysql-151102184013-lva1-app6891/85/Basic-MySQL-Troubleshooting-for-Oracle-Database-Administrators-25-320.jpg)
![System variables: control before 5.7
• SHOW [GLOBAL] STATUS
• Tables in Information Schema
• GLOBAL ,SESSION VARIABLES
• GLOBAL ,SESSION STATUS
• GLOBAL
• Since server start
• SESSION
• For operations in current session
• Can be reset
• FLUSH STATUS
27 www.percona.com](https://image.slidesharecdn.com/troubleshootingmysql-151102184013-lva1-app6891/85/Basic-MySQL-Troubleshooting-for-Oracle-Database-Administrators-28-320.jpg)
![System variables: best practices
• Record currently used variables
• SHOW [GLOBAL] VARIABLES
• Make change dynamically if possible
• SET [GLOBAL] var name=NEW VAL
• Test in one session first
• Then change global variable
• Change configuration file after you are happy with
results
31 www.percona.com](https://image.slidesharecdn.com/troubleshootingmysql-151102184013-lva1-app6891/85/Basic-MySQL-Troubleshooting-for-Oracle-Database-Administrators-32-320.jpg)
![When affecting option is not known
• Record currently used variables
• SHOW [GLOBAL] VARIABLES
• Start mysqld with option –no-defaults
• This option must be first one!
• Check if problem is solved
• Change variable values one-by-one until you find one
which leads to the problem
32 www.percona.com](https://image.slidesharecdn.com/troubleshootingmysql-151102184013-lva1-app6891/85/Basic-MySQL-Troubleshooting-for-Oracle-Database-Administrators-33-320.jpg)
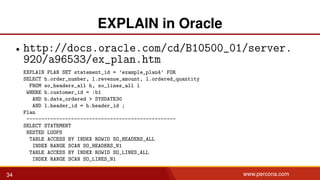
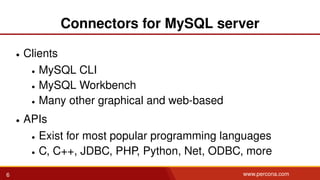
![EXPLAIN FORMAT=JSON
mysql> EXPLAIN FORMAT=JSON SELECT user, host FROM mysql.userG
*************************** 1. row ***************************
EXPLAIN: {
"query_block": {
"select_id": 1,
"table": {
"table_name": "user",
"access_type": "index",
"key": "PRIMARY",
"used_key_parts": [
"Host",
"User"
],
"key_length": "228",
"rows": 8,
"filtered": 100,
"using_index": true
}
}
}
37 www.percona.com](https://image.slidesharecdn.com/troubleshootingmysql-151102184013-lva1-app6891/85/Basic-MySQL-Troubleshooting-for-Oracle-Database-Administrators-38-320.jpg)

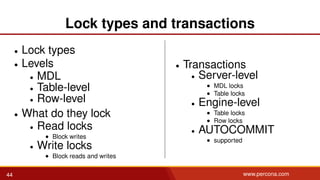
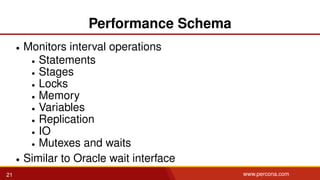
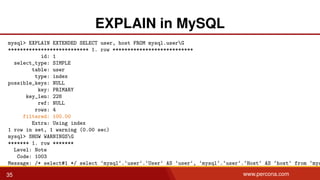
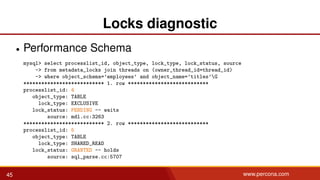
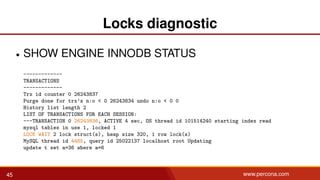
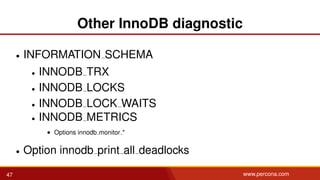
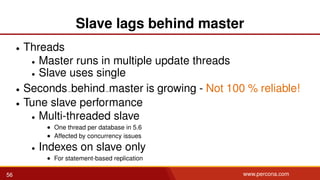
![Locks diagnostic
• SHOW [FULL] PROCESSLIST
• SHOW ENGINE INNODB STATUS
• INFORMATION SCHEMA
• PROCESSLIST
• InnoDB table
• Performance Schema
• METADATA LOCKS
• TABLE HANDLES
• EVENTS TRANSACTIONS *
• Both server-level and engine-level
• Contain GTID information
45 www.percona.com](https://image.slidesharecdn.com/troubleshootingmysql-151102184013-lva1-app6891/85/Basic-MySQL-Troubleshooting-for-Oracle-Database-Administrators-50-320.jpg)
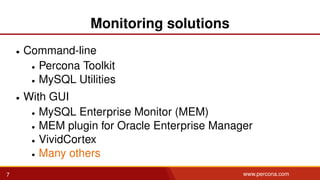
![Locks diagnostic
• SHOW [FULL] PROCESSLIST
mysql> select id, state, info from information_schema.processlistG
******************** 1. row ********************
id: 5
state:
info: NULL
******************** 2. row ********************
id: 4
state: Waiting for table metadata lock
info: alter table titles add column f1 int
******************** 3. row ********************
id: 2
state: executing
info: select id, state, info from information_schema.processlist
45 www.percona.com](https://image.slidesharecdn.com/troubleshootingmysql-151102184013-lva1-app6891/85/Basic-MySQL-Troubleshooting-for-Oracle-Database-Administrators-51-320.jpg)


This document provides an overview of basic MySQL troubleshooting techniques for Oracle database administrators. It covers MySQL server architecture including connectors, clients, APIs, storage engines, and plugins. It then discusses basic troubleshooting techniques such as error processing, access privileges, and using system variables, performance schema, and EXPLAIN to analyze query execution plans. The document is intended to help Oracle DBAs understand fundamental aspects of MySQL administration.


![Introduction to MySQL Query Tuning for Dev[Op]s](https://cdn.slidesharecdn.com/ss_thumbnails/qtdevops-191005204425-thumbnail.jpg?width=640&height=640&fit=bounds)

![Introduction into MySQL Query Tuning for Dev[Op]s](https://cdn.slidesharecdn.com/ss_thumbnails/qtdevops-210717011329-thumbnail.jpg?width=640&height=640&fit=bounds)