Download as PDF, PPTX

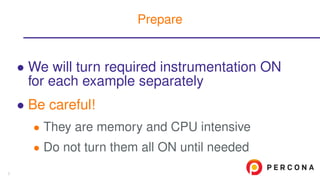


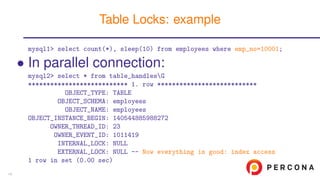


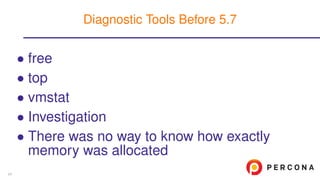


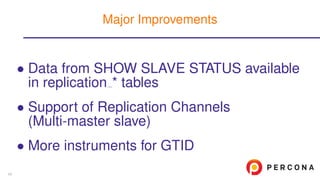
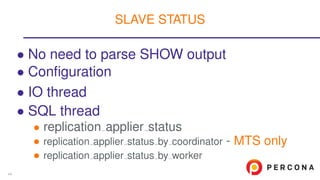
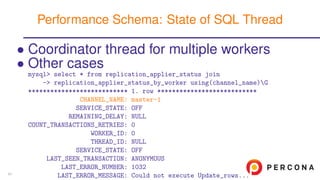
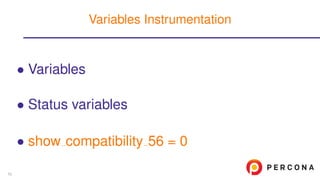
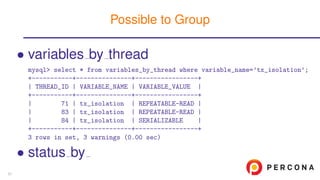
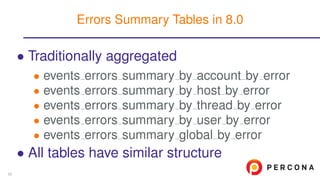
![• Variables
• Status variables
• global status
• session status
• status by [account|host|thread|user]
Variables Instrumentation
53](https://image.slidesharecdn.com/pstutorial-2017-170503213752/85/MySQL-Performance-Schema-in-Action-71-320.jpg)
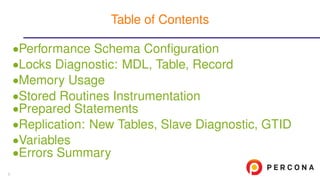
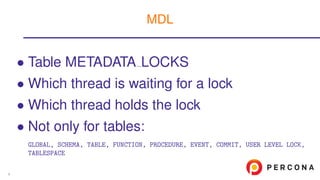
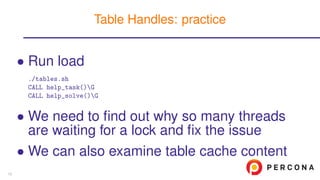
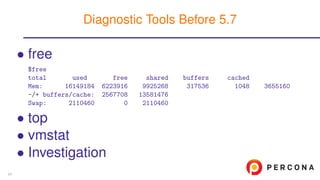
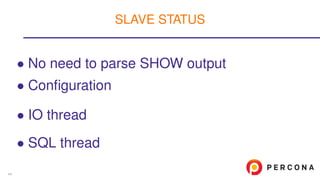
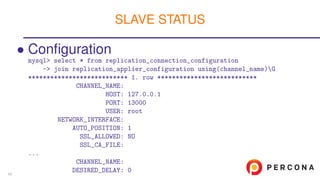
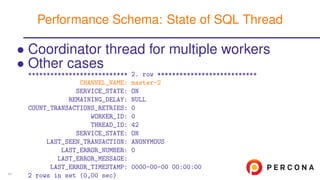
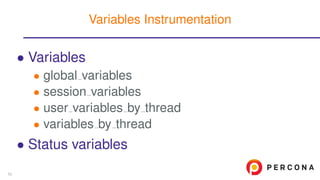
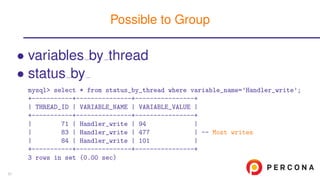
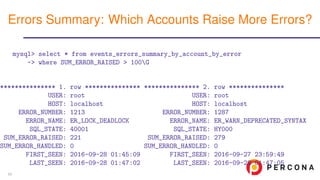
![• Same information which is in
• SHOW [GLOBAL] STATUS
• I S.GLOBAL VARIABLES
Deprecated in 5.7
Removed in 8.0.1
• I S.SESSION VARIABLES
Deprecated in 5.7
Removed in 8.0.1
• Helps to watch session variables changes
Global and Session Variables
54](https://image.slidesharecdn.com/pstutorial-2017-170503213752/85/MySQL-Performance-Schema-in-Action-72-320.jpg)
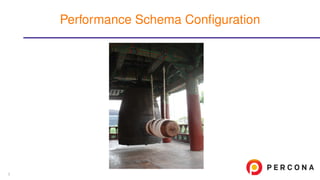
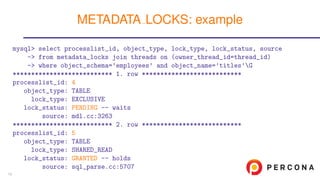
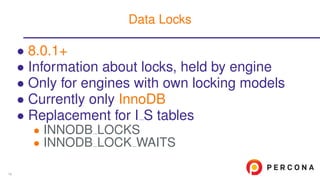
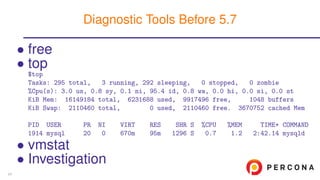
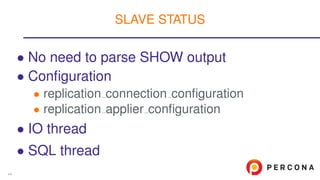
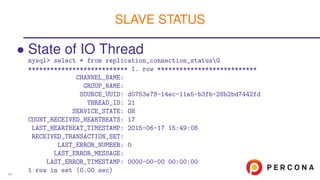
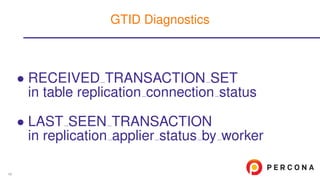
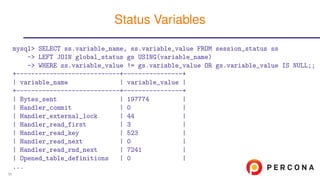
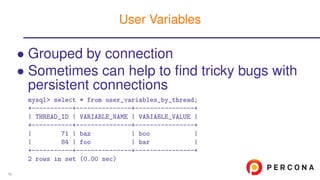
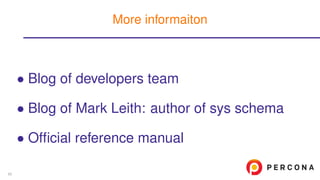
![• Same information which is in
• SHOW [GLOBAL] STATUS
• I S.GLOBAL STATUS
Deprecated in 5.7
Removed in 8.0.1
• I S.SESSION STATUS
Deprecated in 5.7
Removed in 8.0.1
Status Variables
55](https://image.slidesharecdn.com/pstutorial-2017-170503213752/85/MySQL-Performance-Schema-in-Action-73-320.jpg)


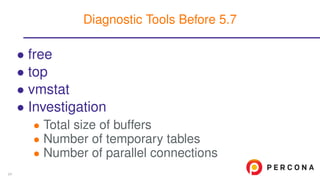
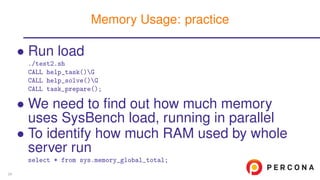
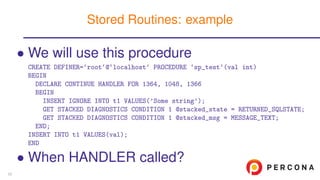
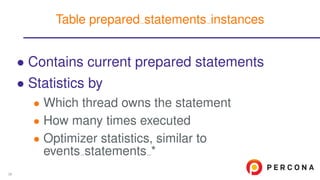
New features in Performance Schema 5.7 include instrumentation for locks, memory usage, stored routines, and prepared statements. This provides concise insight into what is causing issues like long wait times, high memory usage, or inconsistent stored routine performance. Administrators can now quickly diagnose these types of issues using the additional visibility provided by the Performance Schema.


![Introduction to MySQL Query Tuning for Dev[Op]s](https://cdn.slidesharecdn.com/ss_thumbnails/qtdevops-191005204425-thumbnail.jpg?width=640&height=640&fit=bounds)


![Introduction into MySQL Query Tuning for Dev[Op]s](https://cdn.slidesharecdn.com/ss_thumbnails/qtdevops-210717011329-thumbnail.jpg?width=640&height=640&fit=bounds)