Download as PDF, PPTX


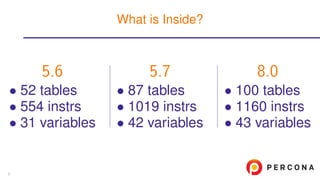
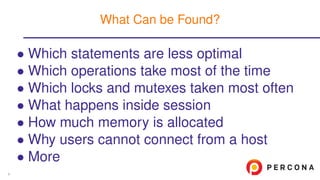
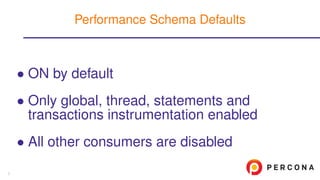

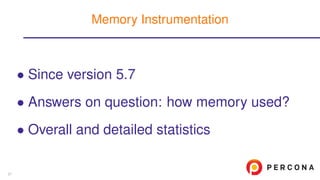
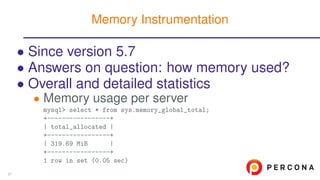
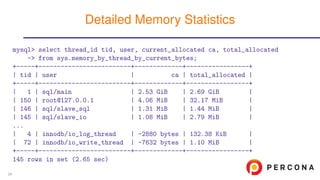

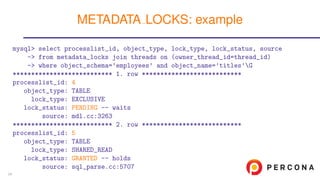
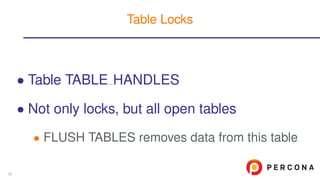
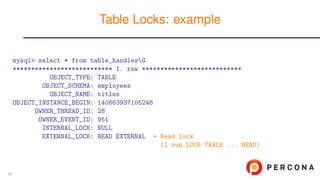
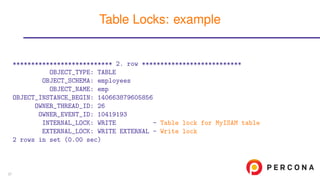


The document discusses the MySQL Performance Schema for troubleshooting, detailing its overview, configuration improvements, and various diagnostic features introduced in versions 5.7 and 8.0. It covers topics such as statement instrumentation, memory usage analysis, locks diagnostics, and connection management, providing examples and queries to assist users in understanding performance metrics. The content is aimed at helping MySQL users optimize performance and troubleshoot issues effectively.


![Introduction to MySQL Query Tuning for Dev[Op]s](https://cdn.slidesharecdn.com/ss_thumbnails/qtdevops-191005204425-thumbnail.jpg?width=640&height=640&fit=bounds)


![Introduction into MySQL Query Tuning for Dev[Op]s](https://cdn.slidesharecdn.com/ss_thumbnails/qtdevops-210717011329-thumbnail.jpg?width=640&height=640&fit=bounds)


![20260201 [FOSDEM] gomodjail - library sandboxing for Go modules.pdf](https://cdn.slidesharecdn.com/ss_thumbnails/20260201fosdemgomodjail-librarysandboxingforgomodules-260201225659-76609ec4-thumbnail.jpg?width=640&height=640&fit=bounds)