

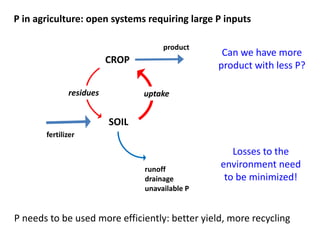
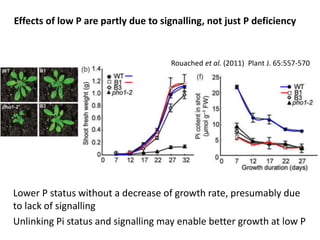
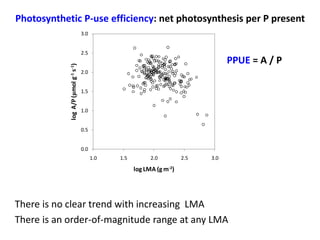
![Photosynthetic P-use efficiency = net photosynthesis per P present
Global patterns using the “leaf economics spectrum” dataset
(Wright et al. (2004) Nature 428:821-827)
1.0
0.5
0.0
-0.5
-1.0
-1.5
1.0 1.5 2.0 2.5 3.0 3.5
log [P] (mg g-1)
log LMA (g m-2)
3.0
2.5
2.0
1.5
1.0
0.5
0.0
1.0 1.5 2.0 2.5 3.0
log Amass (nmol g-1 s-1)
Higher Leaf Dry Mass per Area (LMA): thicker, denser leaves
Longer leaf lifespan
log LMA (g m-2)
P concentration Photosynthesis](https://image.slidesharecdn.com/veneklaaspue2014-140923135409-phpapp02/85/Opportunities-for-improving-phosphorus-use-efficiency-in-crop-plants-18-320.jpg)
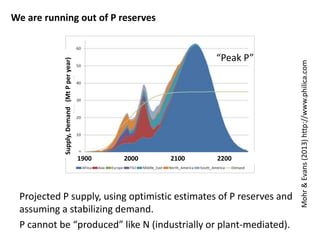
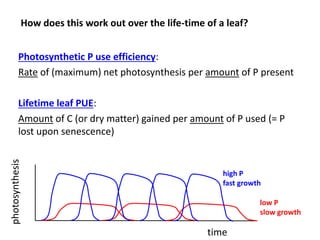
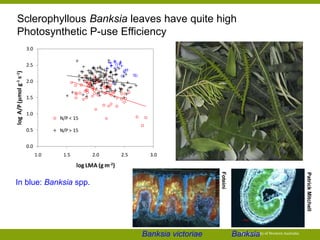
![Some of the variation in A/P at a given LMA is related with [N]
A/P (μmol g-1 s-1)
Leaf N/P > 15
“P-limited”
129.4
Leaf N/P < 15
“N-limited”
59.3
3.0
2.5
2.0
1.5
1.0
0.5
0.0
N/P < 15
N/P > 15
1.0 1.5 2.0 2.5 3.0
log A/P (μmol g-1 s-1)
log LMA (g m-2)
Much higher Photosynthetic P-use Efficiency in “P-limited” than “N-limited”
plants
Implication for agronomy: plant production is most efficient when all
resources are used optimally at all times](https://image.slidesharecdn.com/veneklaaspue2014-140923135409-phpapp02/85/Opportunities-for-improving-phosphorus-use-efficiency-in-crop-plants-20-320.jpg)
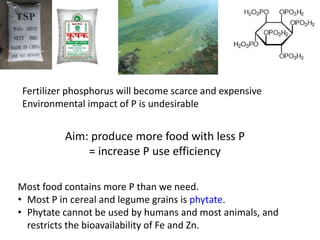
![An extreme leaf-root contrast in PUE in a low-P environment
Trait Banksia leaf Banksia cluster root
[P], mg g-1 0.2 1
Life span, yr 3 0.1
P remobilisation, % 80 90
P cost, mg g-1 yr-1 0.01 1.0
P cost per unit standing crop per year may be 100X more for cluster roots than leaves](https://image.slidesharecdn.com/veneklaaspue2014-140923135409-phpapp02/85/Opportunities-for-improving-phosphorus-use-efficiency-in-crop-plants-24-320.jpg)
![P recycling in the vegetative plant
60
50
40
30
20
10
0
remobilisation = 80%
0 10 20 30
% P from remobilisation
time
current
cumulative
Remobilization only starts
contributing to P economy
when there is senescing
tissue
Even with constant growth rate, senescence, [P] and remobilization:
• % P derived from remobilization increases only slowly over time
• total % P derived from remobilization for vegetative growth is
considerably less than the % P remobilized from senescing biomass](https://image.slidesharecdn.com/veneklaaspue2014-140923135409-phpapp02/85/Opportunities-for-improving-phosphorus-use-efficiency-in-crop-plants-26-320.jpg)

![[P] in grain has already been reduced through selection
0.6
0.4
0.2
0
Domestication of wheat Historic wheat cultivars
diploid tetraploid hexaploid
P concentration in grain (%)
high P
low P
Calderini et al. (1995) Ann. Bot. 76:315-322
Batten et al. (1986) Ann. Bot. 58:49-59
Mainly due to ‘dilution’ (more starch).
Further progress may be possible; physiological limits are unknown
but links with N and C are likely.](https://image.slidesharecdn.com/veneklaaspue2014-140923135409-phpapp02/85/Opportunities-for-improving-phosphorus-use-efficiency-in-crop-plants-31-320.jpg)
![“Ideotype” for efficient use of P
Fast and early P uptake and efficient internal recycling of P
• P will be in plant for a longer time to be used
productively
High photosynthesis at low P
• No excess P in tissues (including roots and stems)
• More productive use of P
Low grain P • More P returns to the soil
• Less P is lost to the environment
• Improved nutritional value
[Need to watch possible early vigour penalty]](https://image.slidesharecdn.com/veneklaaspue2014-140923135409-phpapp02/85/Opportunities-for-improving-phosphorus-use-efficiency-in-crop-plants-32-320.jpg)

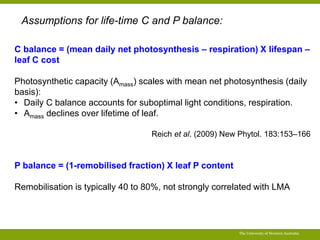
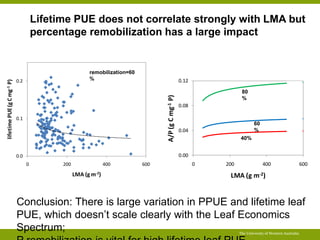
![PUE over the life-time of a leaf (in the context of
the Leaf Economic Spectrum)
C balance: High-LMA leaves live longer but have lower
rates of photosynthesis …
P balance: High-LMA leaves have lower [P] and may
have higher remobilisation …
The University of Western Australia
150
100
50
0
0 100 200 300 400
LL (mo)
LMA (g m-2)
500
400
300
200
100
0
0 100 200 300 400
Amass (nmol g-1 s-1)
LMA (g m-2)
5
4
3
2
1
0
0 100 200 300 400
[P] (mg g-1)
LMA (g m-2)
Data: glopnet database – Wright et al. (2004) Nature
428:821-827](https://image.slidesharecdn.com/veneklaaspue2014-140923135409-phpapp02/85/Opportunities-for-improving-phosphorus-use-efficiency-in-crop-plants-40-320.jpg)
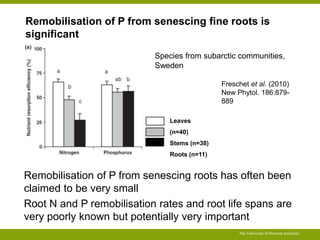
![Summary lifetime leaf PUE: comparing leaves with LMA 100 and 200 g
m-2
(P remobilisation 60%)
[P] X 0.57
lifetime P balance X 1.85
LMA 100 LMA 200
The University of Western Australia
30
20
10
0
LL X 3.3
LMA 100 LMA 200
100
50
0
Amax X 0.59
LMA 100 LMA 200
15
10
5
0
lifetime C balance X 2.01
LMA 100 LMA 200
1.5
1.0
0.5
0.0
LMA 100 LMA 200
200
150
100
50
0
0.06
0.04
0.02
0.00
lifetime PUE X 1.09
LMA 100 LMA 200
Despite large differences in morphology and physiology, PUE differs by
less than 10%](https://image.slidesharecdn.com/veneklaaspue2014-140923135409-phpapp02/85/Opportunities-for-improving-phosphorus-use-efficiency-in-crop-plants-44-320.jpg)
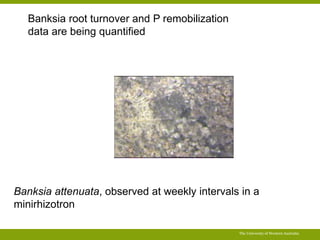
![P required to maintain biomass (e.g. mature perennial plants)
The University of Western Australia
1000
800
600
400
200
0
P
remobilisation
20%
40%
60%
80%
0 10 20 30
Annual P cost (% of P content)
Tissue lifespan (months)
No net growth – maintenance
only;
P uptake required to maintain
same amount of tissue with same
[P]](https://image.slidesharecdn.com/veneklaaspue2014-140923135409-phpapp02/85/Opportunities-for-improving-phosphorus-use-efficiency-in-crop-plants-47-320.jpg)
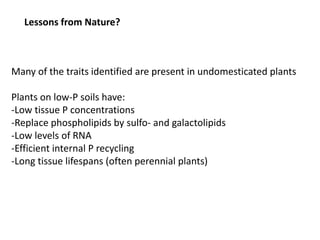

This document summarizes a presentation about opportunities to improve phosphorus-use efficiency in crop plants. It discusses how phosphorus is essential for plants but finite reserves exist, creating a need to produce more food with less phosphorus input. Various strategies are presented to improve phosphorus acquisition and utilization efficiency, such as increasing phosphorus recycling within plants and reducing phosphorus concentrations in plant tissues like leaves, roots and grain.


