Downloaded 107 times
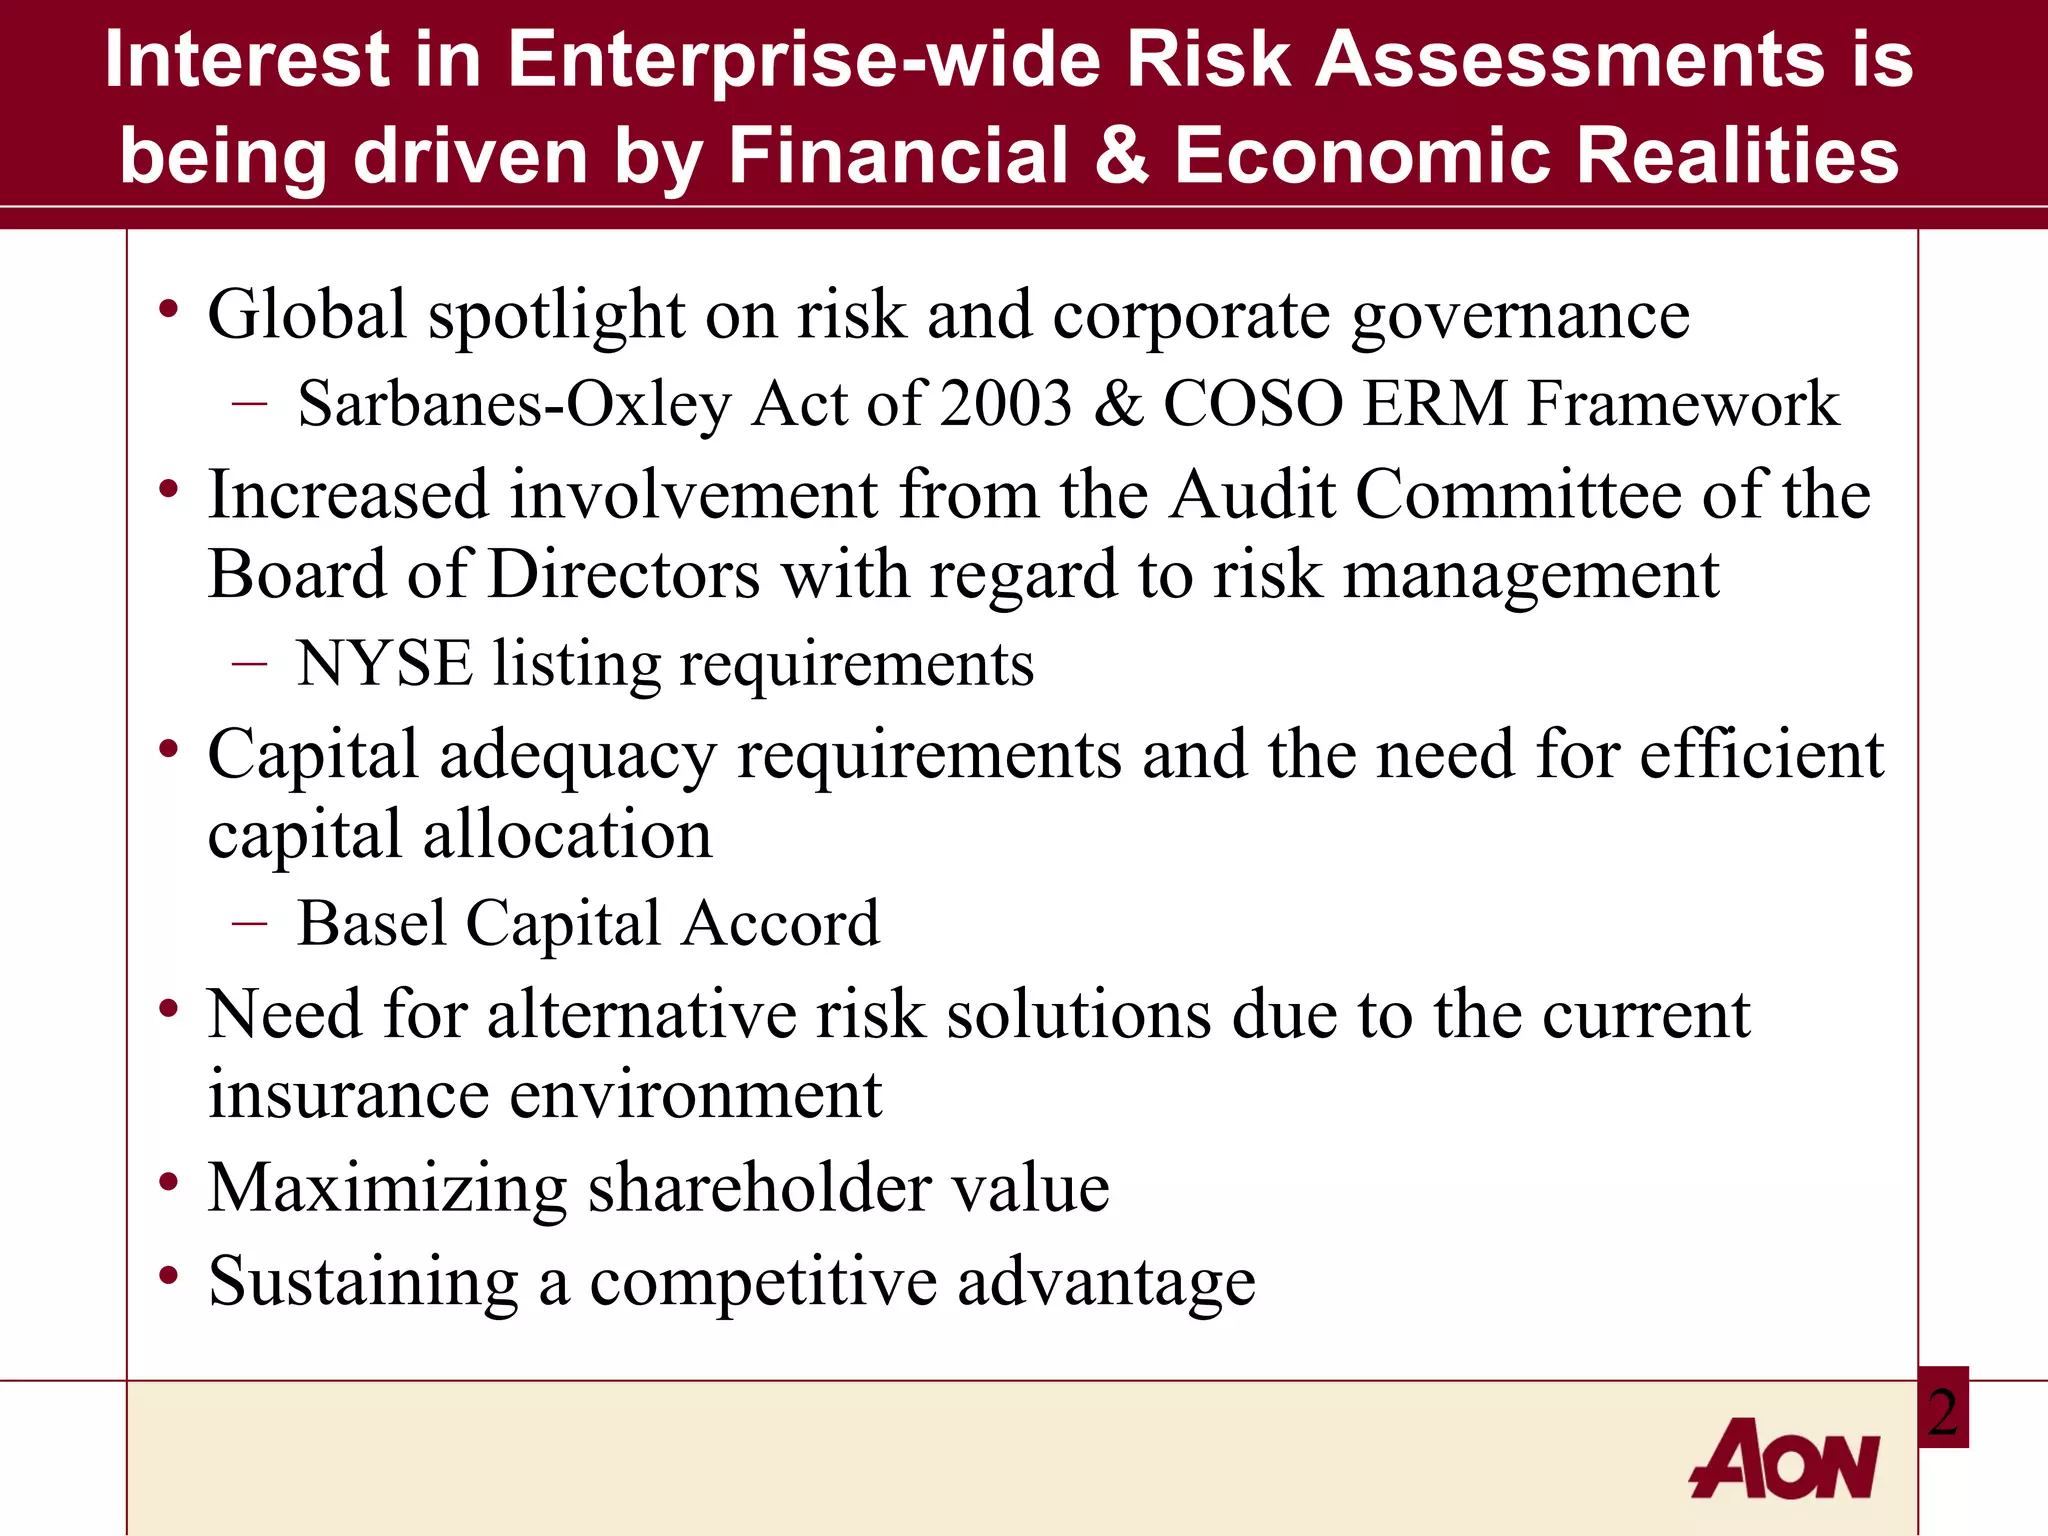
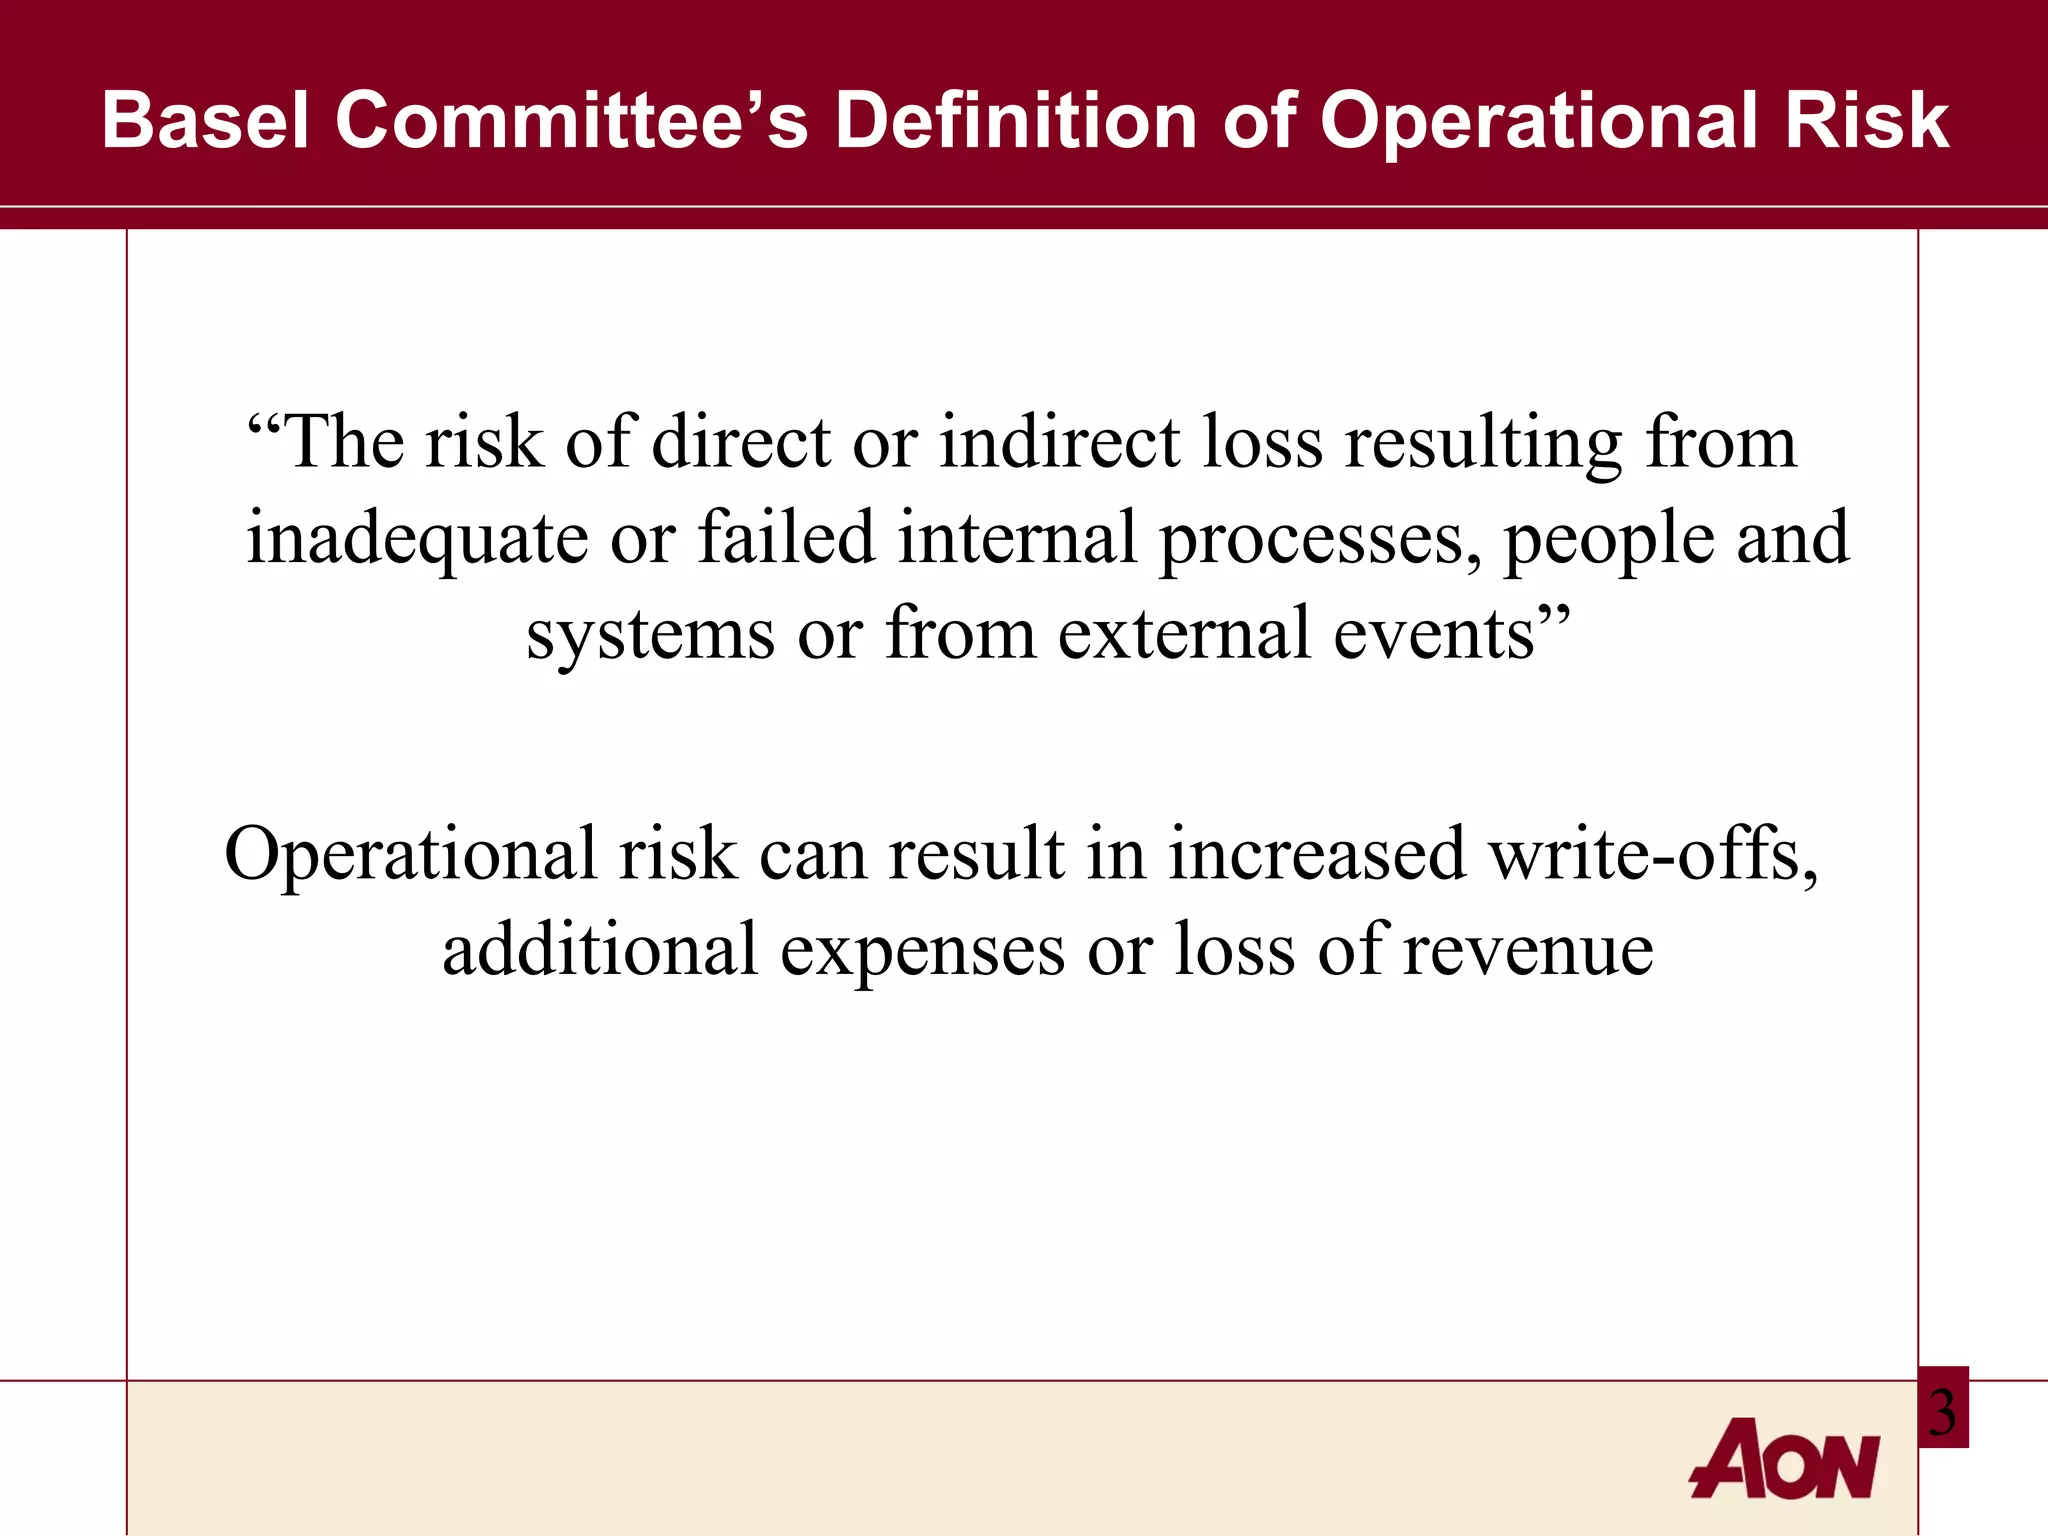
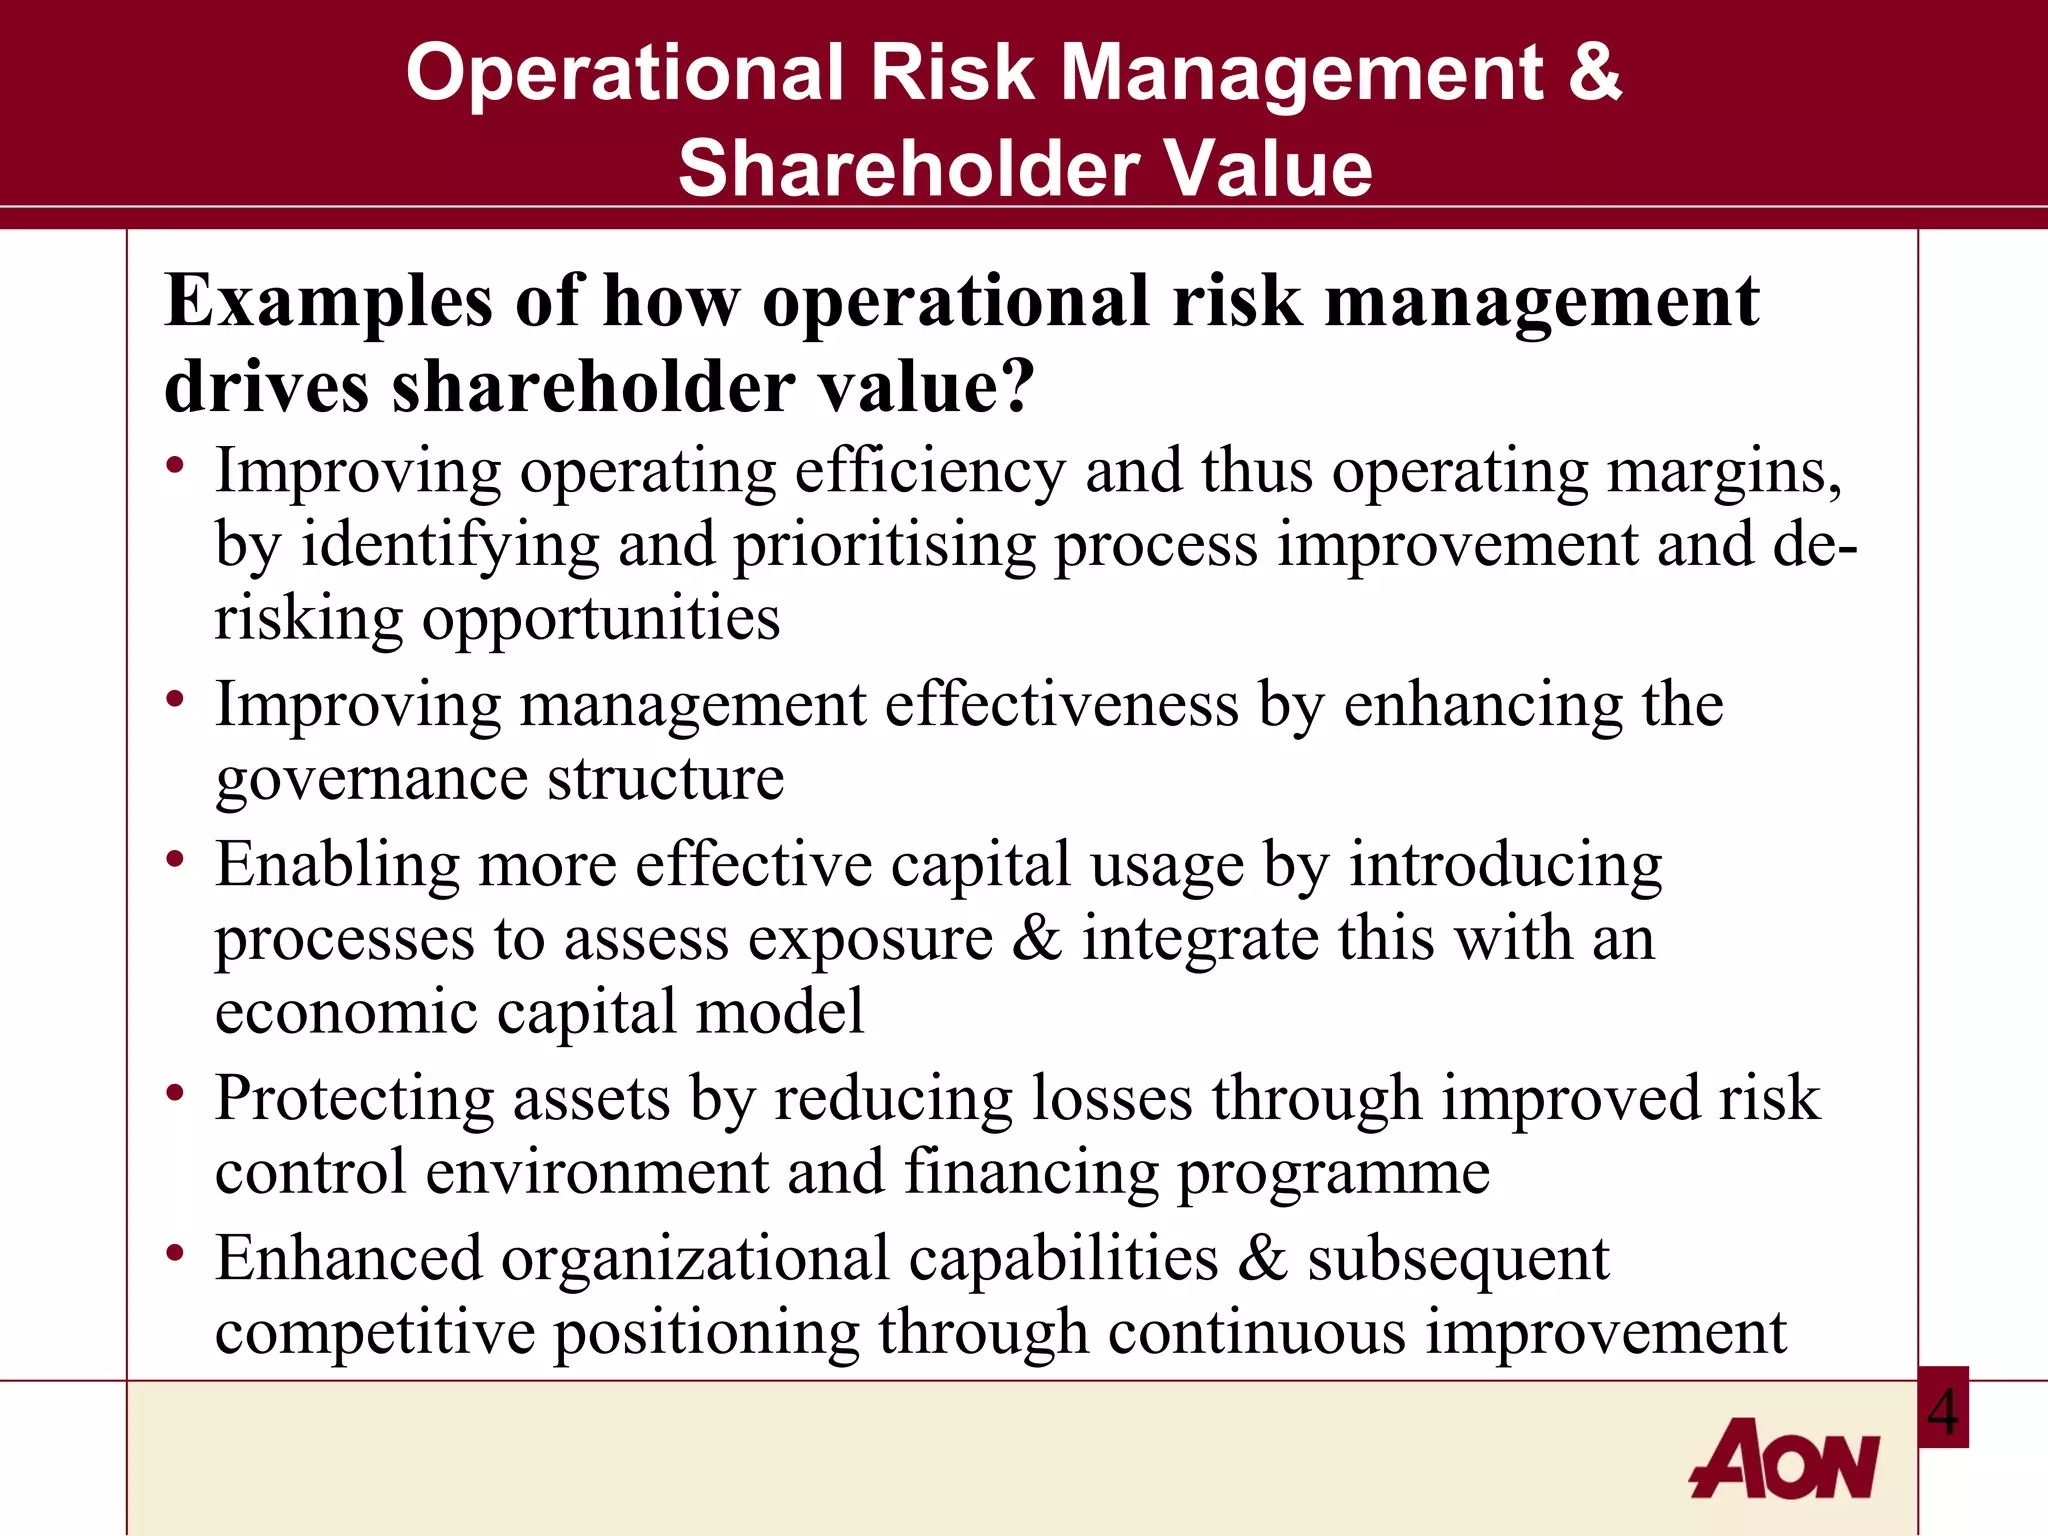
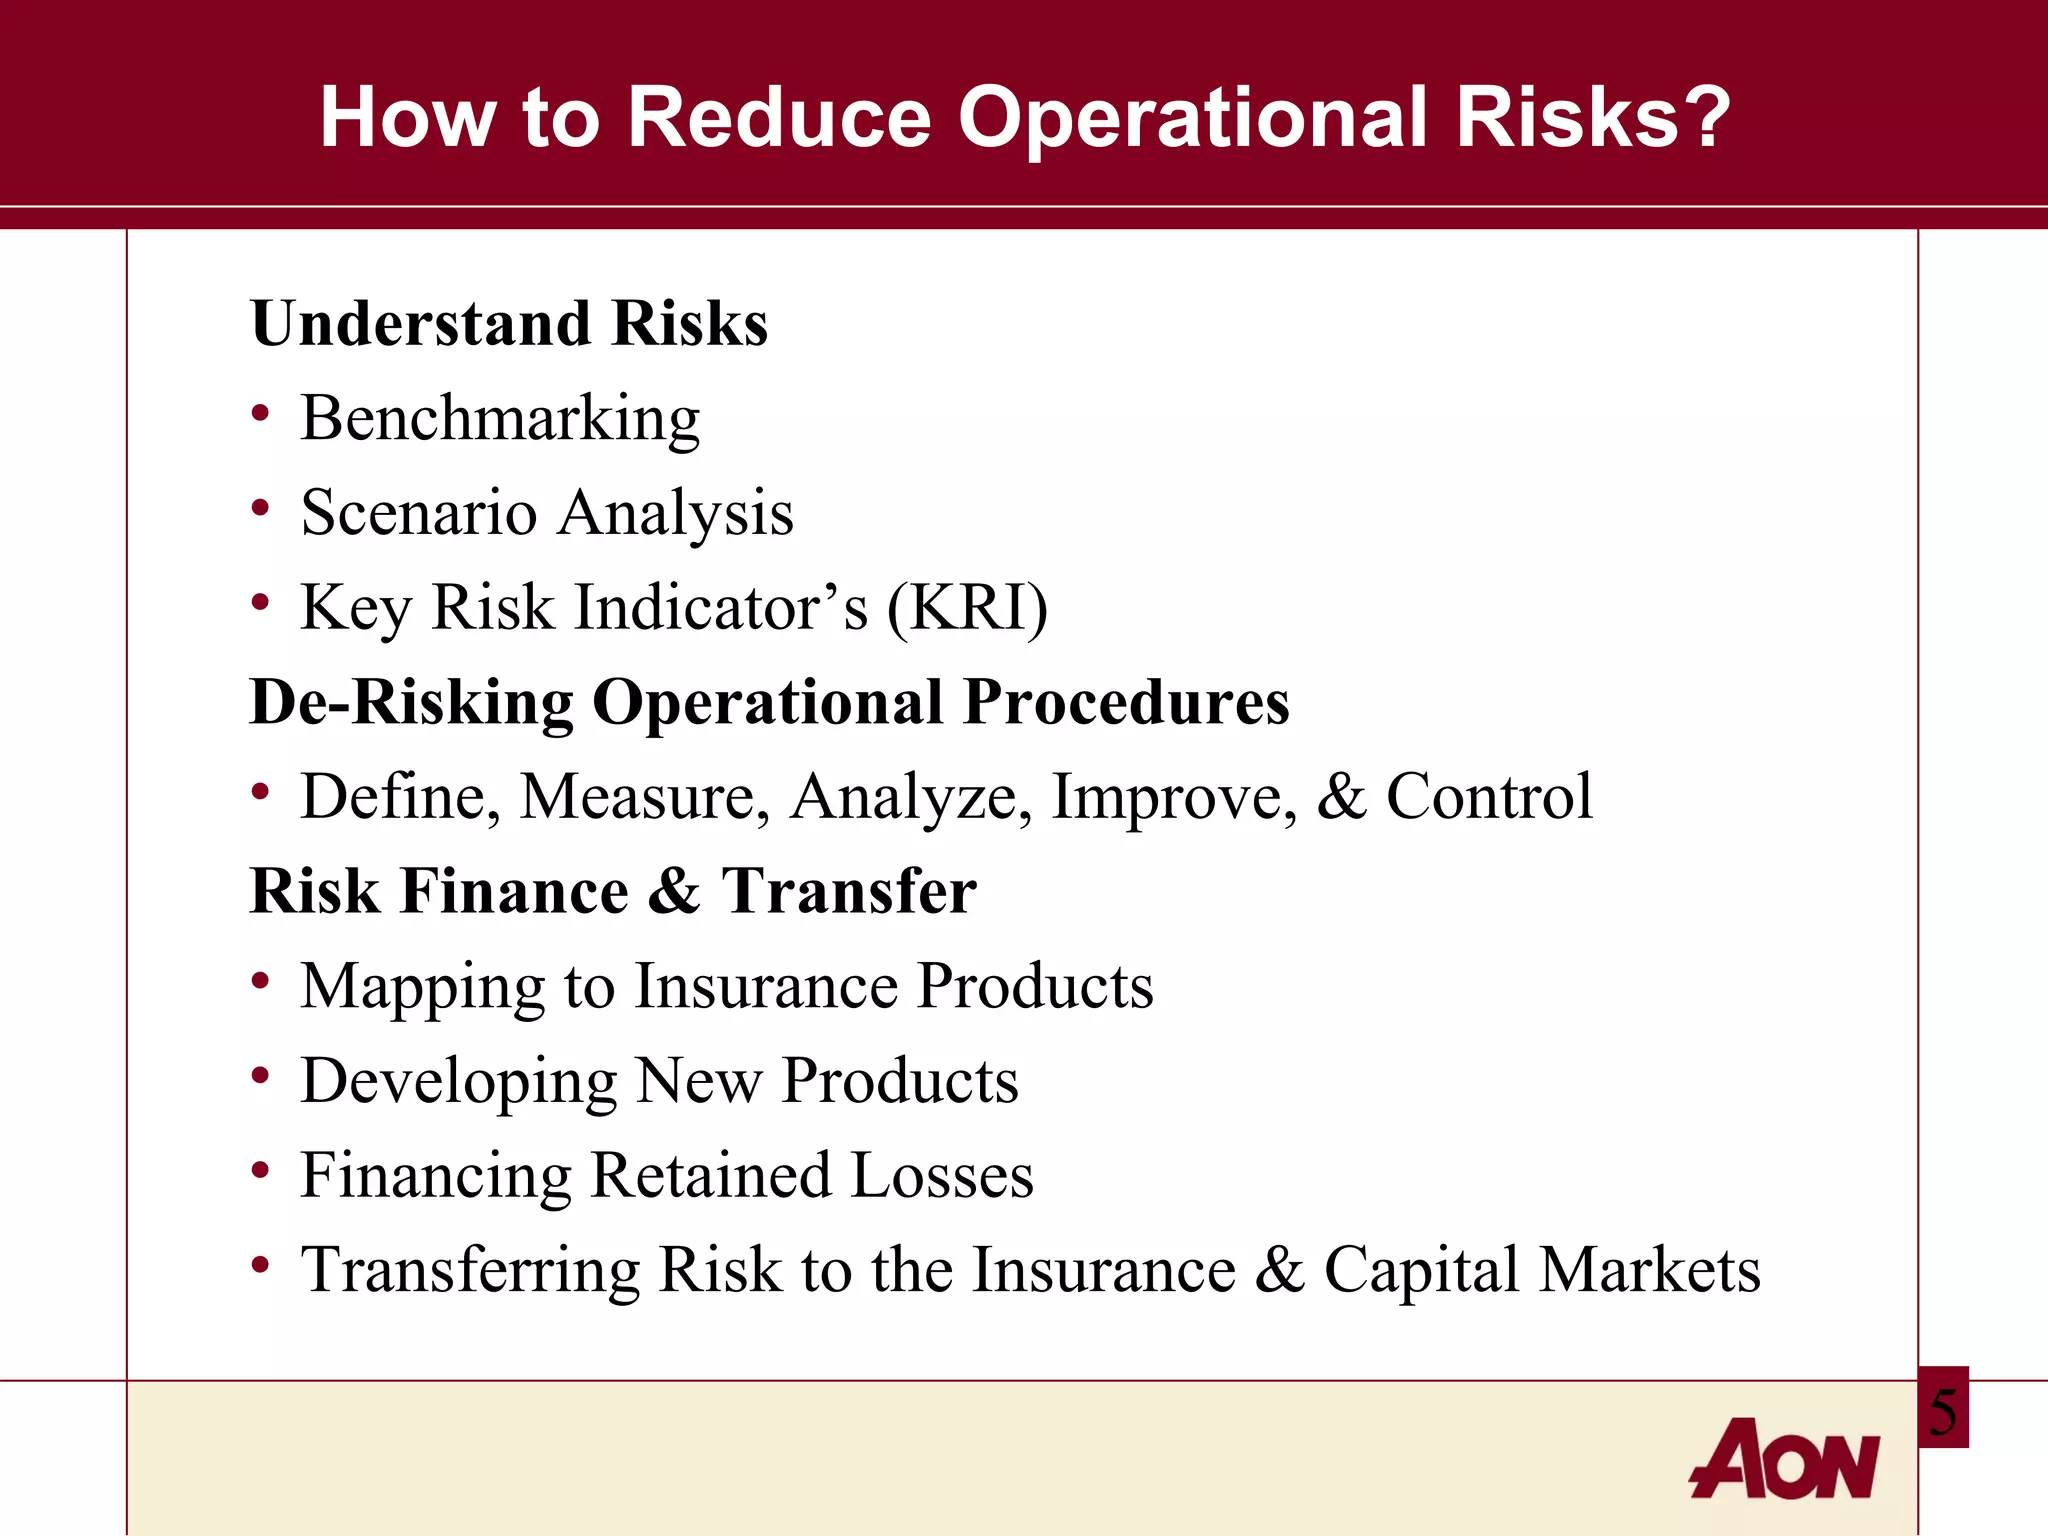
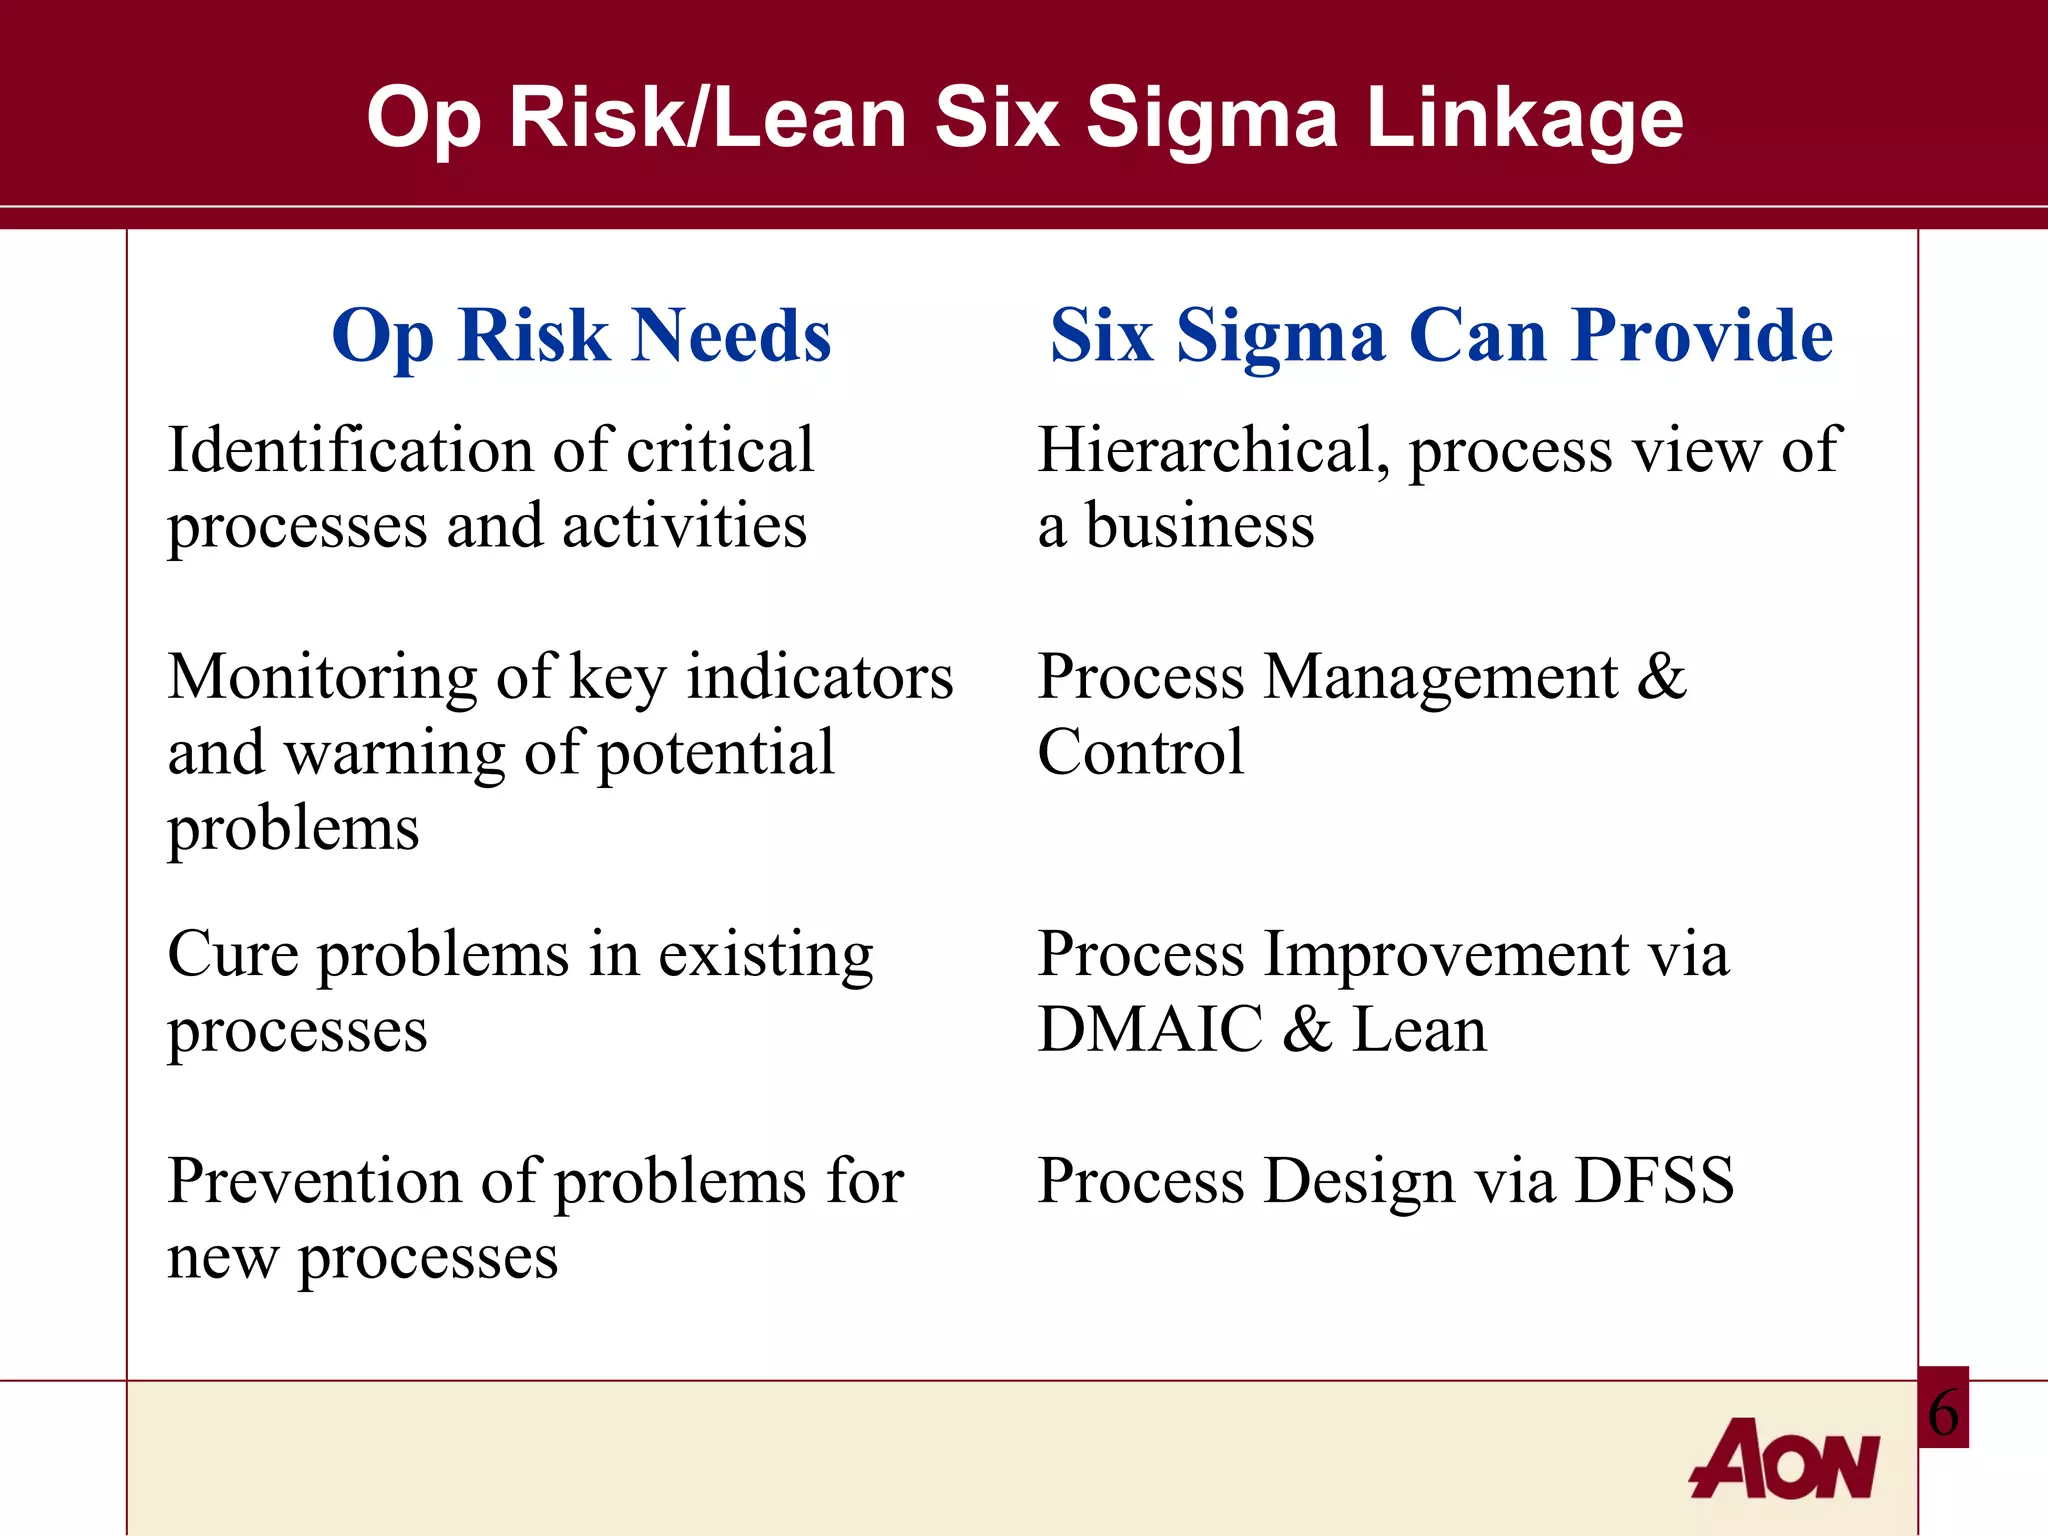
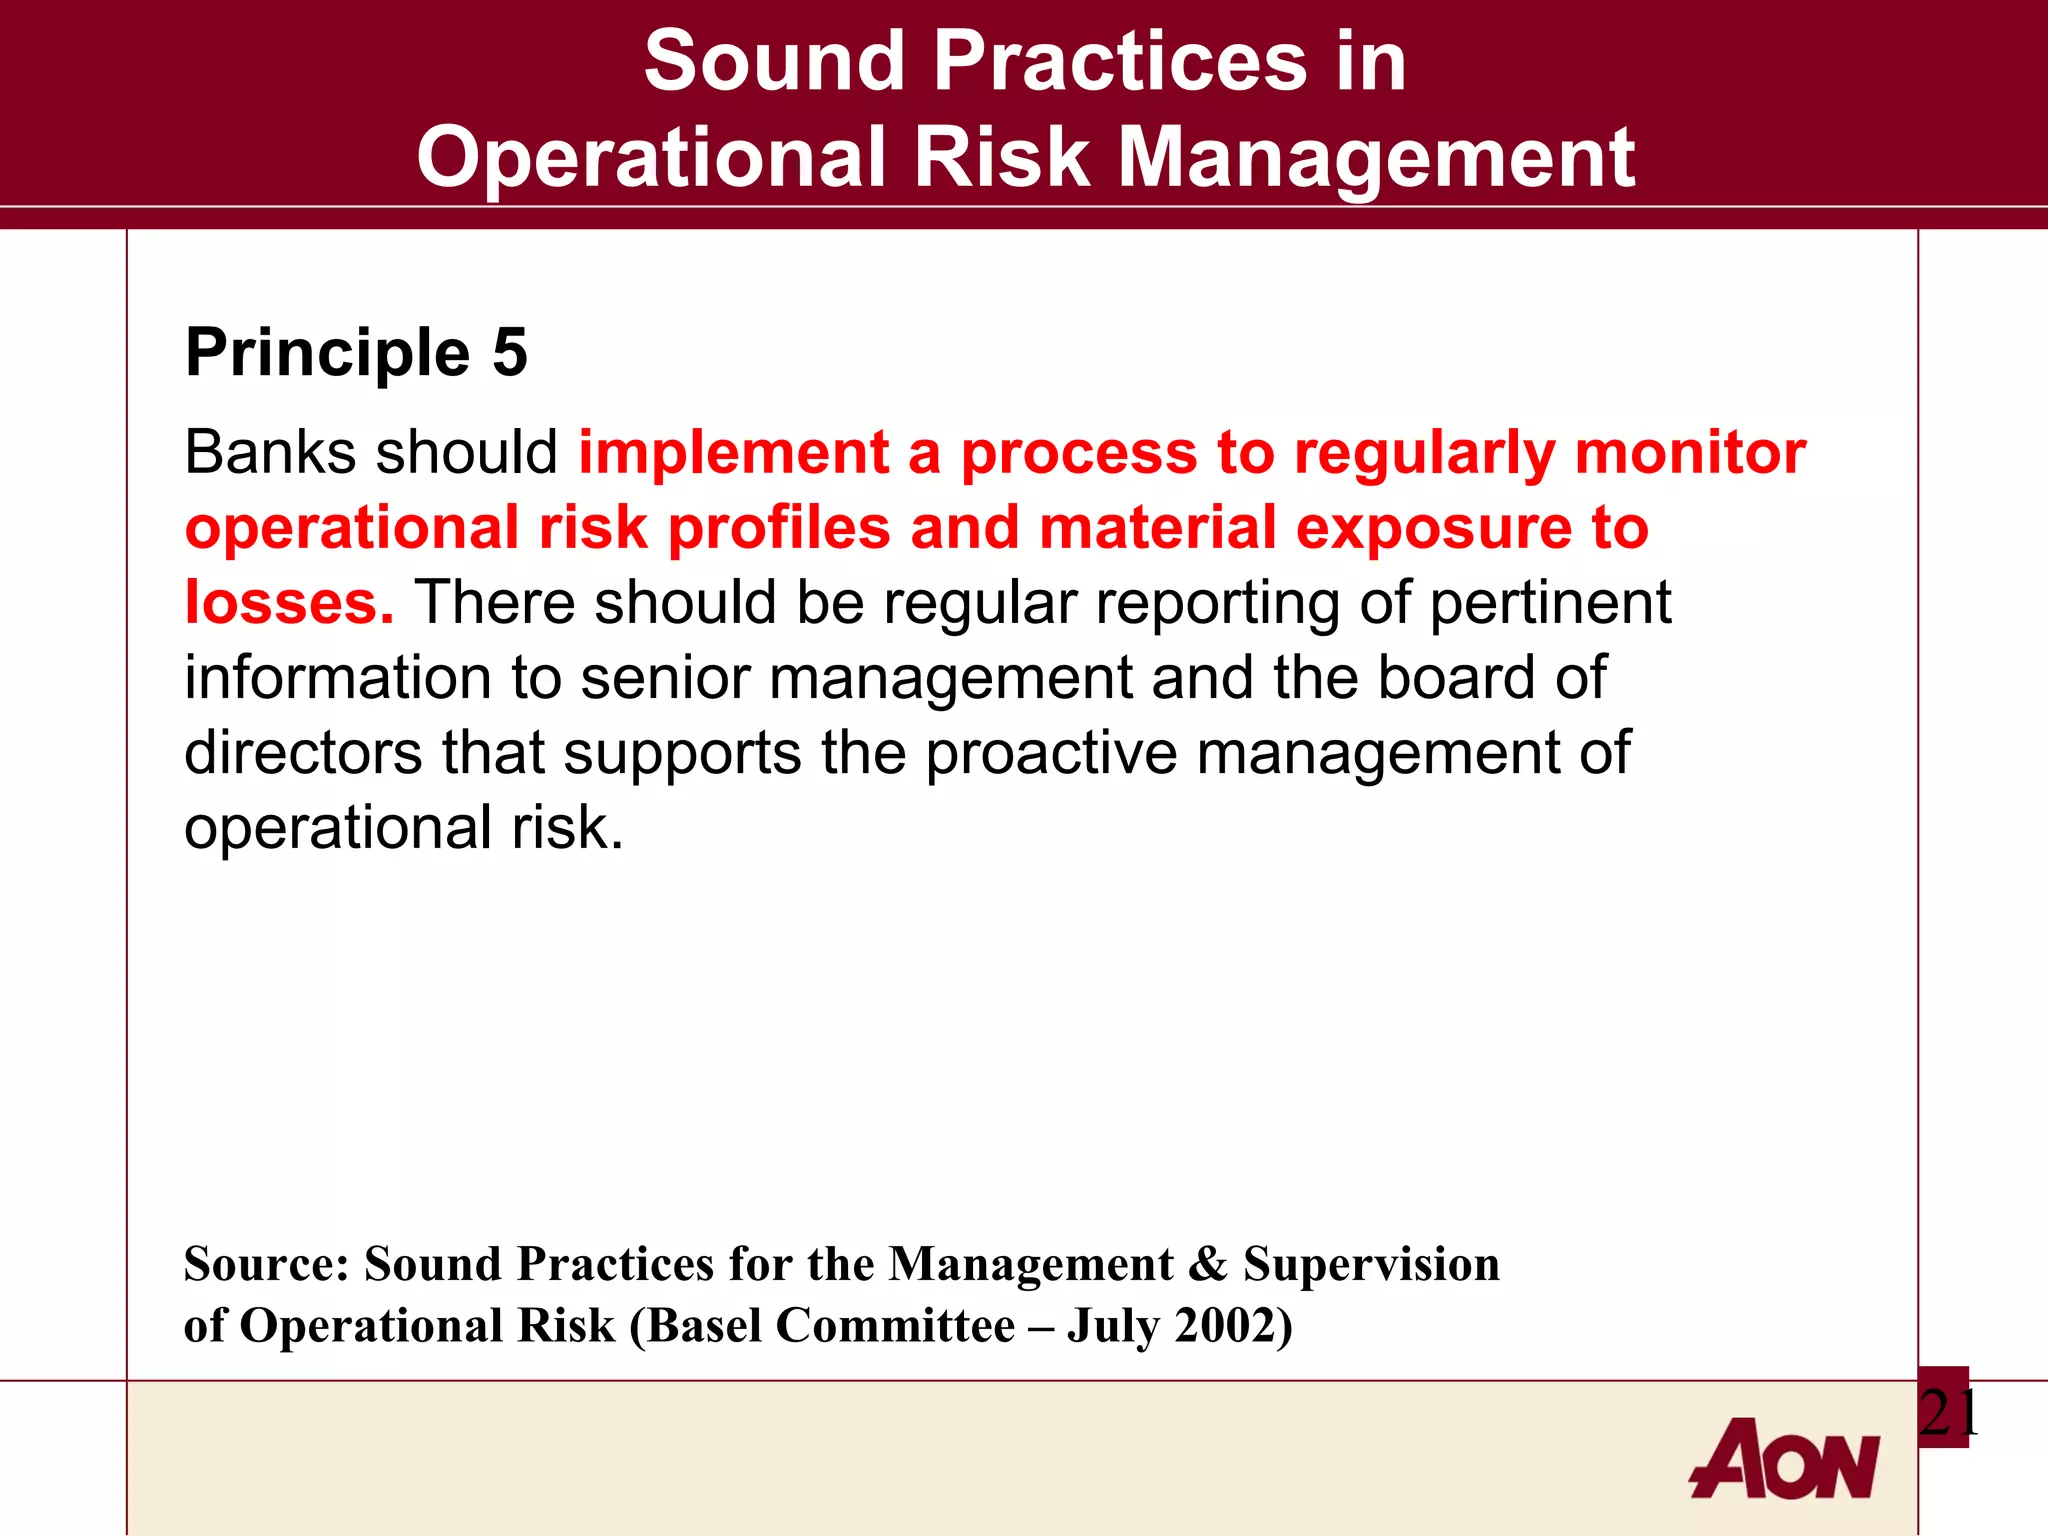
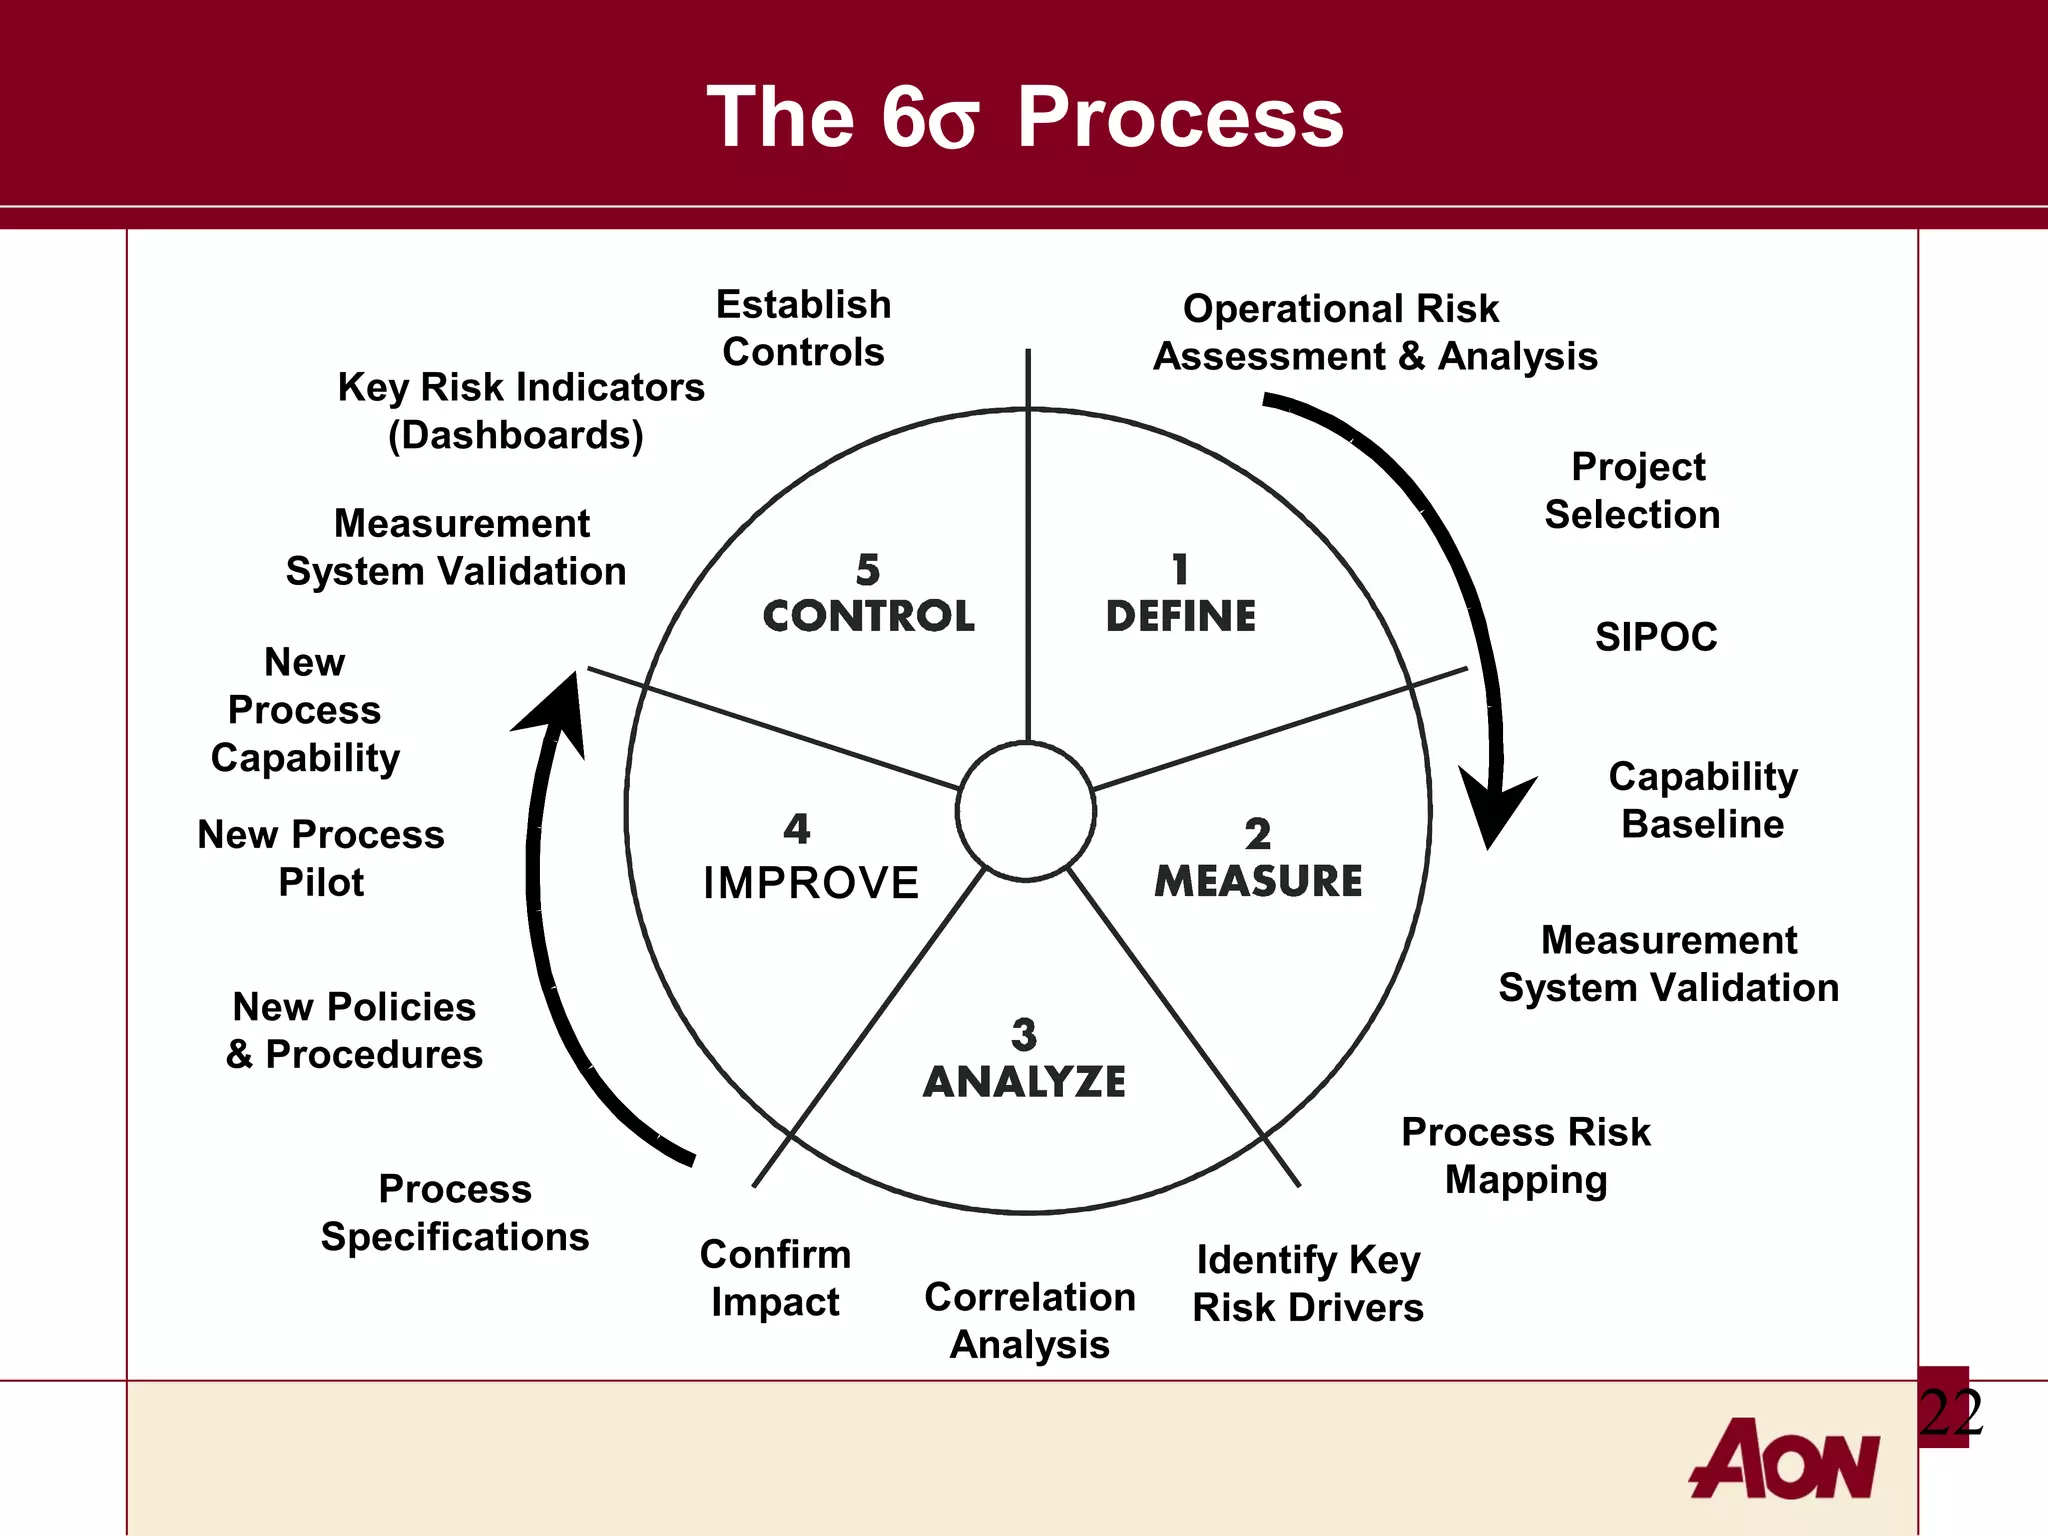
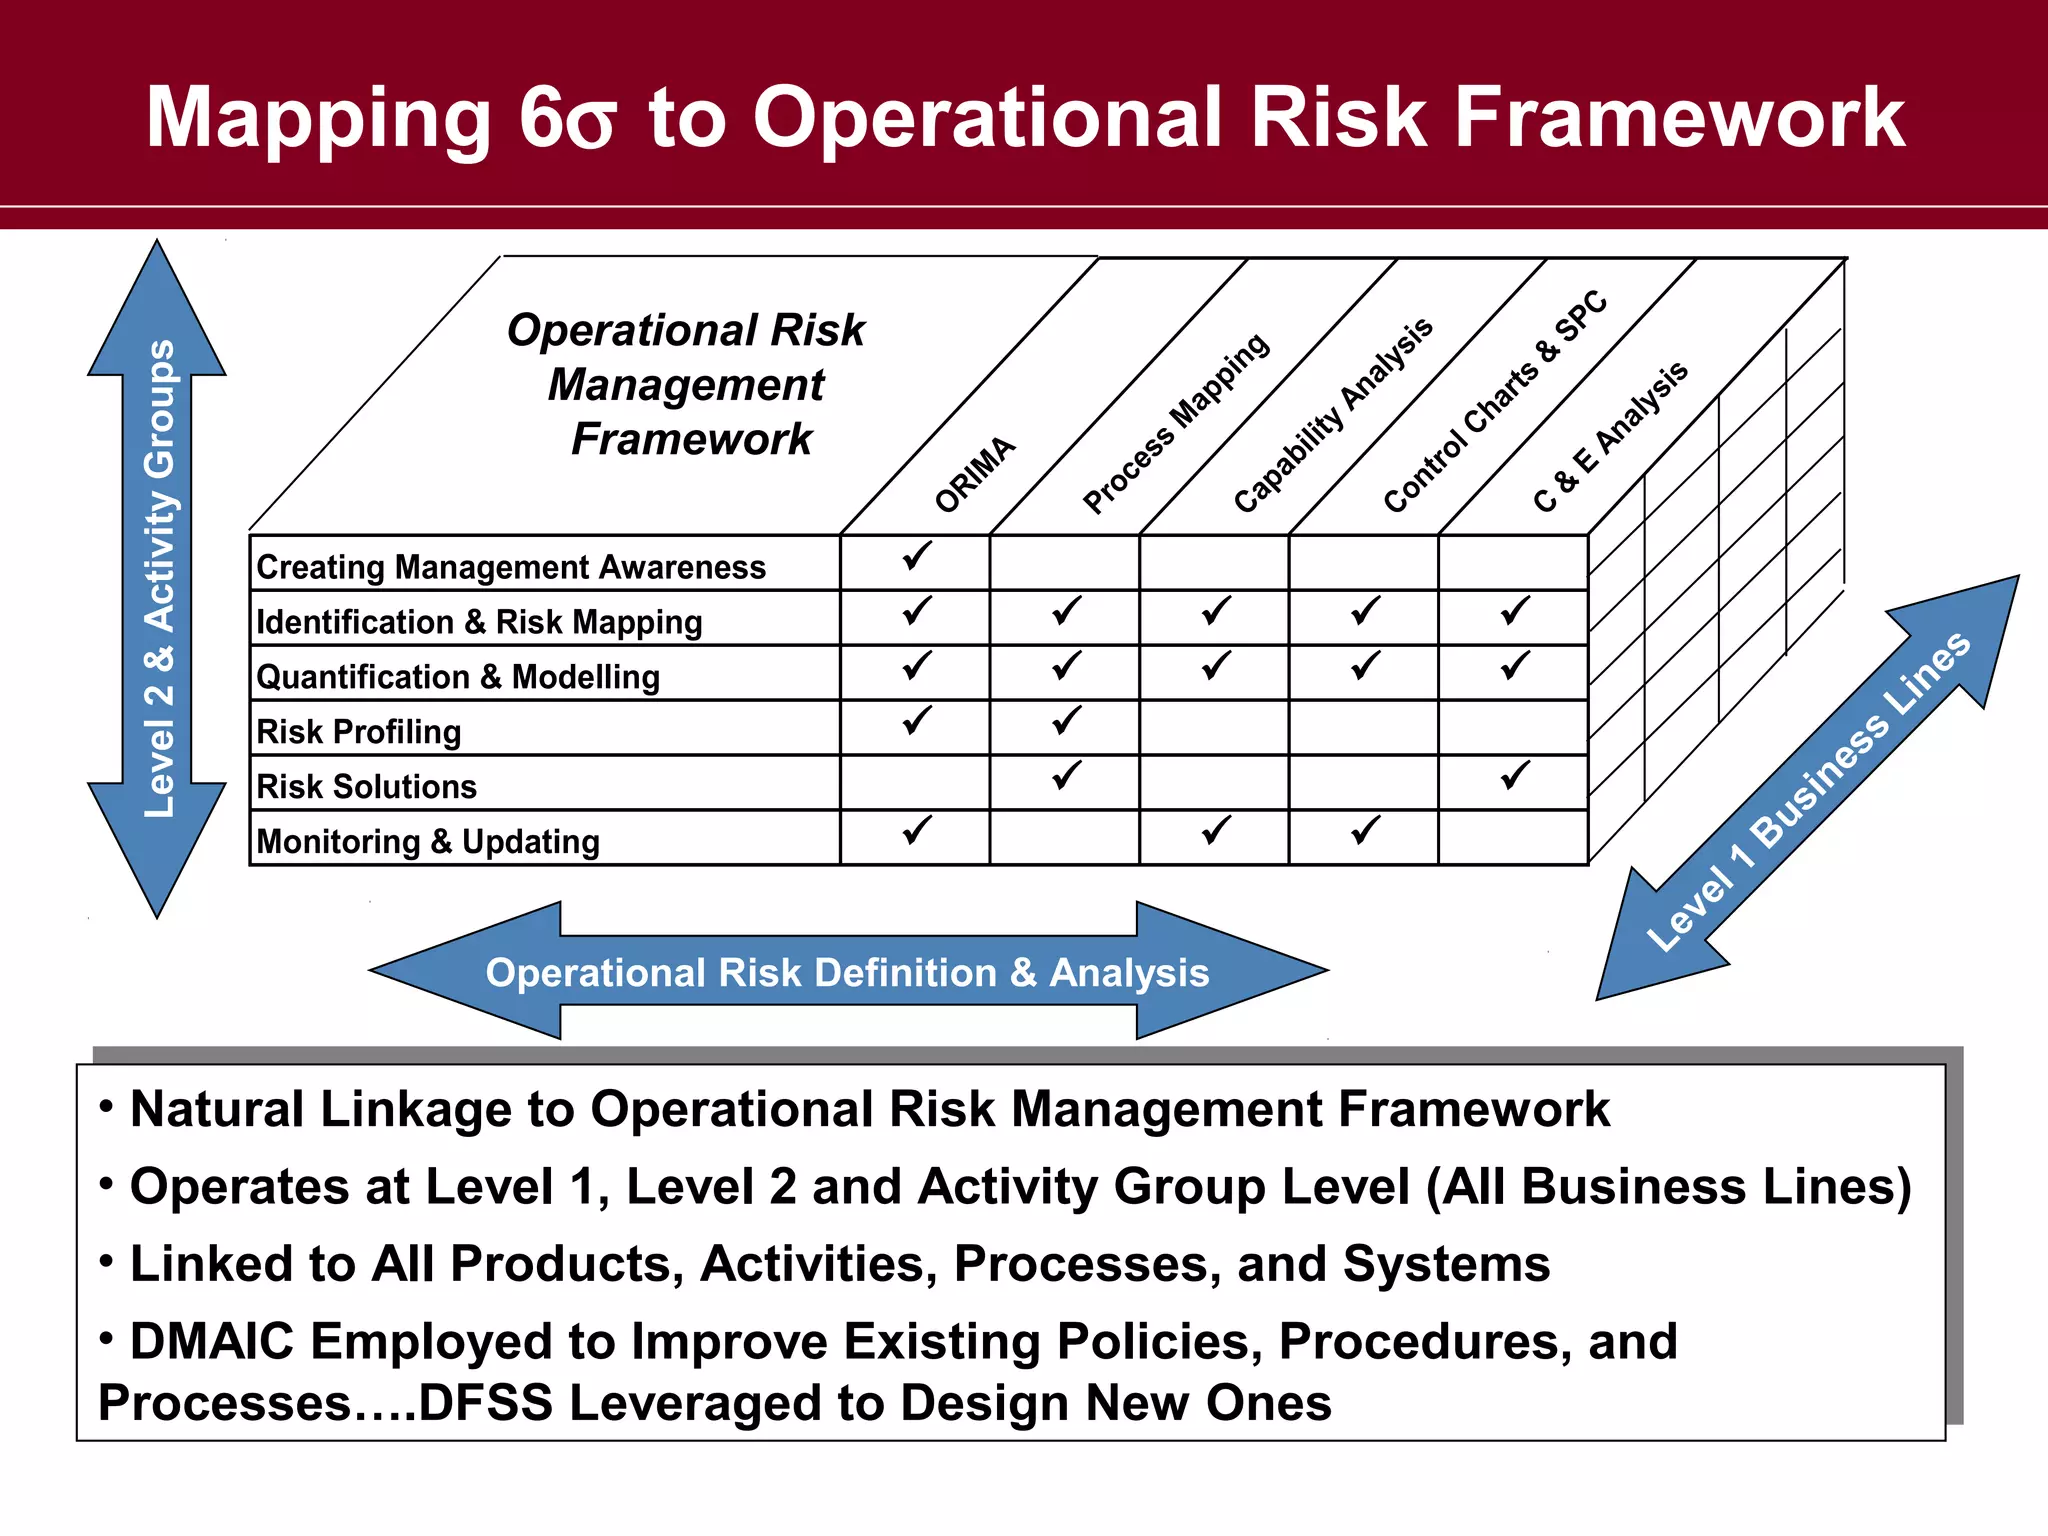
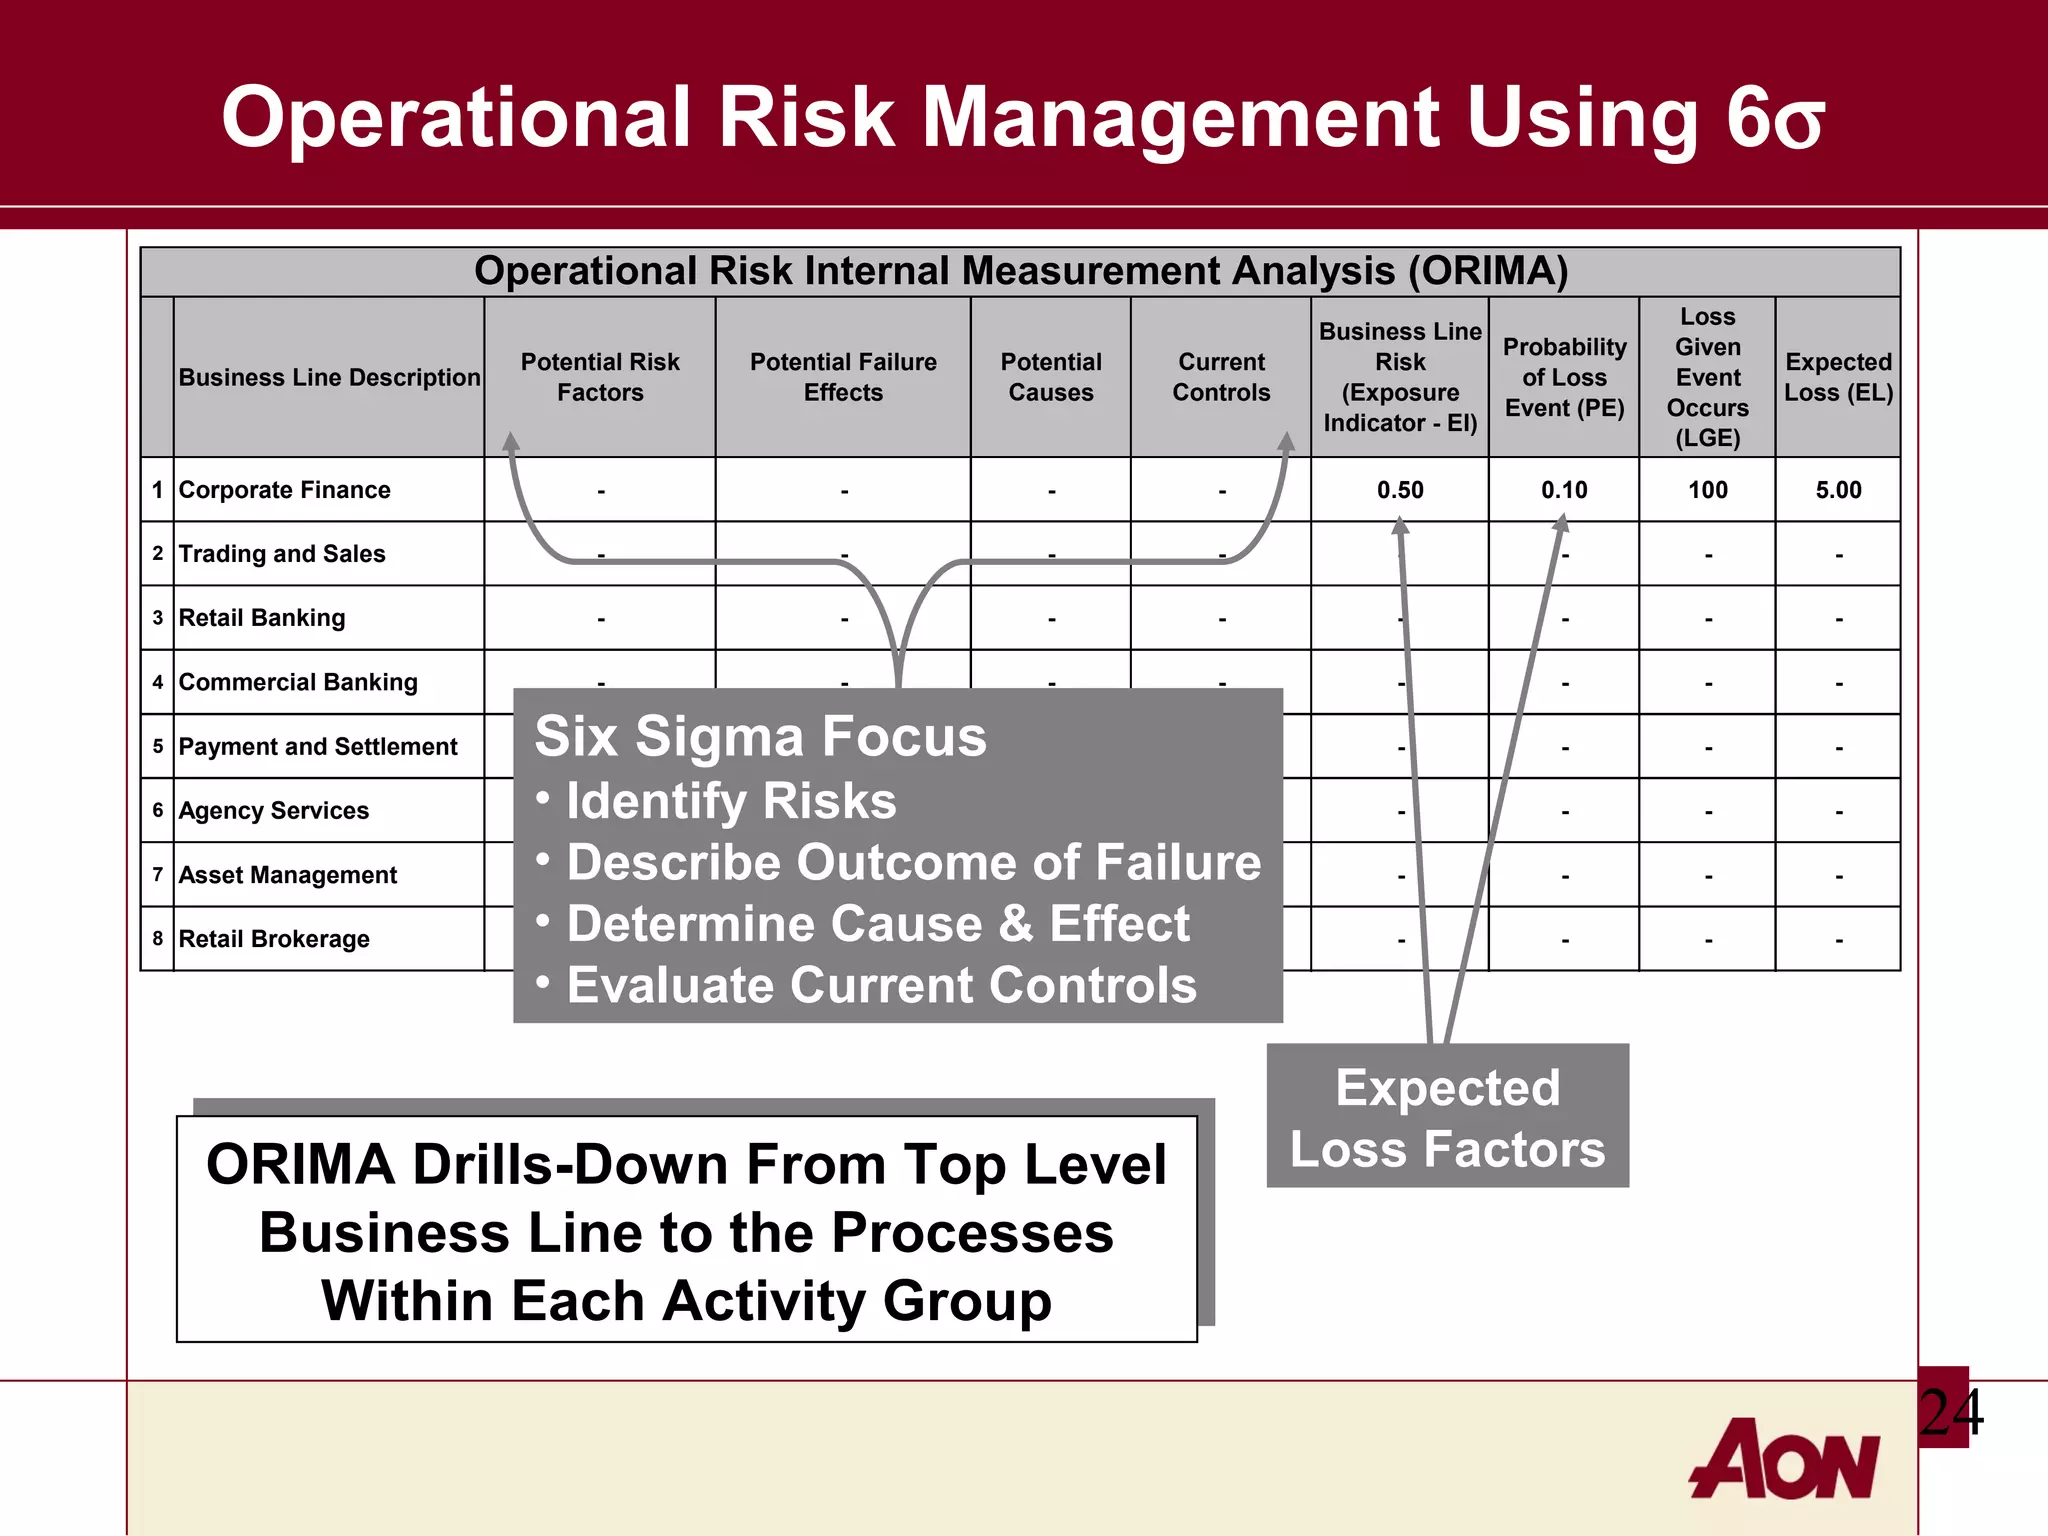
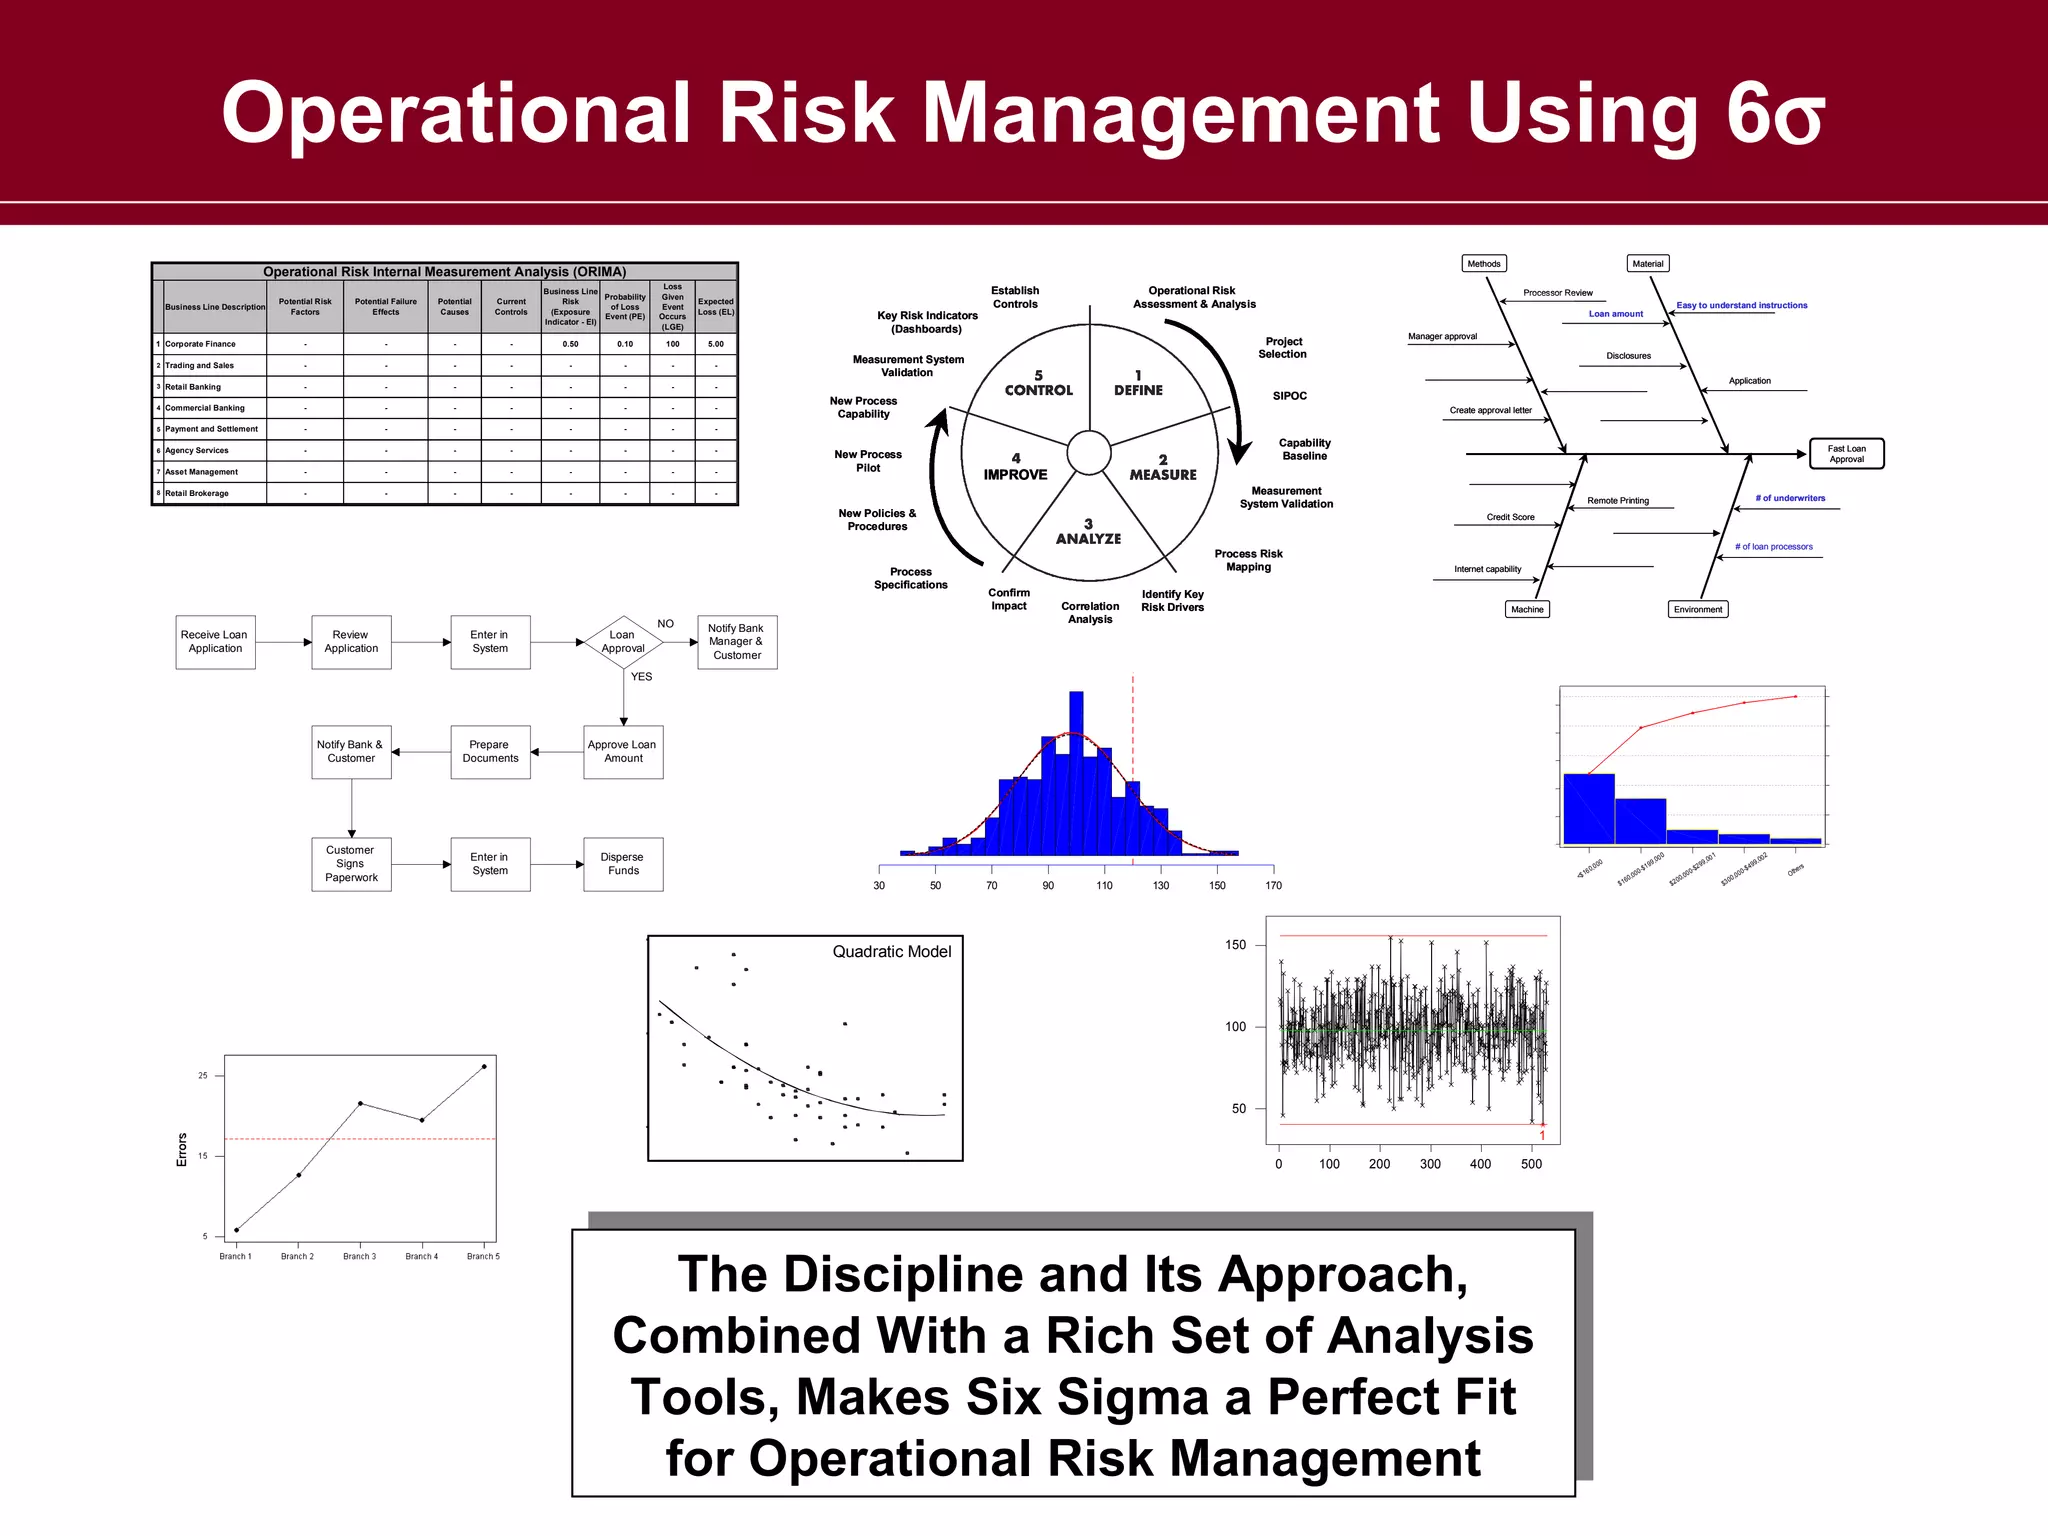

The document discusses operational risk management and how Six Sigma can help reduce operational risks. It begins by defining operational risk and outlining principles for managing such risks according to the Basel Committee. It then explains how Six Sigma's methodologies for designing, improving, and controlling processes can help organizations identify risks, fix problems, and maintain stable processes to minimize failures and losses. The document provides examples of how Six Sigma tools like process mapping and data analysis can be applied to operational risk management. Finally, it argues that Six Sigma's approach combines well with operational risk frameworks to help organizations effectively manage risks.


