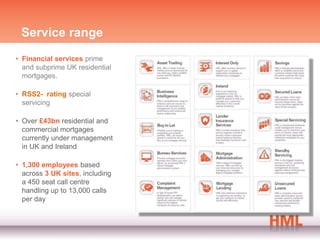
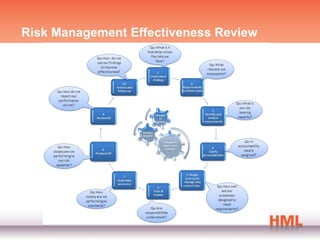
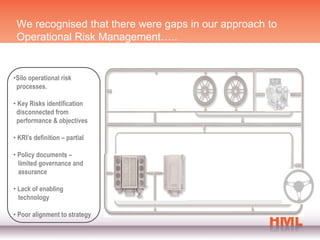
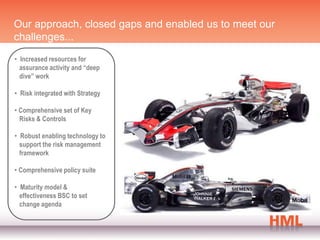
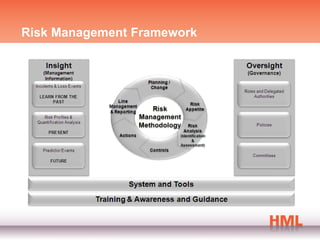
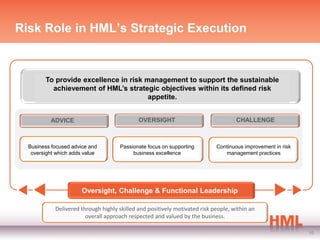
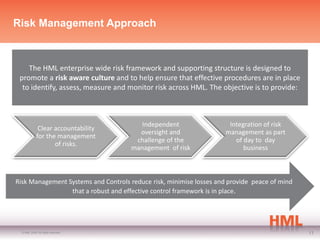
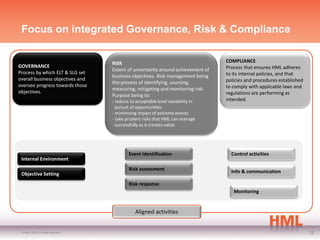
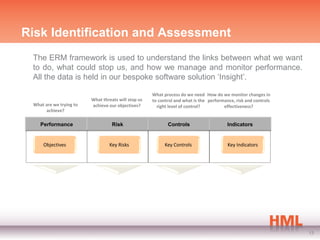
Delivering a Risk-Led Transformation

Gillian Weatherill– Head of Operational Risk
Agenda
• HML Overview

• Journey

• Risk Management

• Outcomes

• Whats next’

• Questions
Service range
• Financial services prime
  and subprime UK residential
  mortgages.

• RSS2- rating special
  servicing

• Over £43bn residential and
  commercial mortgages
  currently under management
  in UK and Ireland

• 1,300 employees based
  across 3 UK sites, including
  a 450 seat call centre
  handling up to 13,000 calls
  per day
Journey
 “The greatest antidote to worry….is preparation.
 The more you try to envisage what might happen
 and what your best response and options are, the
 more you are able to allay your fears for the
 future.”
                                   John Glenn, Astronaut


© HML 2010. All rights reserved.                           4
Risk Management Effectiveness Review
We recognised that there were gaps in our approach to
 Operational Risk Management…..


•Silo operational risk
 processes.

• Key Risks identification
 disconnected from
 performance & objectives

• KRI’s definition – partial

• Policy documents –
  limited governance and
  assurance

• Lack of enabling
  technology

• Poor alignment to strategy
Our approach, closed gaps and enabled us to meet our
challenges...
• Increased resources for
  assurance activity and “deep
  dive” work

• Risk integrated with Strategy

• Comprehensive set of Key
  Risks & Controls

• Robust enabling technology to
  support the risk management
  framework

• Comprehensive policy suite

• Maturity model &
  effectiveness BSC to set
  change agenda
Risk Management Framework
Risk Management


Remember that all models are wrong; the
practical question is how wrong do they have to
be to not be useful.”
                     George E. P. Box ( Statistician)


©© HML 2010. All rights reserved.
9 HML 2010. All rights reserved.
                                                        9
Risk Role in HML’s Strategic Execution


        To provide excellence in risk management to support the sustainable
          achievement of HML’s strategic objectives within its defined risk
                                       appetite.


          ADVICE                             OVERSIGHT                              CHALLENGE


  Business focused advice and        Passionate focus on supporting         Continuous improvement in risk
   oversight which adds value             business excellence                  management practices


                       Oversight, Challenge & Functional Leadership

            Delivered through highly skilled and positively motivated risk people, within an
                        overall approach respected and valued by the business.

                                                                                                             10
Risk Management Approach


    The HML enterprise wide risk framework and supporting structure is designed to
 promote a risk aware culture and to help ensure that effective procedures are in place
  to identify, assess, measure and monitor risk across HML. The objective is to provide:


                                         Independent                  Integration of risk
              Clear accountability
                                        oversight and                management as part
             for the management
                                       challenge of the                 of day to day
                    of risks.
                                      management of risk                   business


Risk Management Systems and Controls reduce risk, minimise losses and provide peace of mind
                 that a robust and effective control framework is in place.


  © HML 2009. All rights reserved.                                                            11
Focus on integrated Governance, Risk & Compliance


                                    RISK                                          COMPLIANCE
GOVERNANCE                                                                        Process that ensures HML adheres
                                    Extent of uncertainty around achievement of
Process by which ELT & SLG set                                                    to its internal policies, and that
                                    business objectives. Risk management being
overall business objectives and                                                   policies and procedures established
                                    the process of identifying, sourcing,
oversee progress towards those                                                    to comply with applicable laws and
                                    measuring, mitigating and monitoring risk.
objectives.                                                                       regulations are performing as
                                    Purpose being to:
                                    - reduce to acceptable level variability in   intended.
                                      pursuit of opportunities
                                    - minimising impact of extreme events
                                    - take prudent risks that HML can manage
                                      successfully as it creates value.


                                            Event identification                    Control activities
 Internal Environment
                                            Risk assessment                         Info & communication
 Objective Setting
                                            Risk response
                                                                                     Monitoring


                                               Aligned activities


 © HML 2009. All rights reserved.                                                                                       12
Risk Identification and Assessment
 The ERM framework is used to understand the links between what we want
 to do, what could stop us, and how we manage and monitor performance.
 All the data is held in our bespoke software solution ‘Insight’.

                                                     What process do we need How do we monitor changes in
                         What threats will stop us   to control and what is the performance, risk and controls
 What are we trying to   achieve our objectives?       right level of control?         effectiveness?
      achieve?

    Performance                    Risk                     Controls                     Indicators


     Objectives                  Key Risks                 Key Controls                  Key Indicators


                                                                                                                 13
Control Effectiveness
  The Control Self Assessment (CSA) quarterly certification process was
  introduced in Q4 2009
  The process involves all key controls across all divisions being reviewed,
  capturing:-
   • the control purpose
   • an assessment of the effectiveness of the control
   • documentation of proof to support the certification


                                                       Line 1       Line 2
                                                     challenge    validation

       Key
                               Certification
     Controls
 -Type                    -Certified effectiveness
 - Assessment score       - Improvement action
 - Expected performance


                                                                               14
Outcomes: So what?
Direct Operational Losses by Year

                        The graphs opposite show the operational
                        losses paid out from January 2007 - September
                        2011, by value and volume in the year the error
                        occurred.

                        •   The improvement in performance is
                            illustrated and there has been a 93%
                            reduction in the value of losses that have
                            occurred during 2010 compared with
                            those that occurred during 2008.

                        •   From 2007, there has been a 56%
                            reduction in the volume of losses that
                            occurred during 2010 compared with
                            those that occurred during 2008. In
                            addition, the severity of losses has
                            reduced over the years and, for the
                            losses that occurred during 2010, 97% of
                            the volume of these were for individual
                            amounts that were less than £1k.
Audit Actions


The graphs are based on all issues                 % of issues added each year by Grade
raised from internal audits, external
reviews and internal compliance and         100%


assurance reviews                           90%


                                            80%


The percentage of issues that are rated     70%

Significant / High risk has decreased
year on year since 2008. In 2008 24%        60%


of issues were rated Significant or High.   50%


This reduced to 14% in 2009 and again       40%

to 10% in 2010. So far in 2011 the % of
                                            30%                                                  Low / Efficiency
high issues stands at 5% of the total
                                                                                                 Medium
issues added.                               20%

                                                                                                 Significant / High
                                            10%


The percentage of issues rated medium        0%
                                                   2008        2009        2010           2011

risk has also decreased from 48% in
2008 to 45% in 2011.


                                                                                                                      17
•Q&A


       18
Strategy and Risk Management Executive
Breakfast
3 Movember 2011

HML Risk Transformation

  • 1.
    Delivering a Risk-LedTransformation Gillian Weatherill– Head of Operational Risk
  • 2.
    Agenda • HML Overview •Journey • Risk Management • Outcomes • Whats next’ • Questions
  • 3.
    Service range • Financialservices prime and subprime UK residential mortgages. • RSS2- rating special servicing • Over £43bn residential and commercial mortgages currently under management in UK and Ireland • 1,300 employees based across 3 UK sites, including a 450 seat call centre handling up to 13,000 calls per day
  • 4.
    Journey “The greatestantidote to worry….is preparation. The more you try to envisage what might happen and what your best response and options are, the more you are able to allay your fears for the future.” John Glenn, Astronaut © HML 2010. All rights reserved. 4
  • 5.
  • 6.
    We recognised thatthere were gaps in our approach to Operational Risk Management….. •Silo operational risk processes. • Key Risks identification disconnected from performance & objectives • KRI’s definition – partial • Policy documents – limited governance and assurance • Lack of enabling technology • Poor alignment to strategy
  • 7.
    Our approach, closedgaps and enabled us to meet our challenges... • Increased resources for assurance activity and “deep dive” work • Risk integrated with Strategy • Comprehensive set of Key Risks & Controls • Robust enabling technology to support the risk management framework • Comprehensive policy suite • Maturity model & effectiveness BSC to set change agenda
  • 8.
  • 9.
    Risk Management Remember thatall models are wrong; the practical question is how wrong do they have to be to not be useful.” George E. P. Box ( Statistician) ©© HML 2010. All rights reserved. 9 HML 2010. All rights reserved. 9
  • 10.
    Risk Role inHML’s Strategic Execution To provide excellence in risk management to support the sustainable achievement of HML’s strategic objectives within its defined risk appetite. ADVICE OVERSIGHT CHALLENGE Business focused advice and Passionate focus on supporting Continuous improvement in risk oversight which adds value business excellence management practices Oversight, Challenge & Functional Leadership Delivered through highly skilled and positively motivated risk people, within an overall approach respected and valued by the business. 10
  • 11.
    Risk Management Approach The HML enterprise wide risk framework and supporting structure is designed to promote a risk aware culture and to help ensure that effective procedures are in place to identify, assess, measure and monitor risk across HML. The objective is to provide: Independent Integration of risk Clear accountability oversight and management as part for the management challenge of the of day to day of risks. management of risk business Risk Management Systems and Controls reduce risk, minimise losses and provide peace of mind that a robust and effective control framework is in place. © HML 2009. All rights reserved. 11
  • 12.
    Focus on integratedGovernance, Risk & Compliance RISK COMPLIANCE GOVERNANCE Process that ensures HML adheres Extent of uncertainty around achievement of Process by which ELT & SLG set to its internal policies, and that business objectives. Risk management being overall business objectives and policies and procedures established the process of identifying, sourcing, oversee progress towards those to comply with applicable laws and measuring, mitigating and monitoring risk. objectives. regulations are performing as Purpose being to: - reduce to acceptable level variability in intended. pursuit of opportunities - minimising impact of extreme events - take prudent risks that HML can manage successfully as it creates value. Event identification Control activities Internal Environment Risk assessment Info & communication Objective Setting Risk response Monitoring Aligned activities © HML 2009. All rights reserved. 12
  • 13.
    Risk Identification andAssessment The ERM framework is used to understand the links between what we want to do, what could stop us, and how we manage and monitor performance. All the data is held in our bespoke software solution ‘Insight’. What process do we need How do we monitor changes in What threats will stop us to control and what is the performance, risk and controls What are we trying to achieve our objectives? right level of control? effectiveness? achieve? Performance Risk Controls Indicators Objectives Key Risks Key Controls Key Indicators 13
  • 14.
    Control Effectiveness The Control Self Assessment (CSA) quarterly certification process was introduced in Q4 2009 The process involves all key controls across all divisions being reviewed, capturing:- • the control purpose • an assessment of the effectiveness of the control • documentation of proof to support the certification Line 1 Line 2 challenge validation Key Certification Controls -Type -Certified effectiveness - Assessment score - Improvement action - Expected performance 14
  • 15.
  • 16.
    Direct Operational Lossesby Year The graphs opposite show the operational losses paid out from January 2007 - September 2011, by value and volume in the year the error occurred. • The improvement in performance is illustrated and there has been a 93% reduction in the value of losses that have occurred during 2010 compared with those that occurred during 2008. • From 2007, there has been a 56% reduction in the volume of losses that occurred during 2010 compared with those that occurred during 2008. In addition, the severity of losses has reduced over the years and, for the losses that occurred during 2010, 97% of the volume of these were for individual amounts that were less than £1k.
  • 17.
    Audit Actions The graphsare based on all issues % of issues added each year by Grade raised from internal audits, external reviews and internal compliance and 100% assurance reviews 90% 80% The percentage of issues that are rated 70% Significant / High risk has decreased year on year since 2008. In 2008 24% 60% of issues were rated Significant or High. 50% This reduced to 14% in 2009 and again 40% to 10% in 2010. So far in 2011 the % of 30% Low / Efficiency high issues stands at 5% of the total Medium issues added. 20% Significant / High 10% The percentage of issues rated medium 0% 2008 2009 2010 2011 risk has also decreased from 48% in 2008 to 45% in 2011. 17
  • 18.
  • 19.
    Strategy and RiskManagement Executive Breakfast 3 Movember 2011