Downloaded 188 times
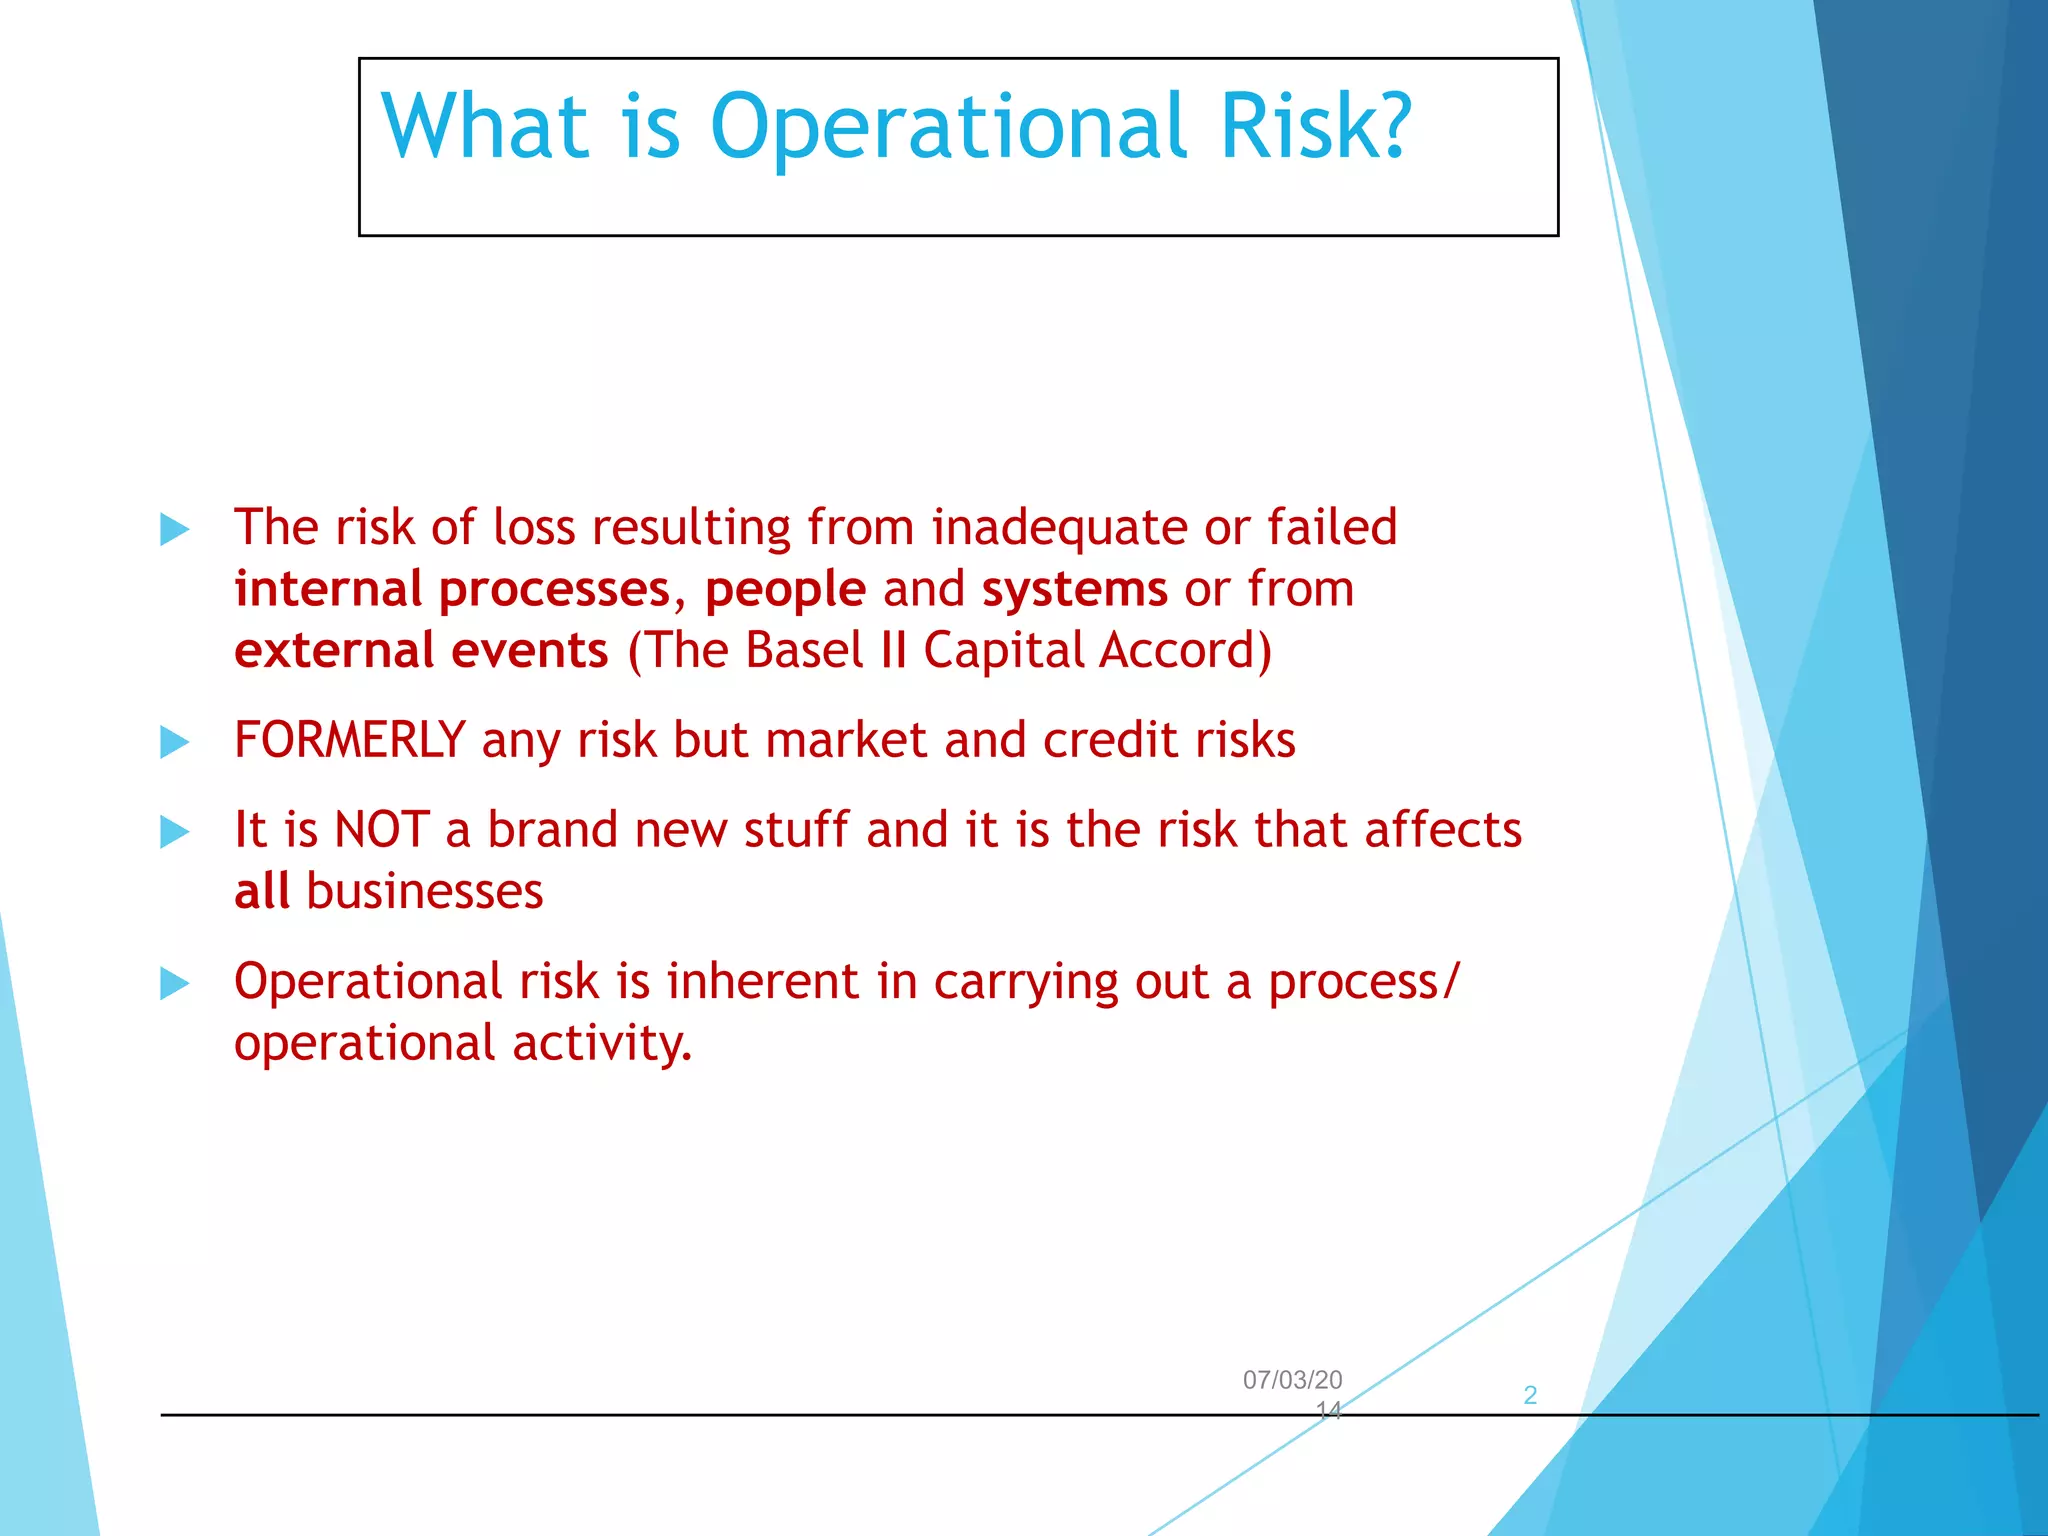
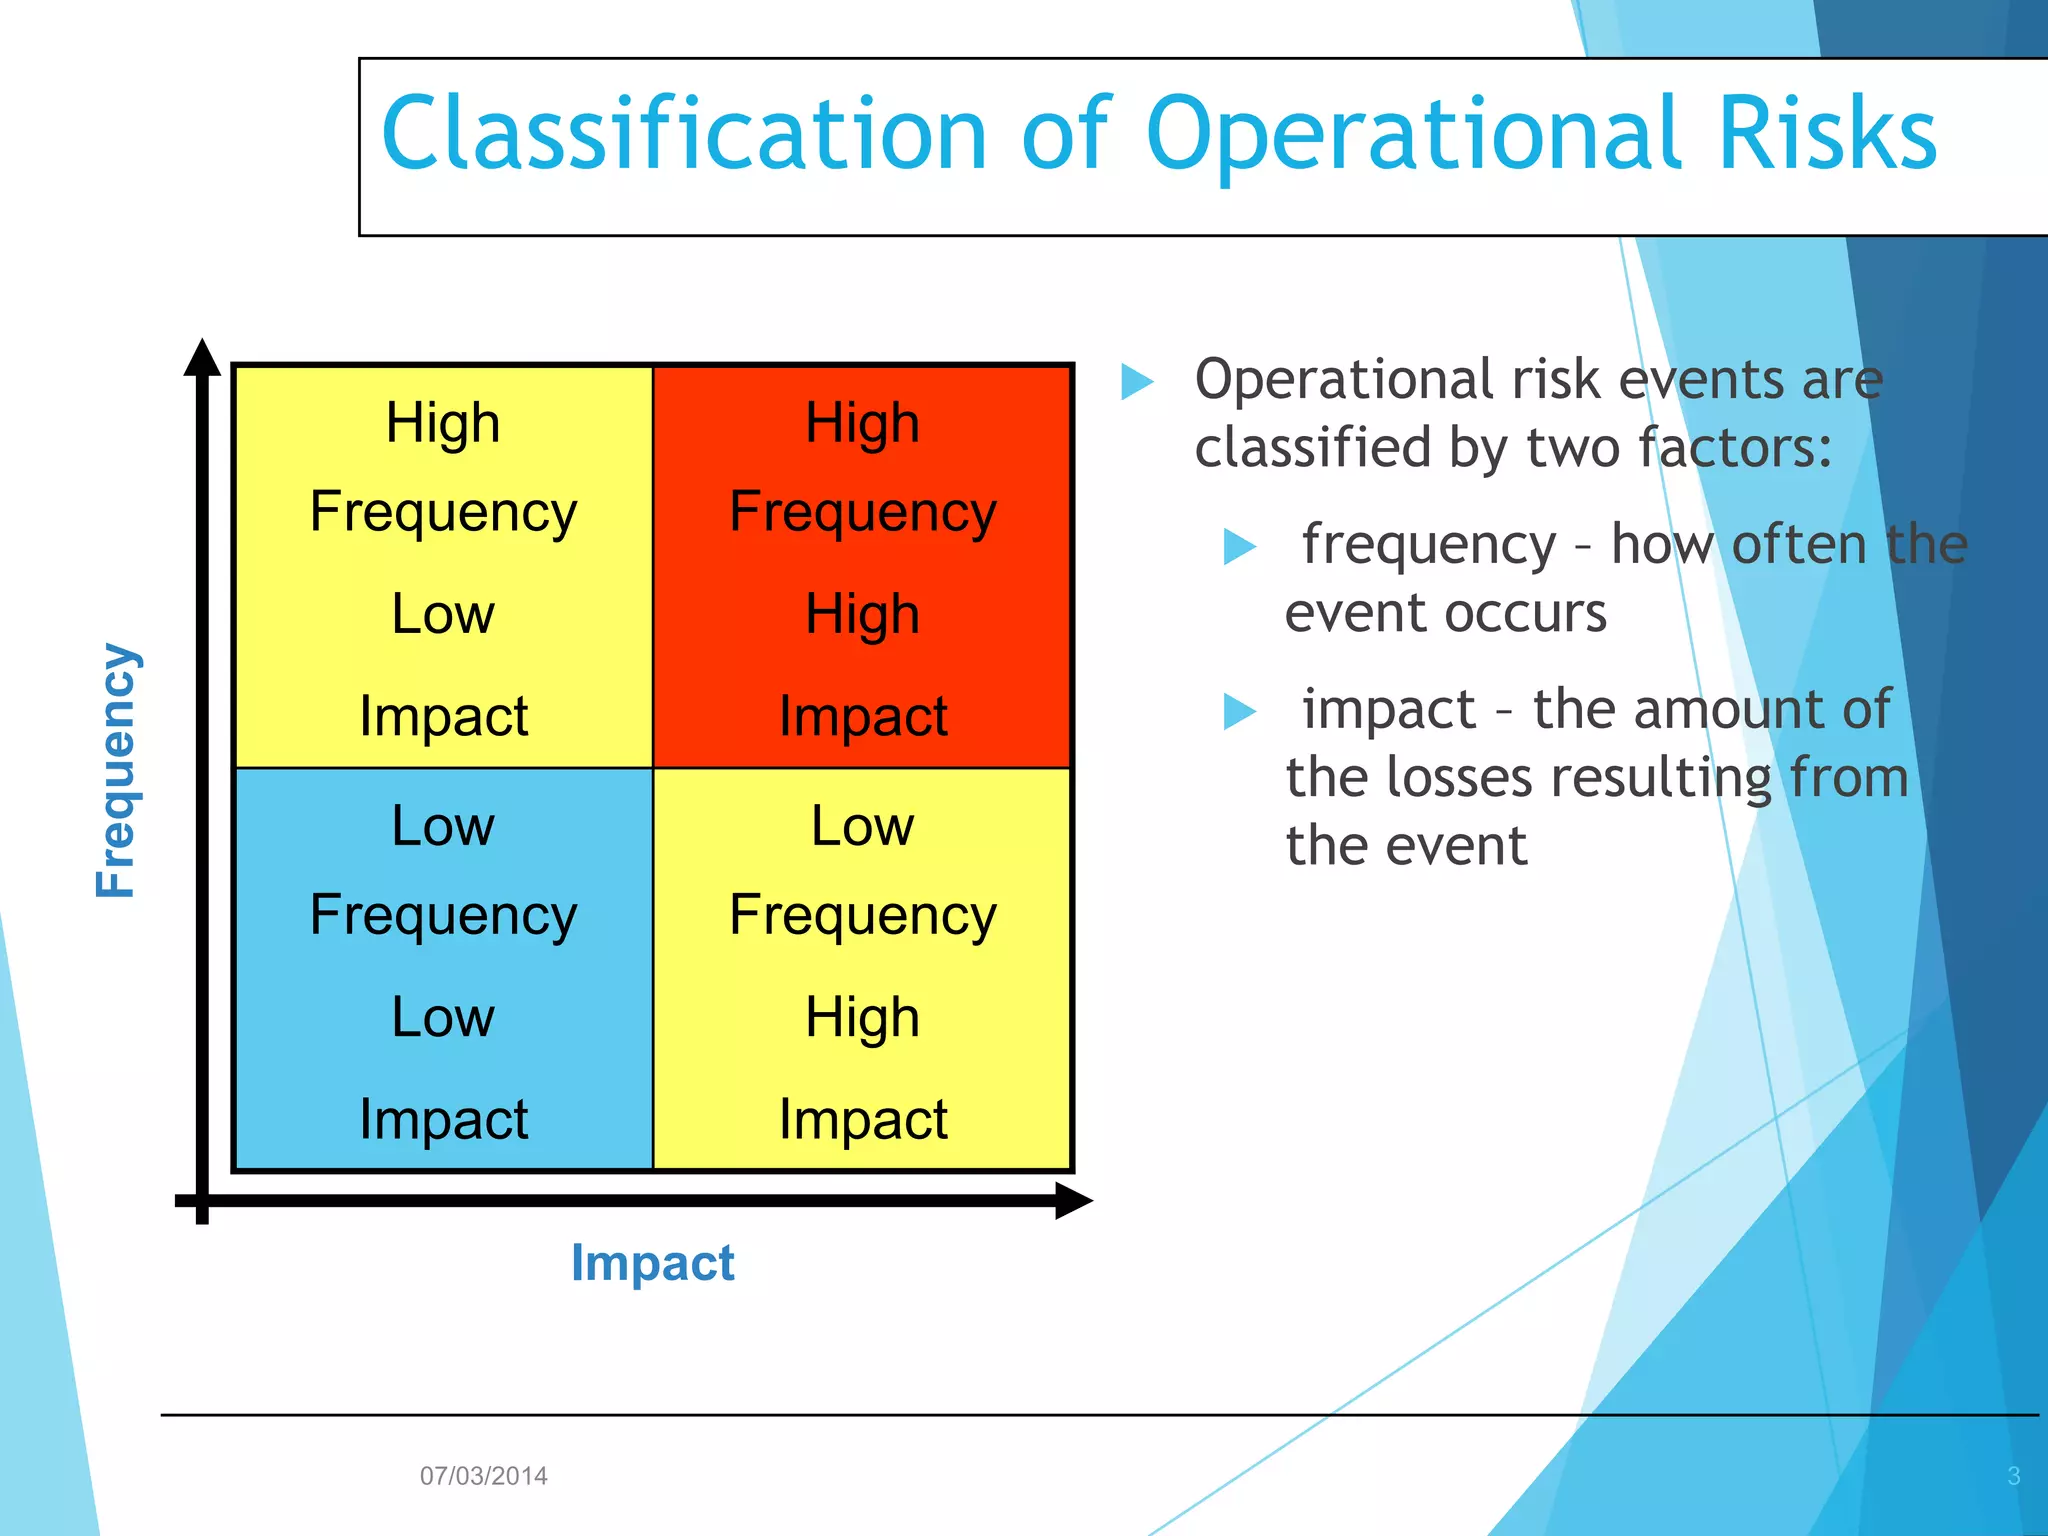
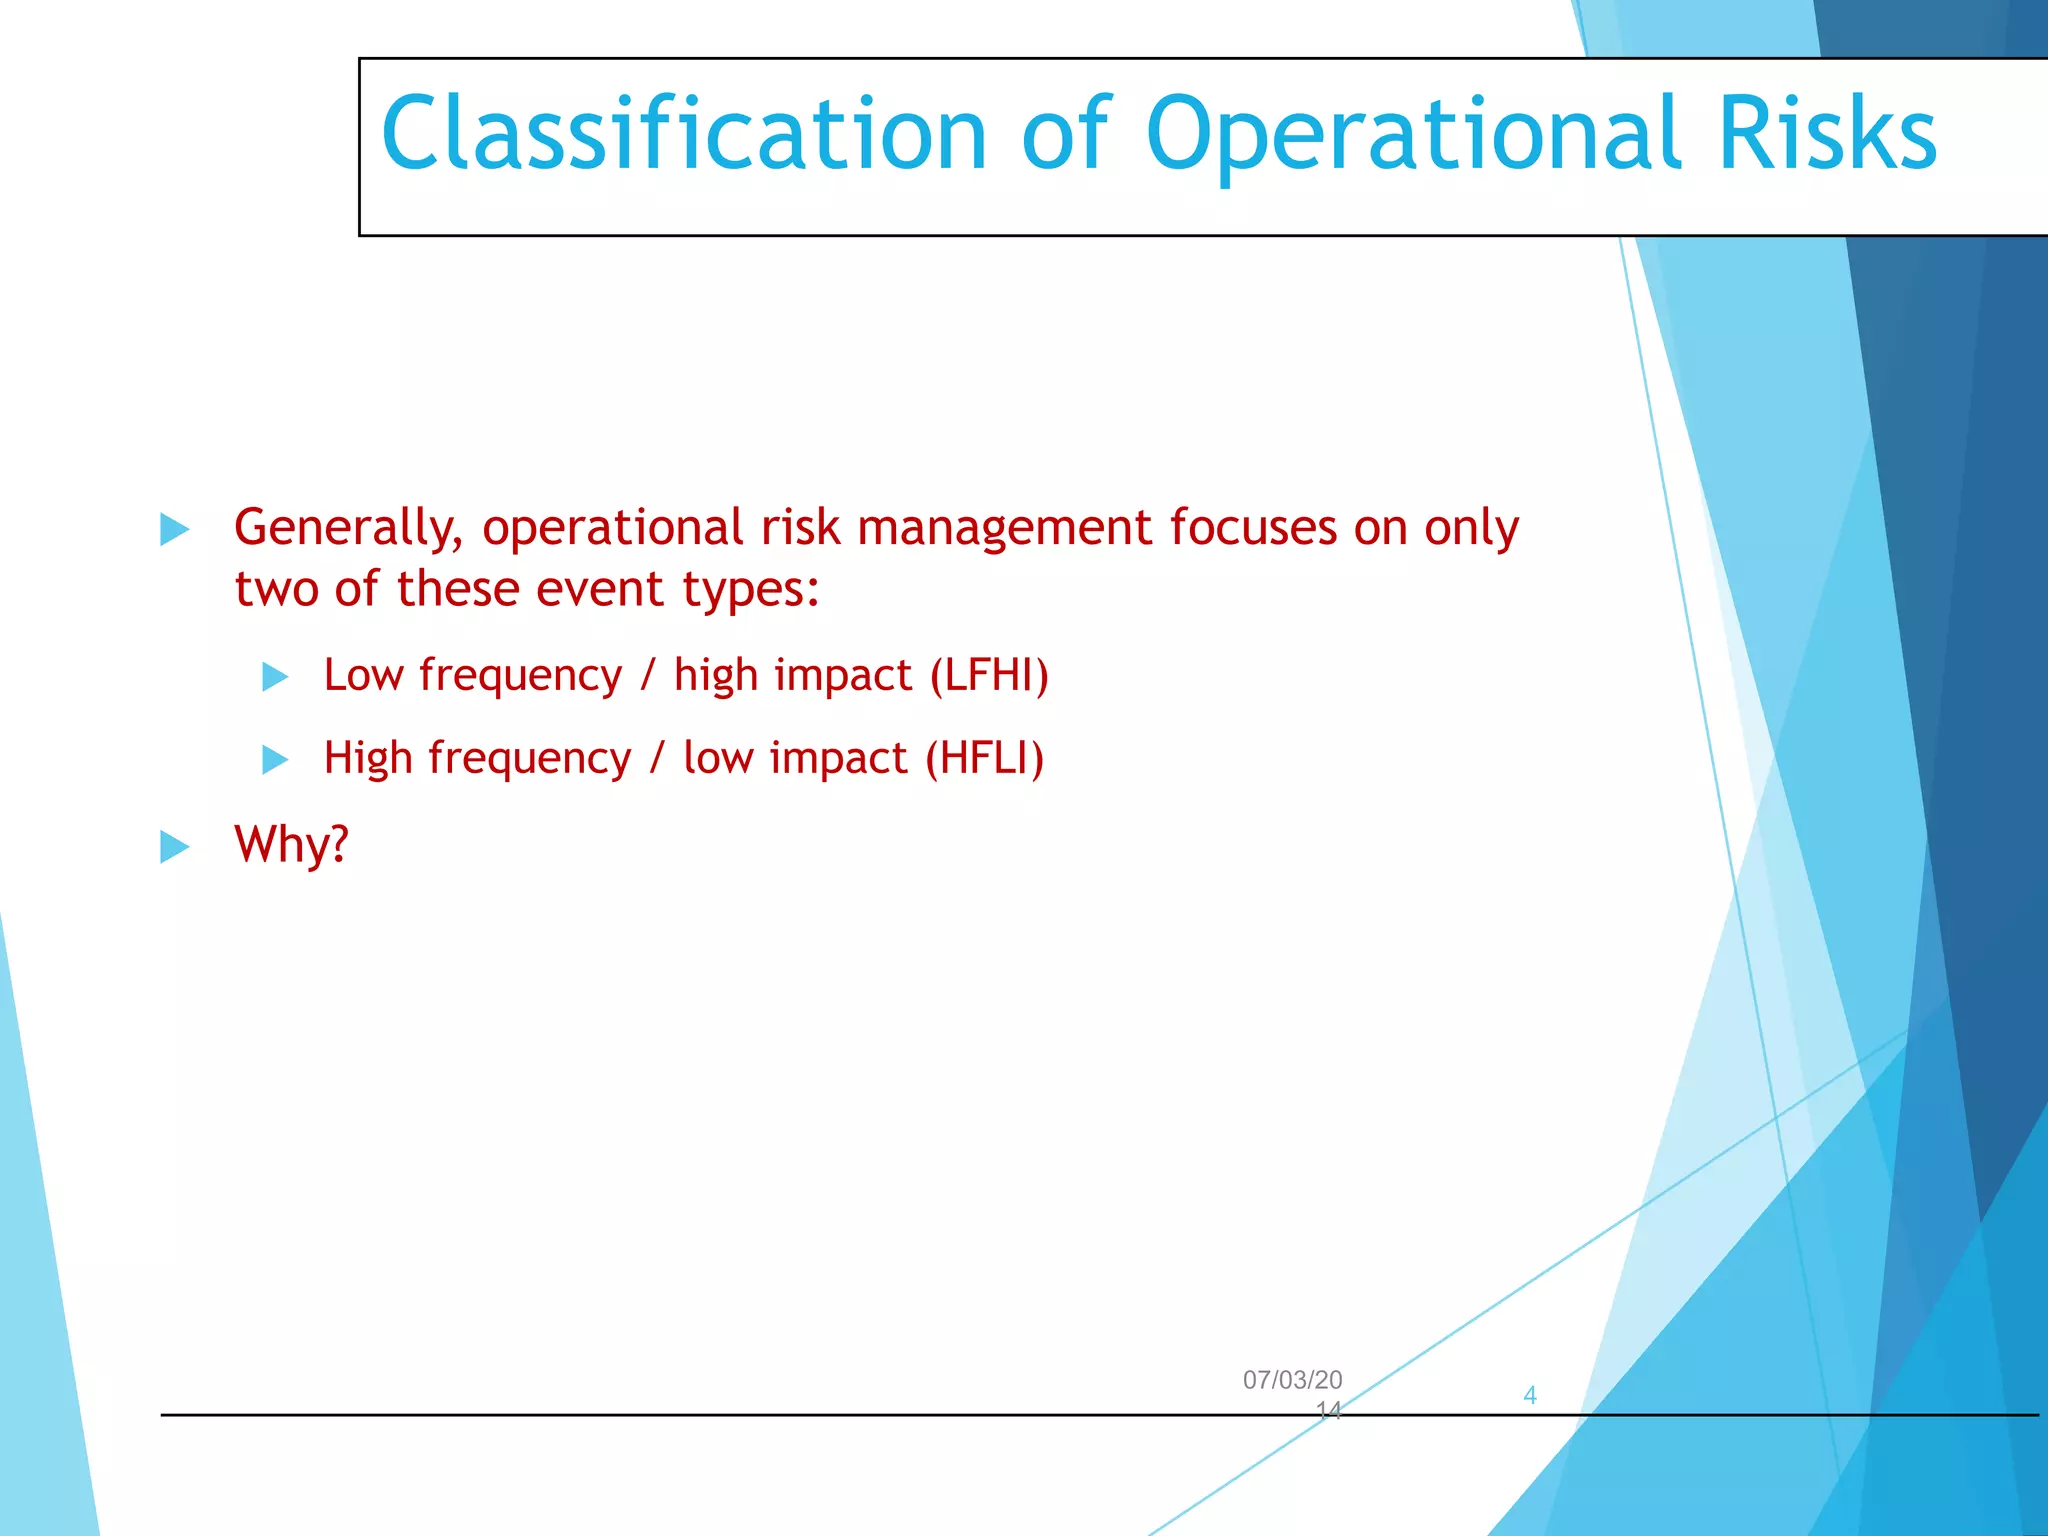
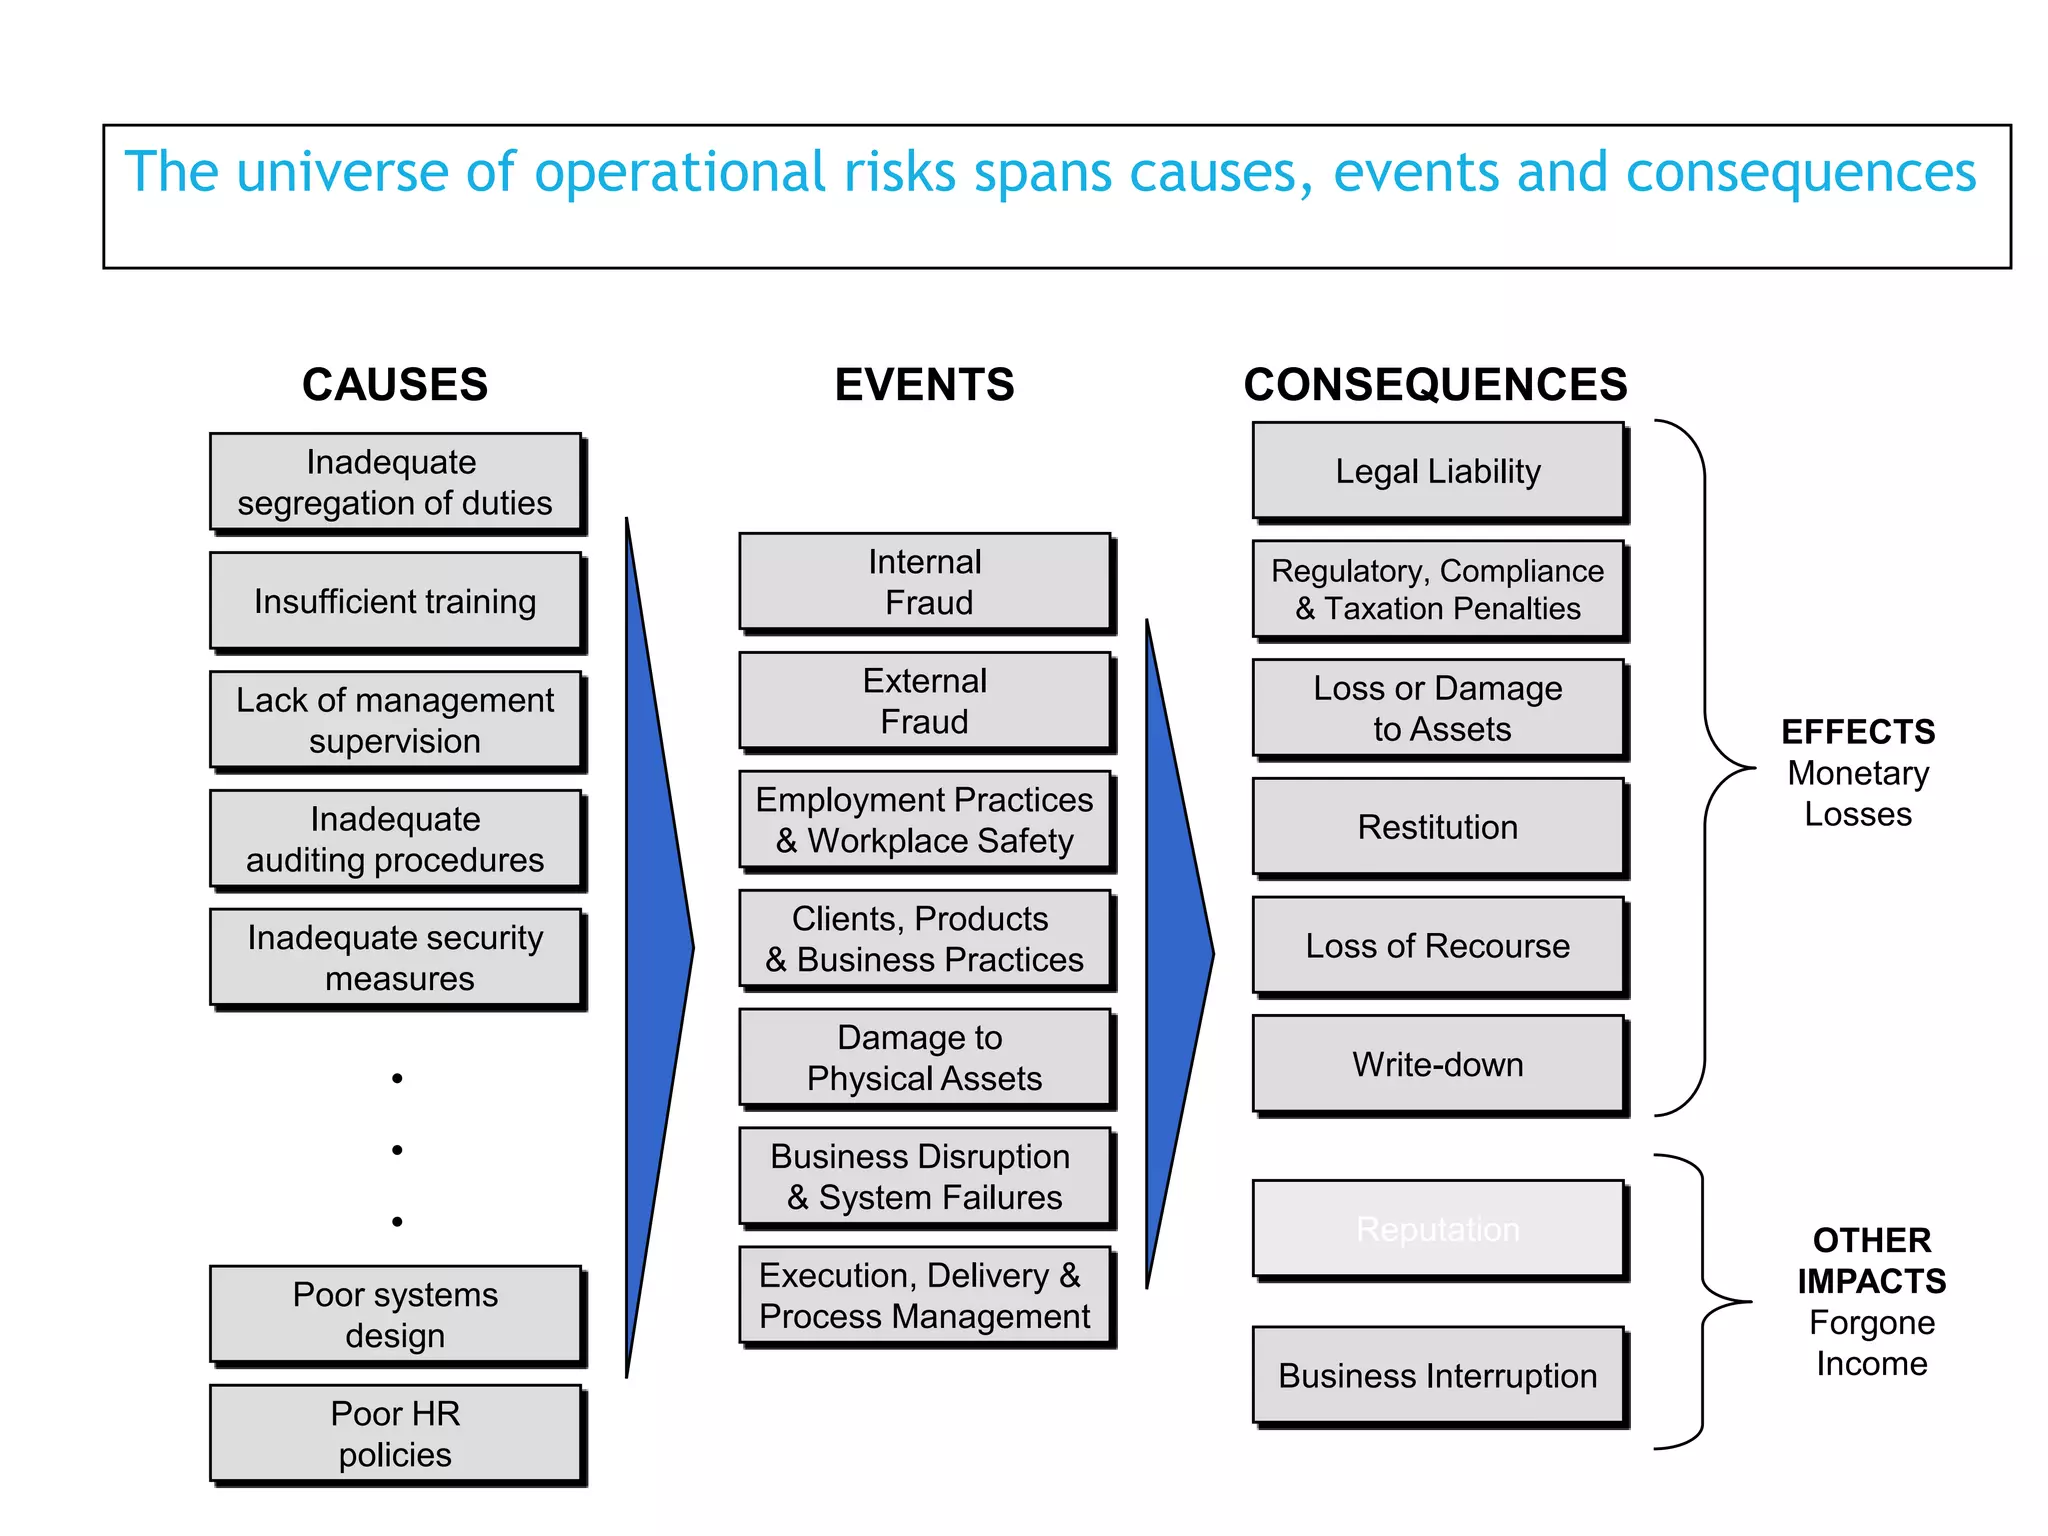
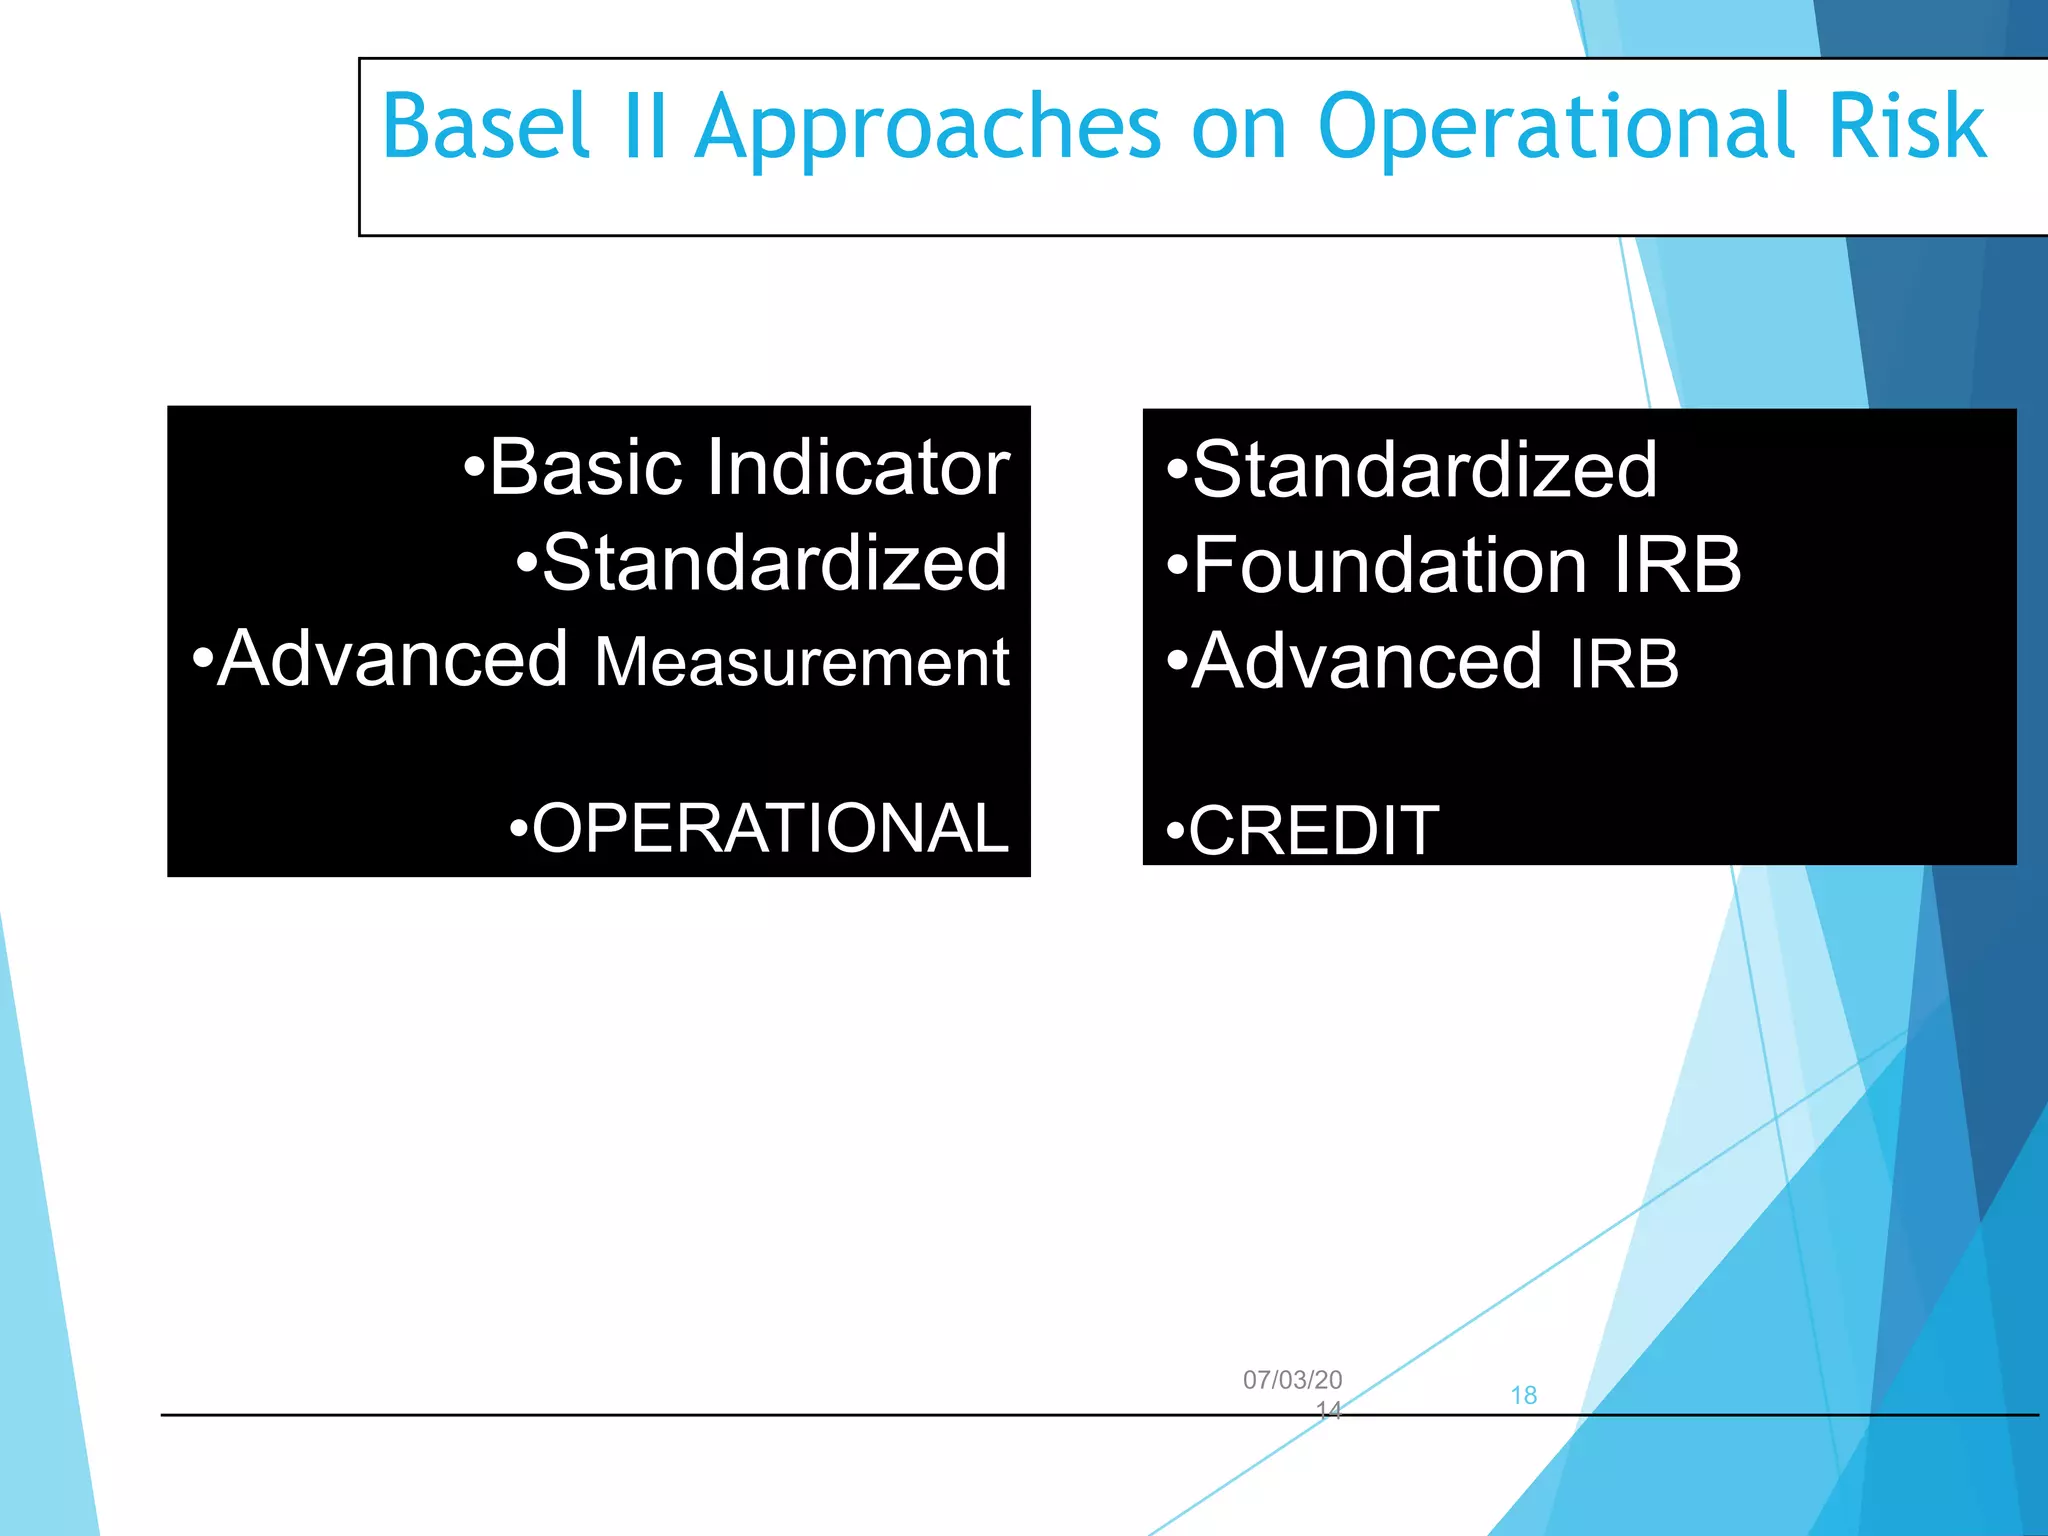
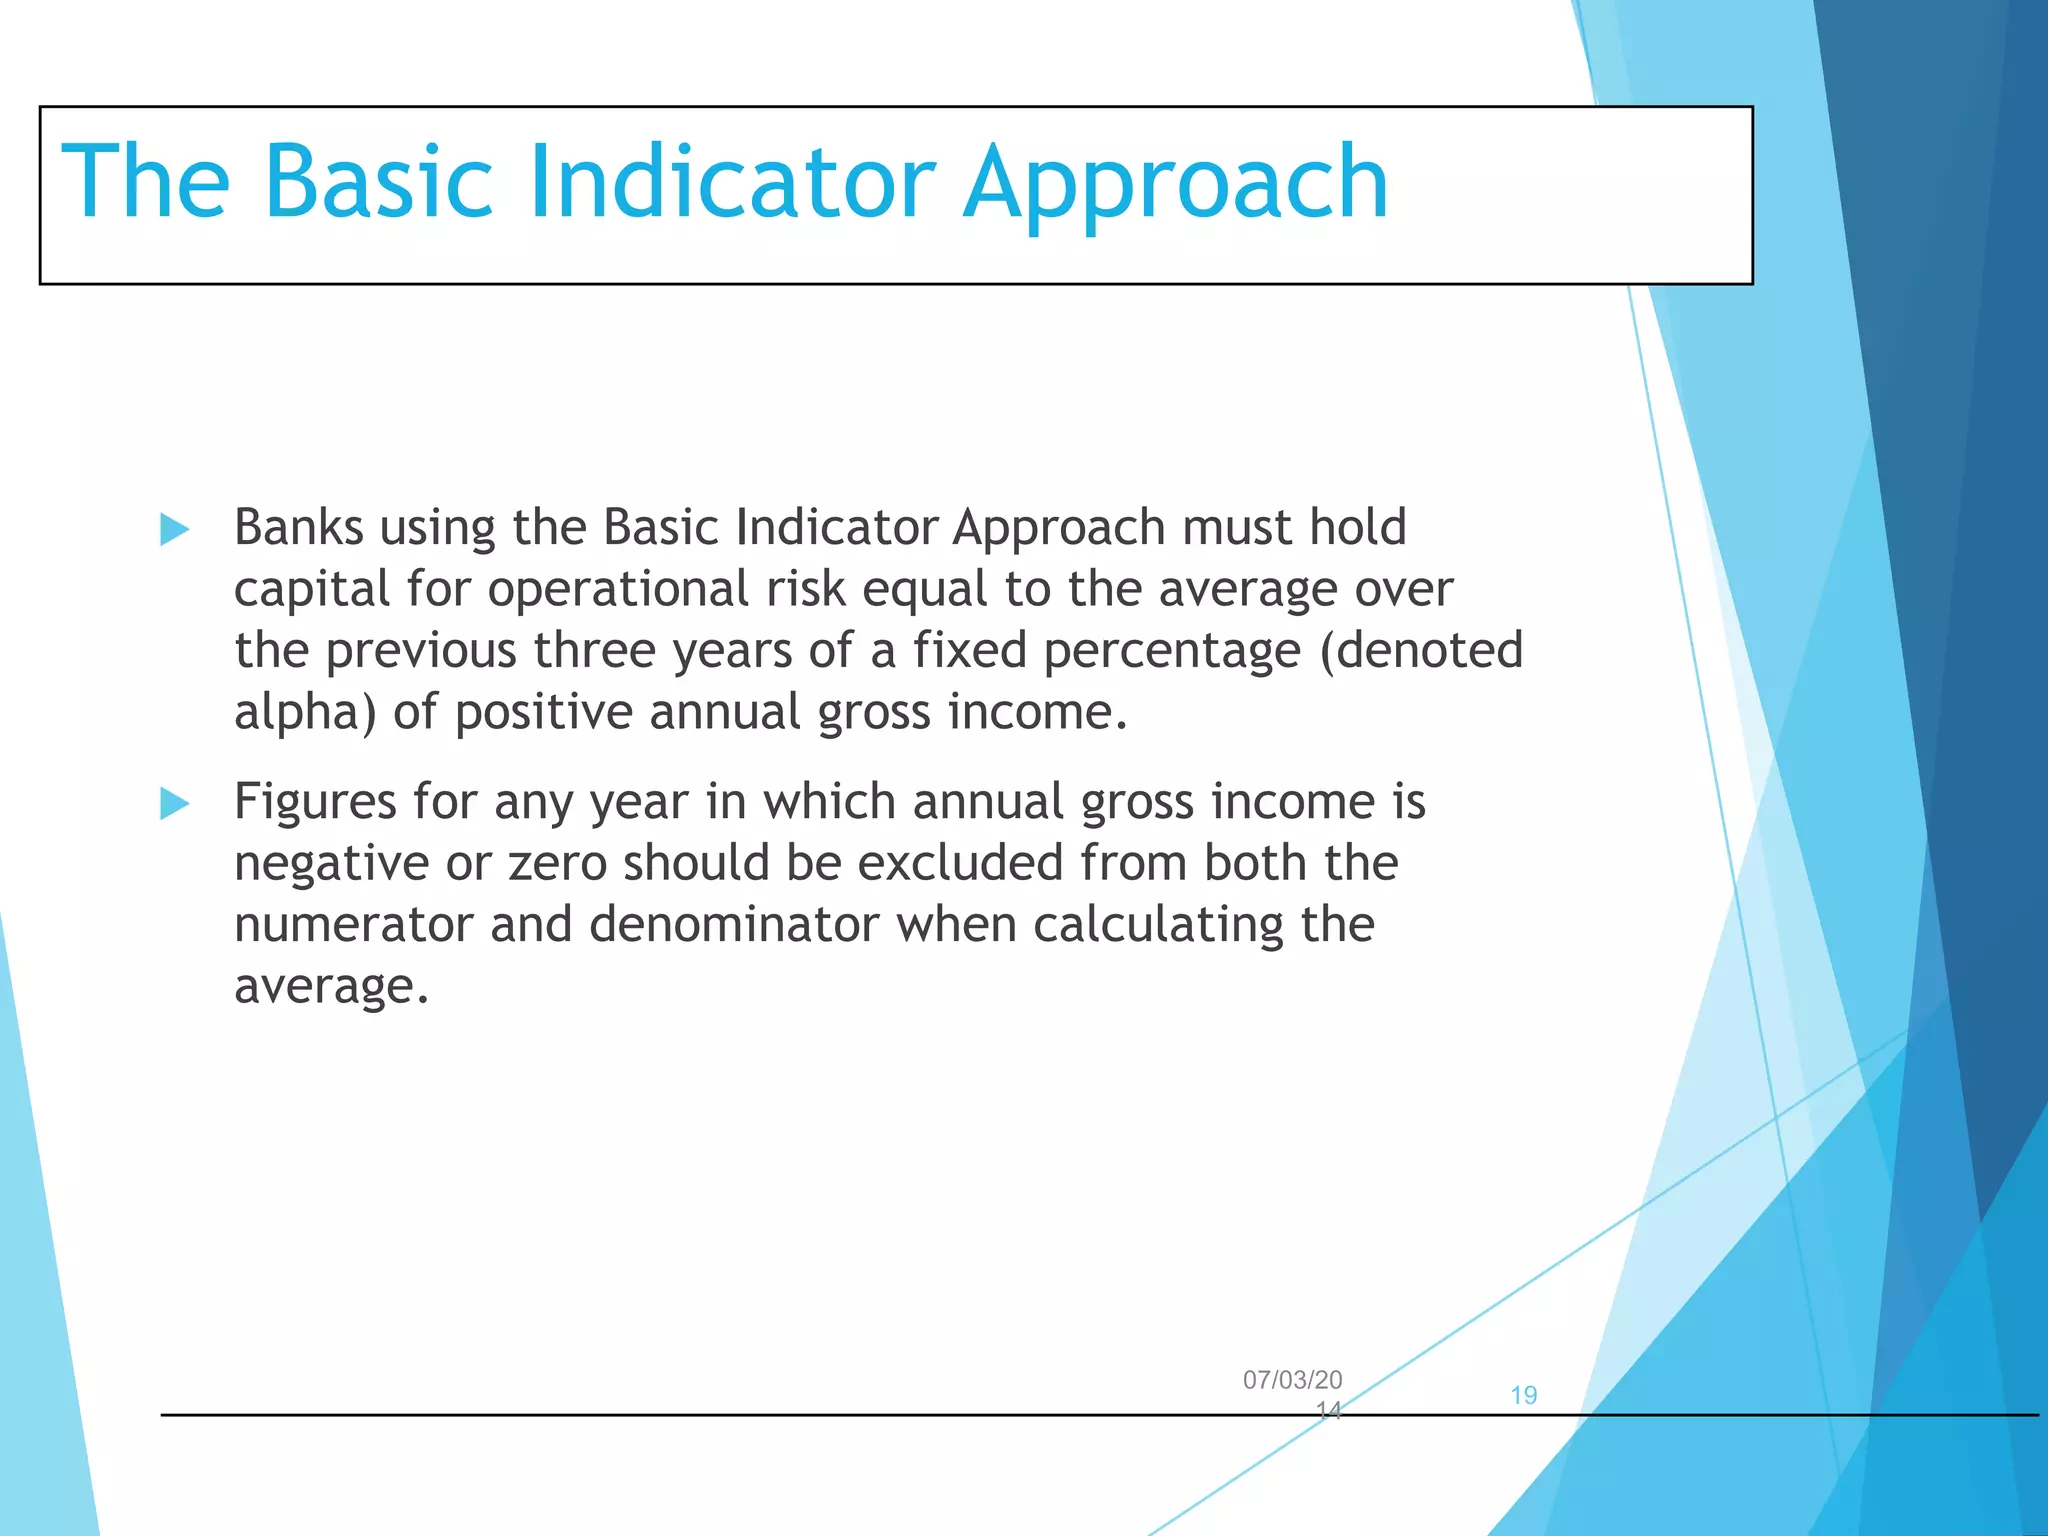
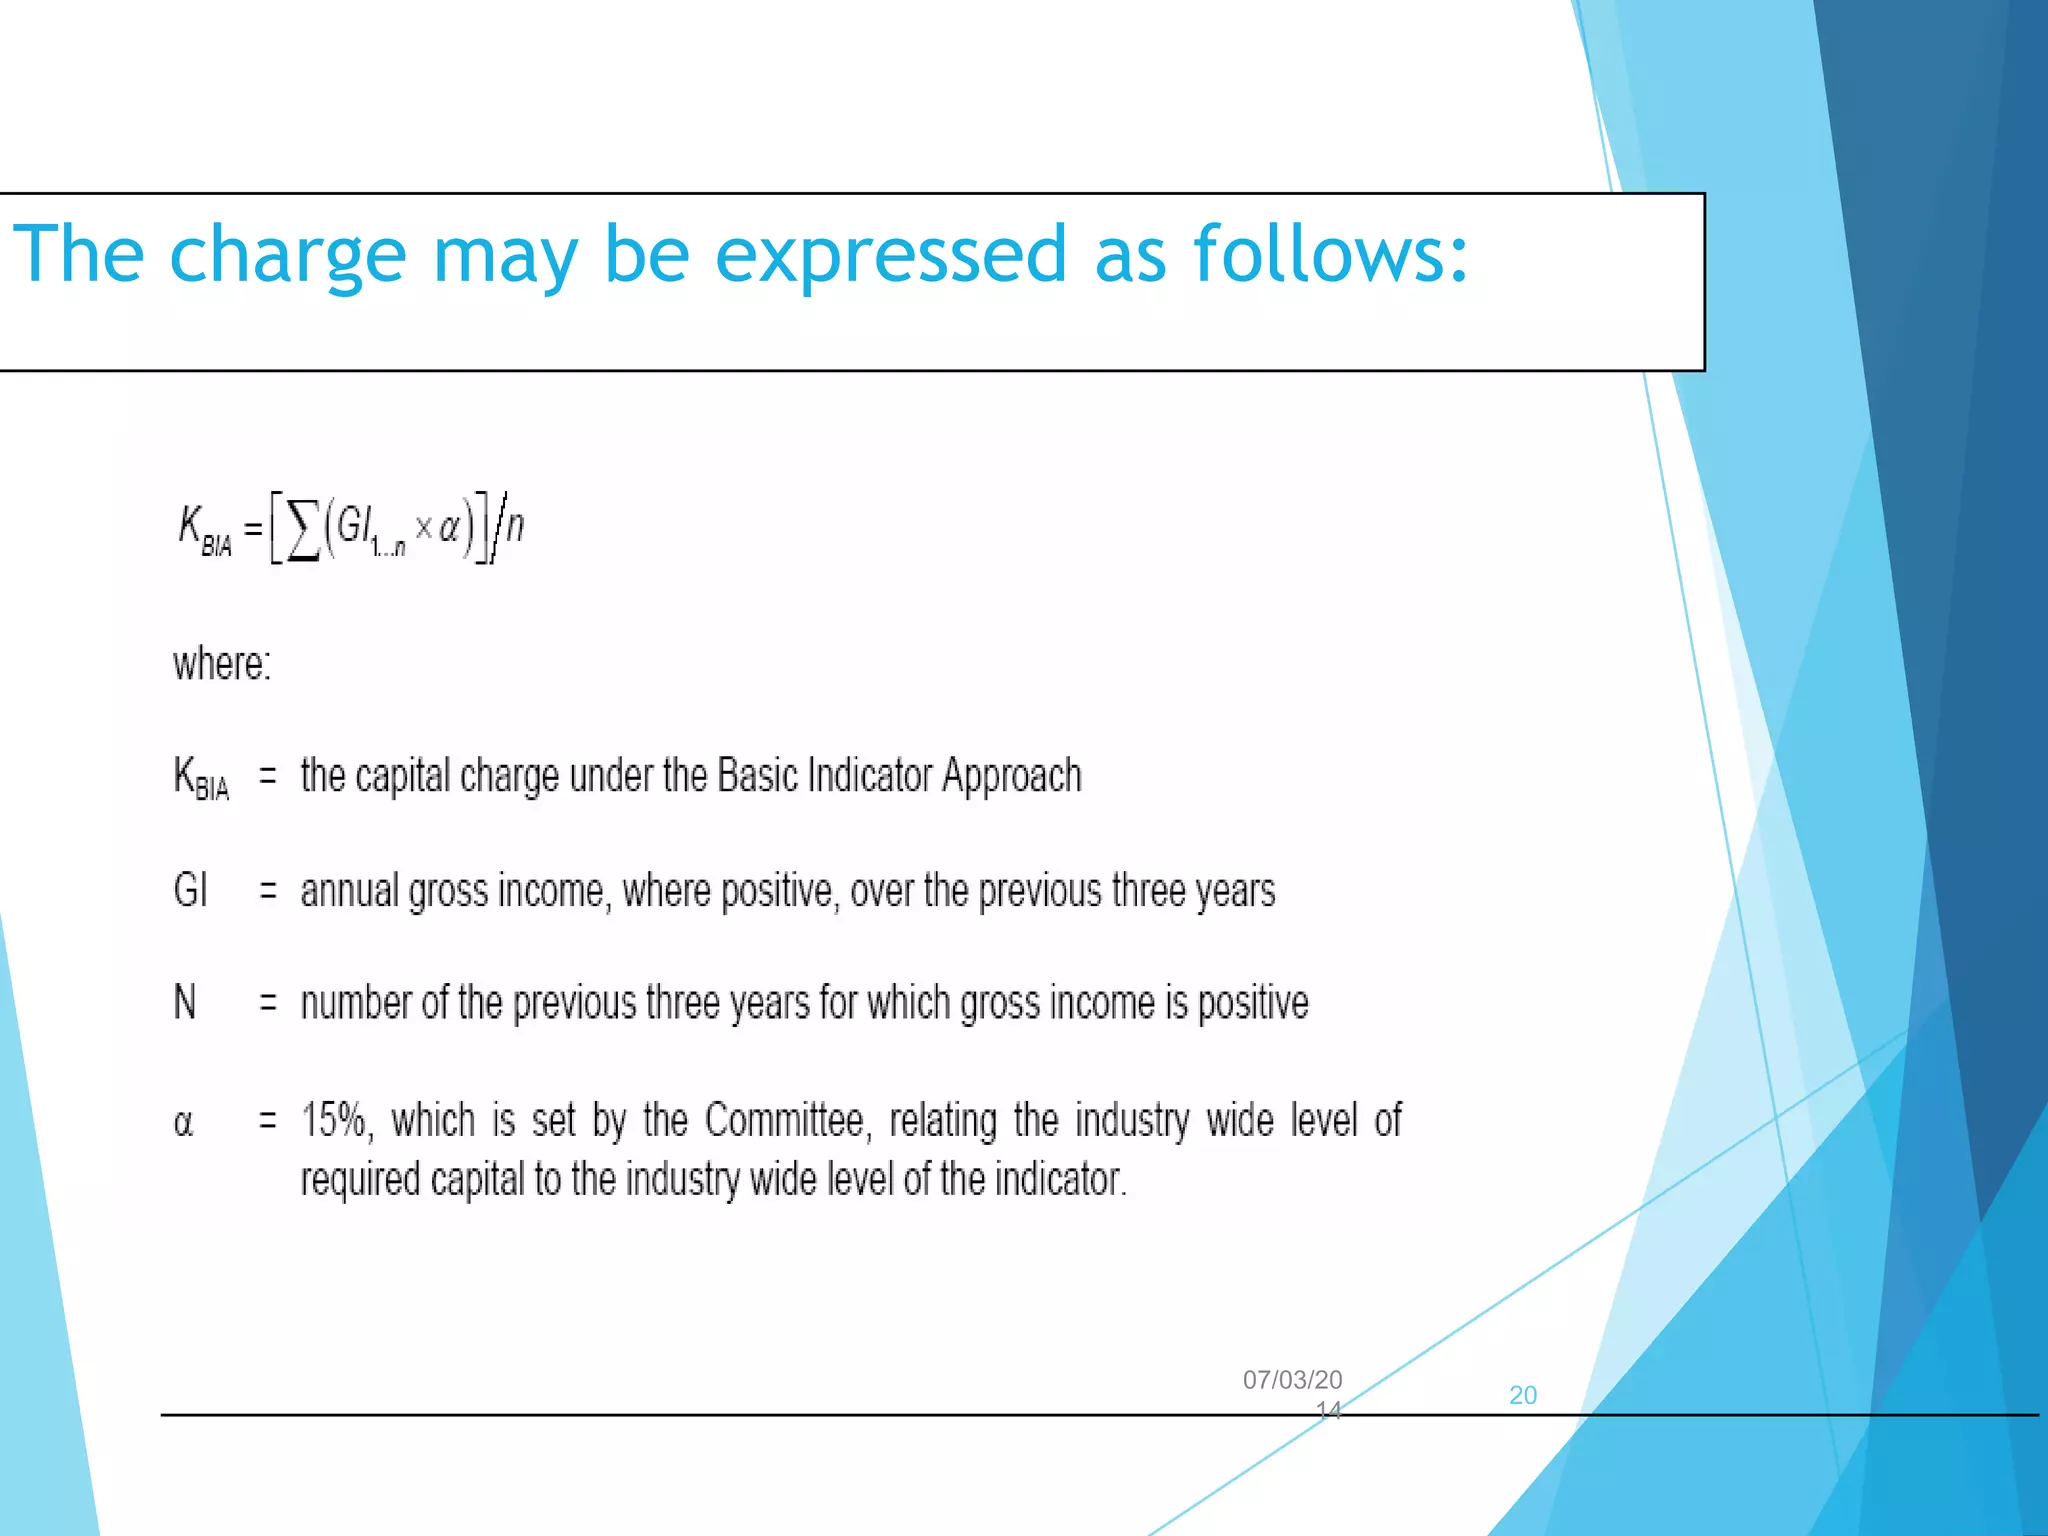
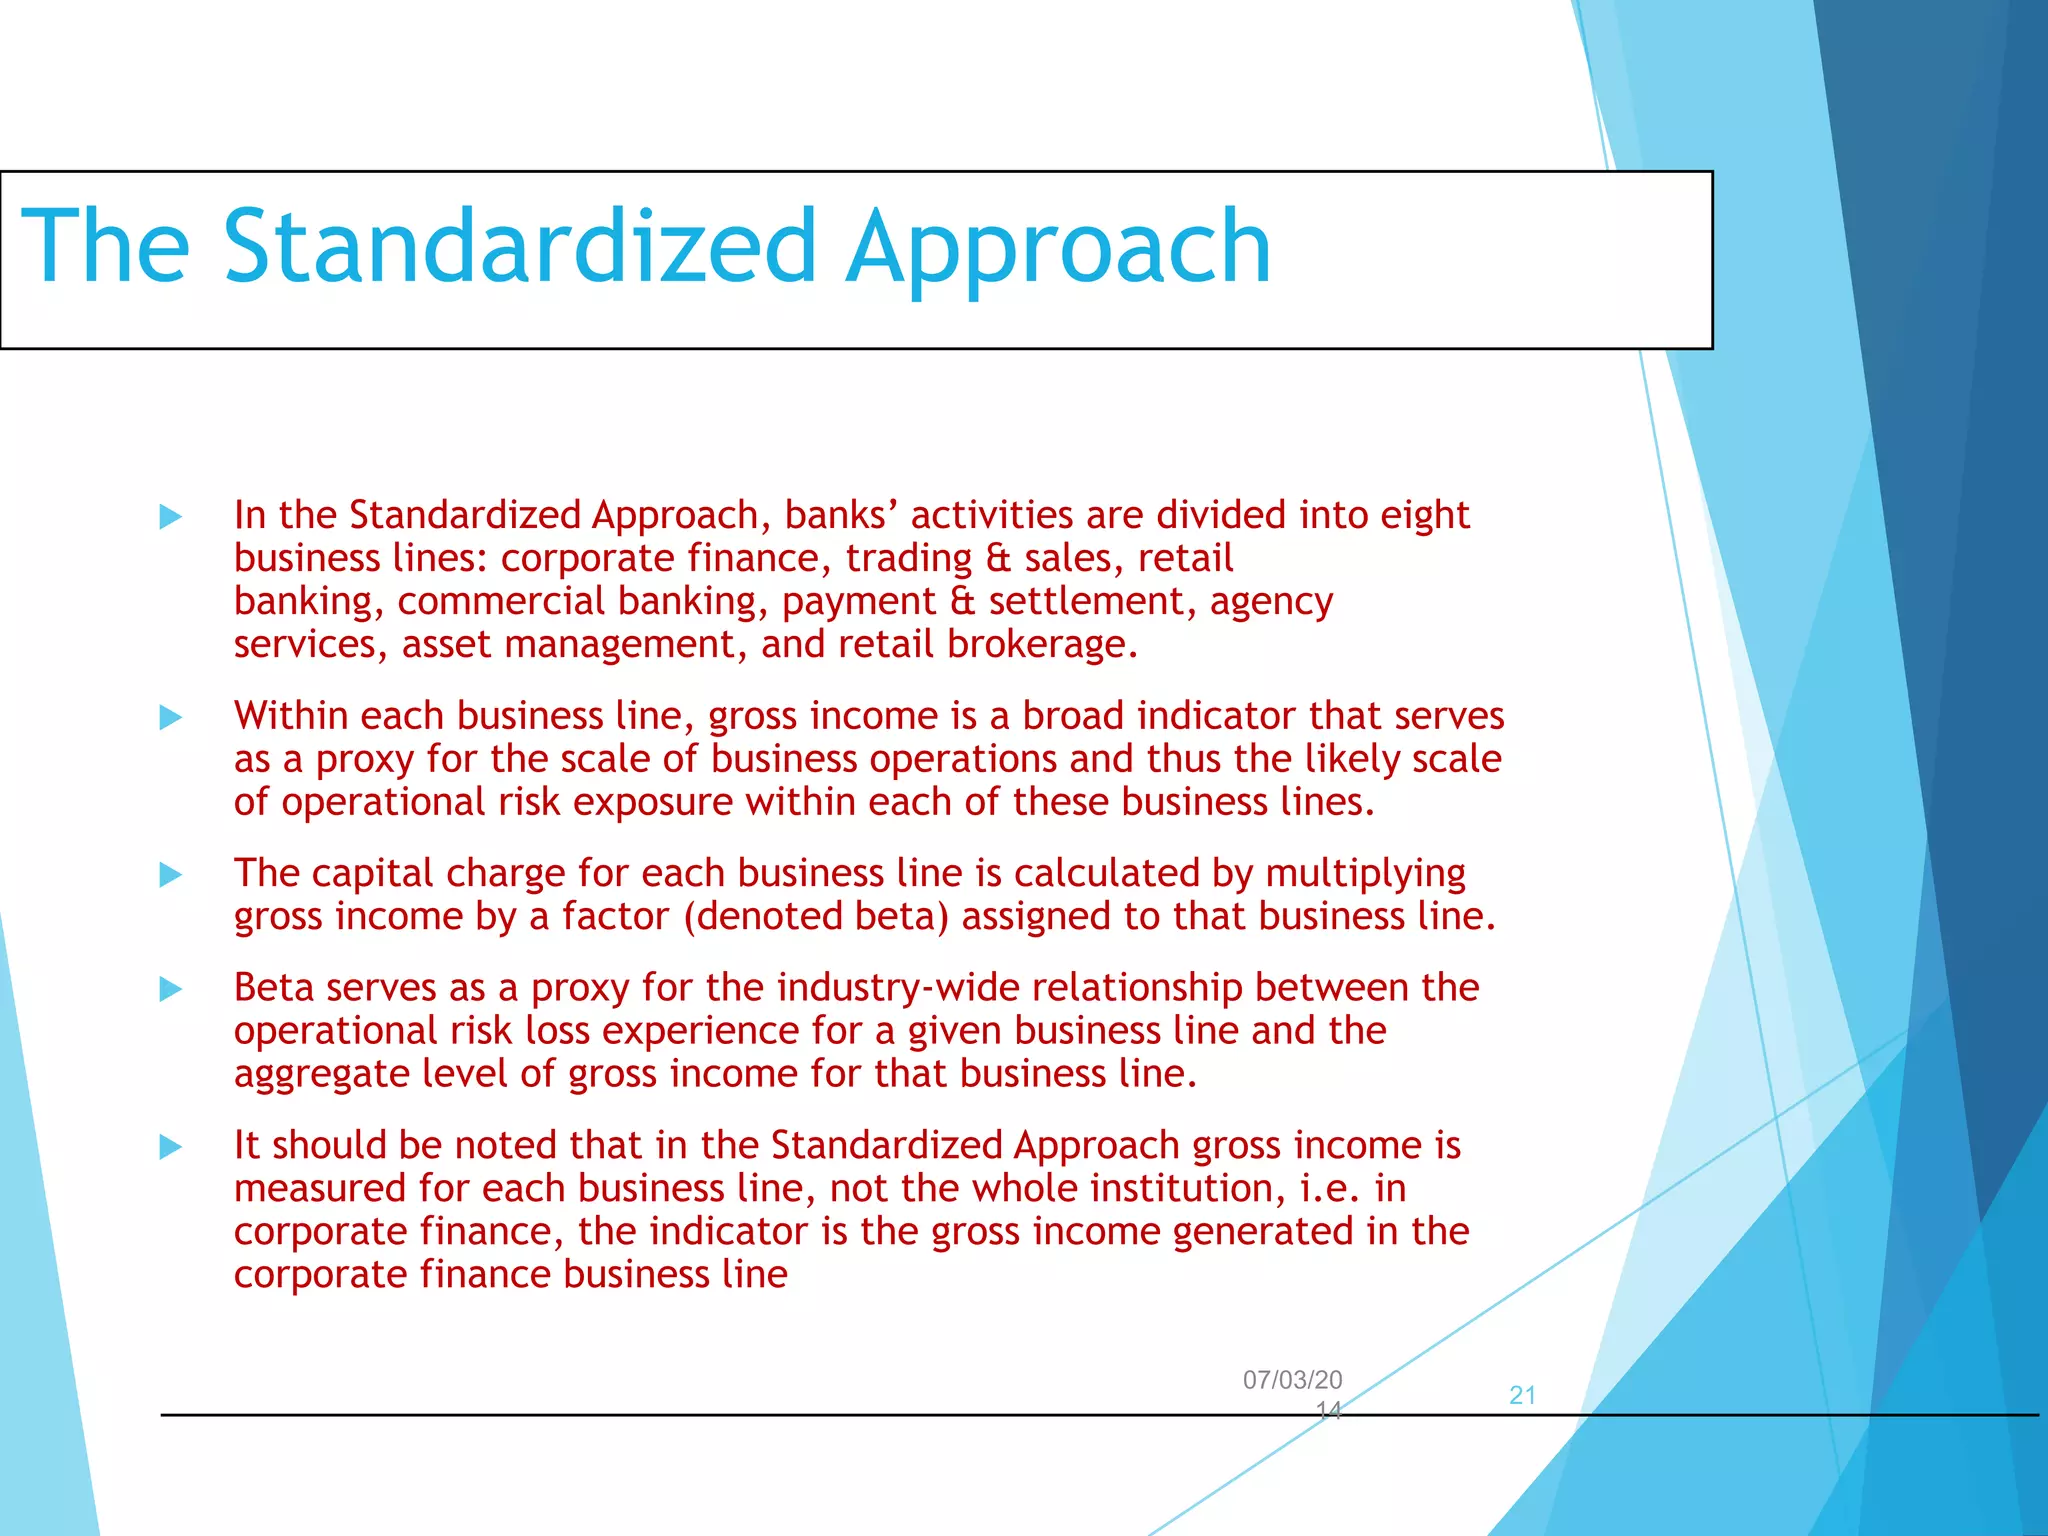
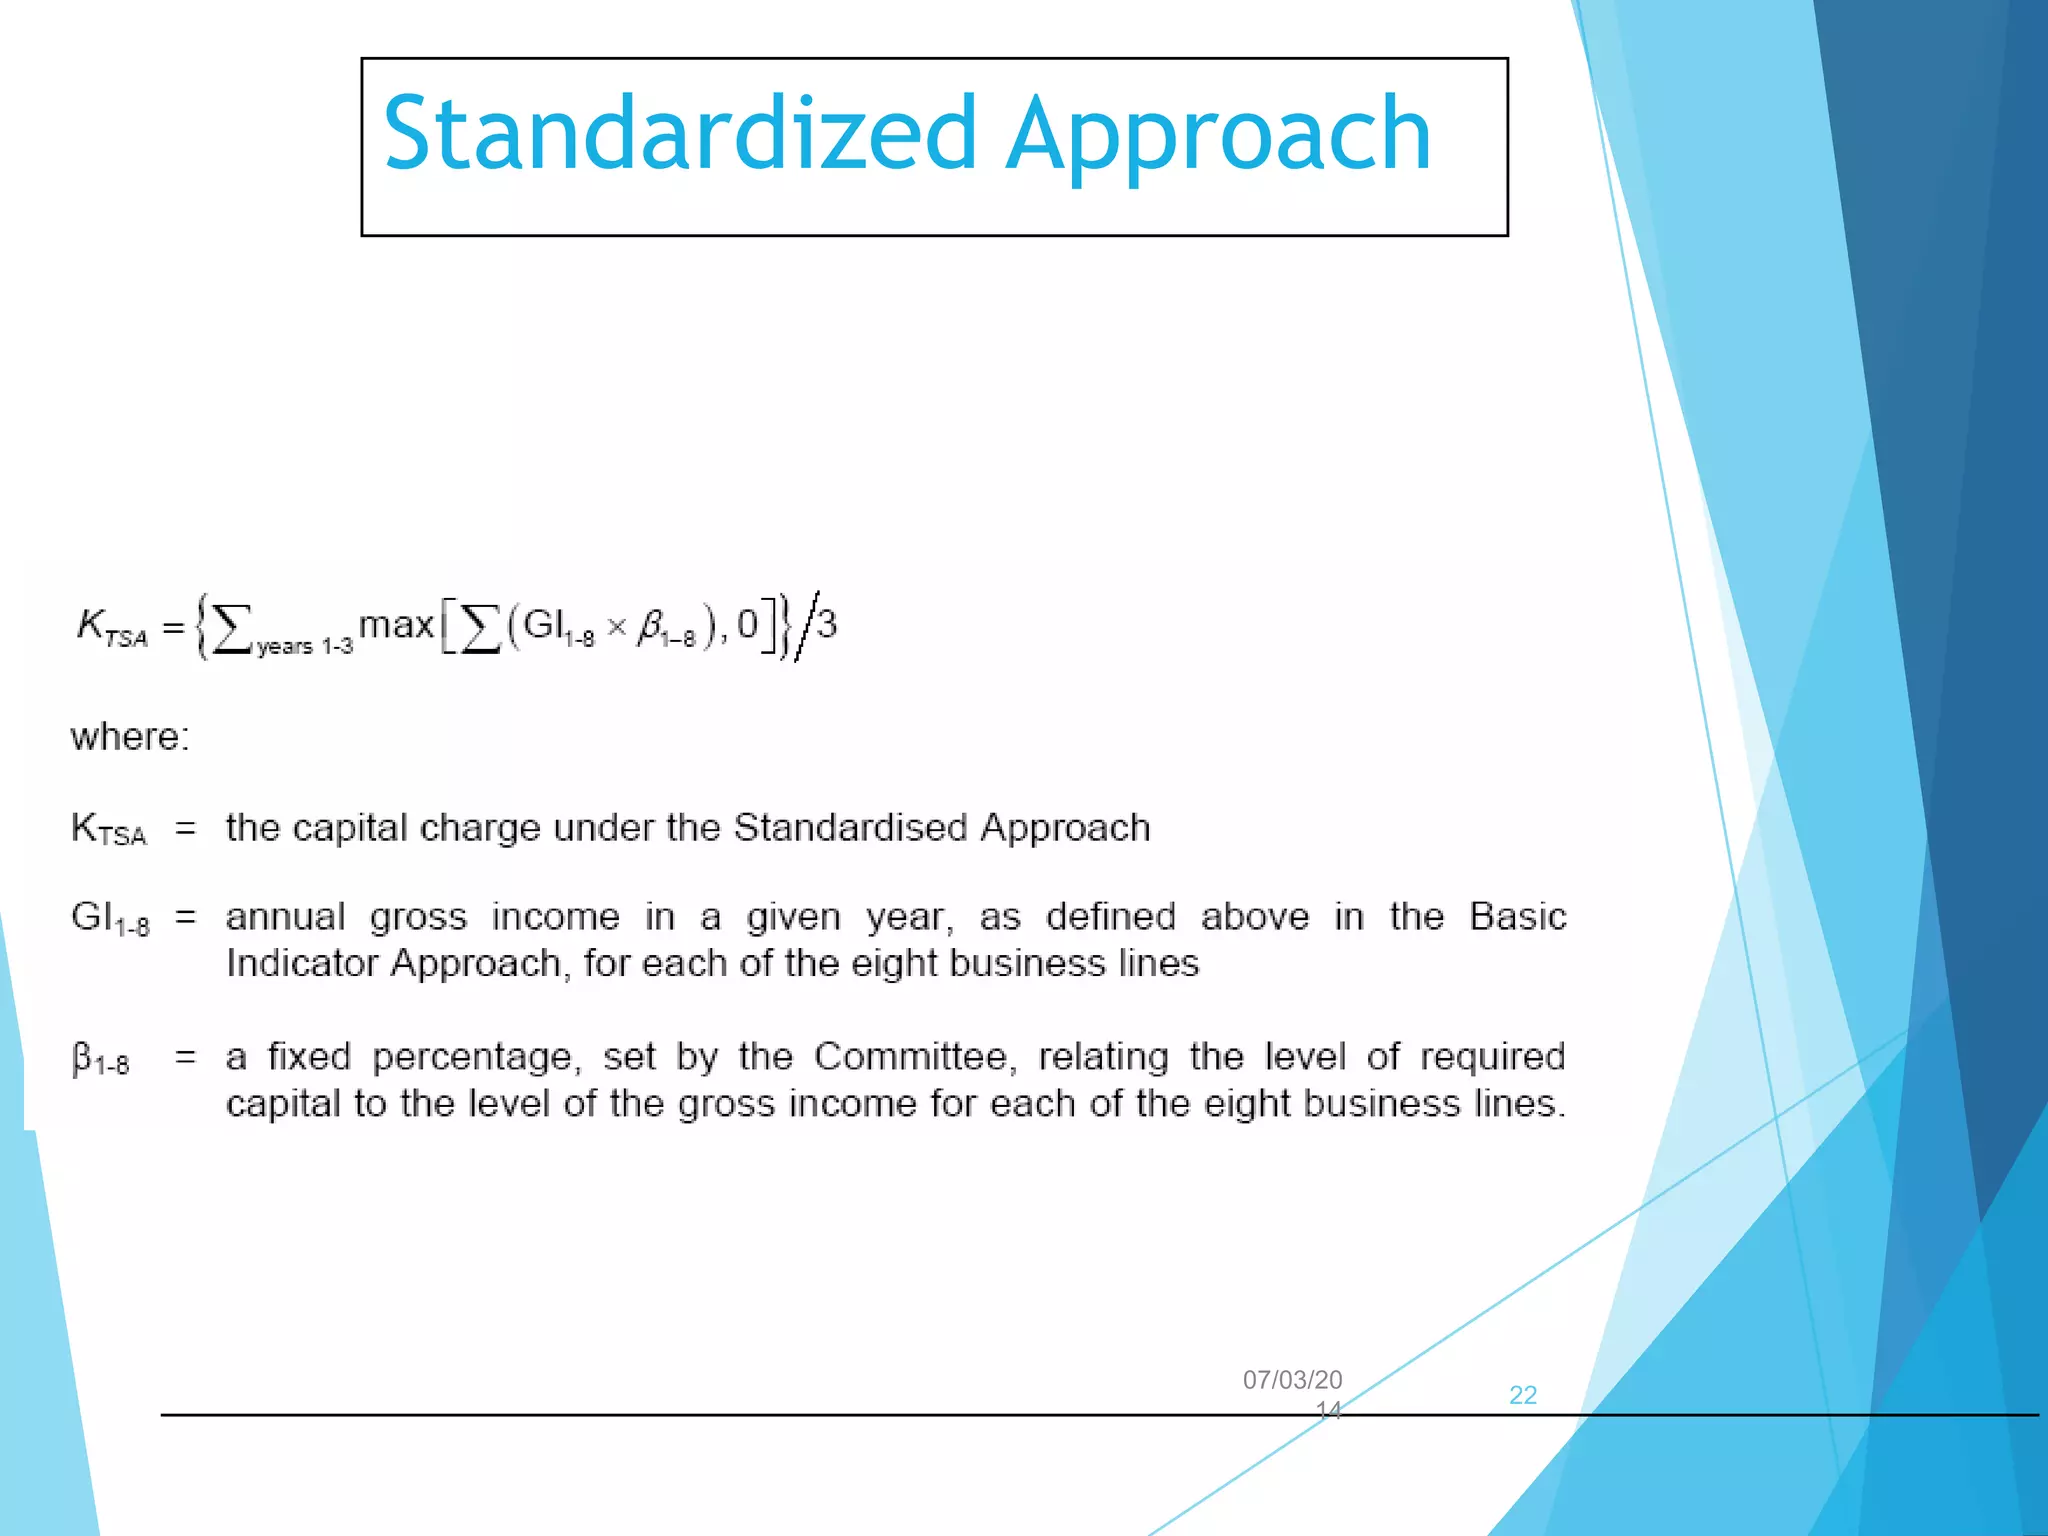
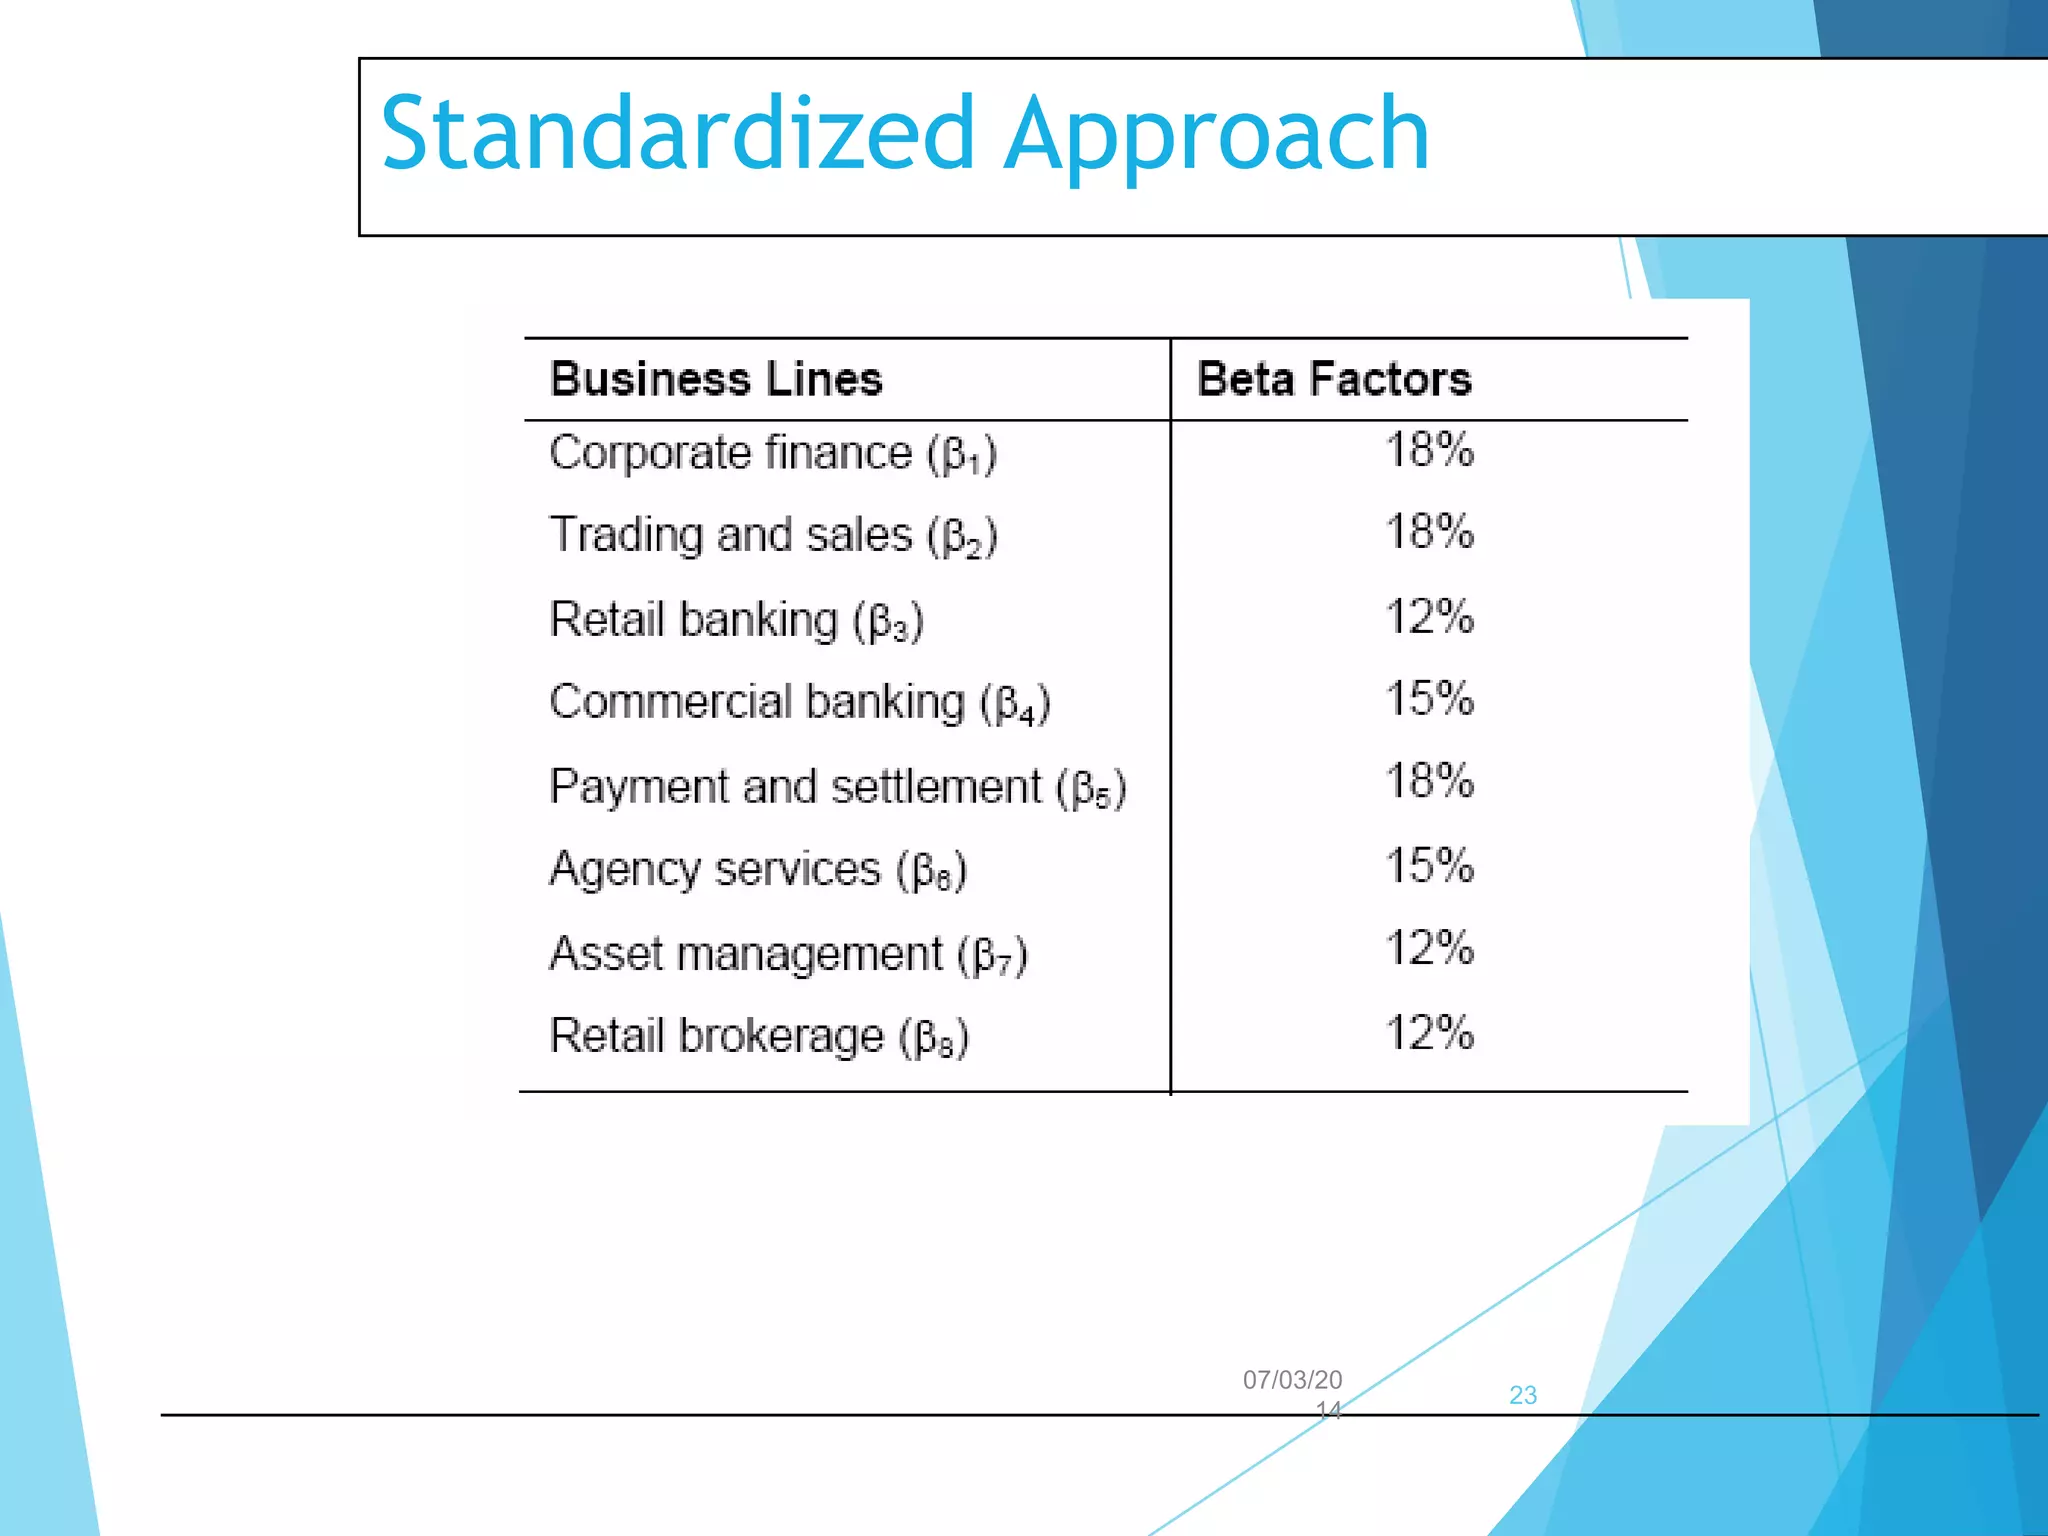
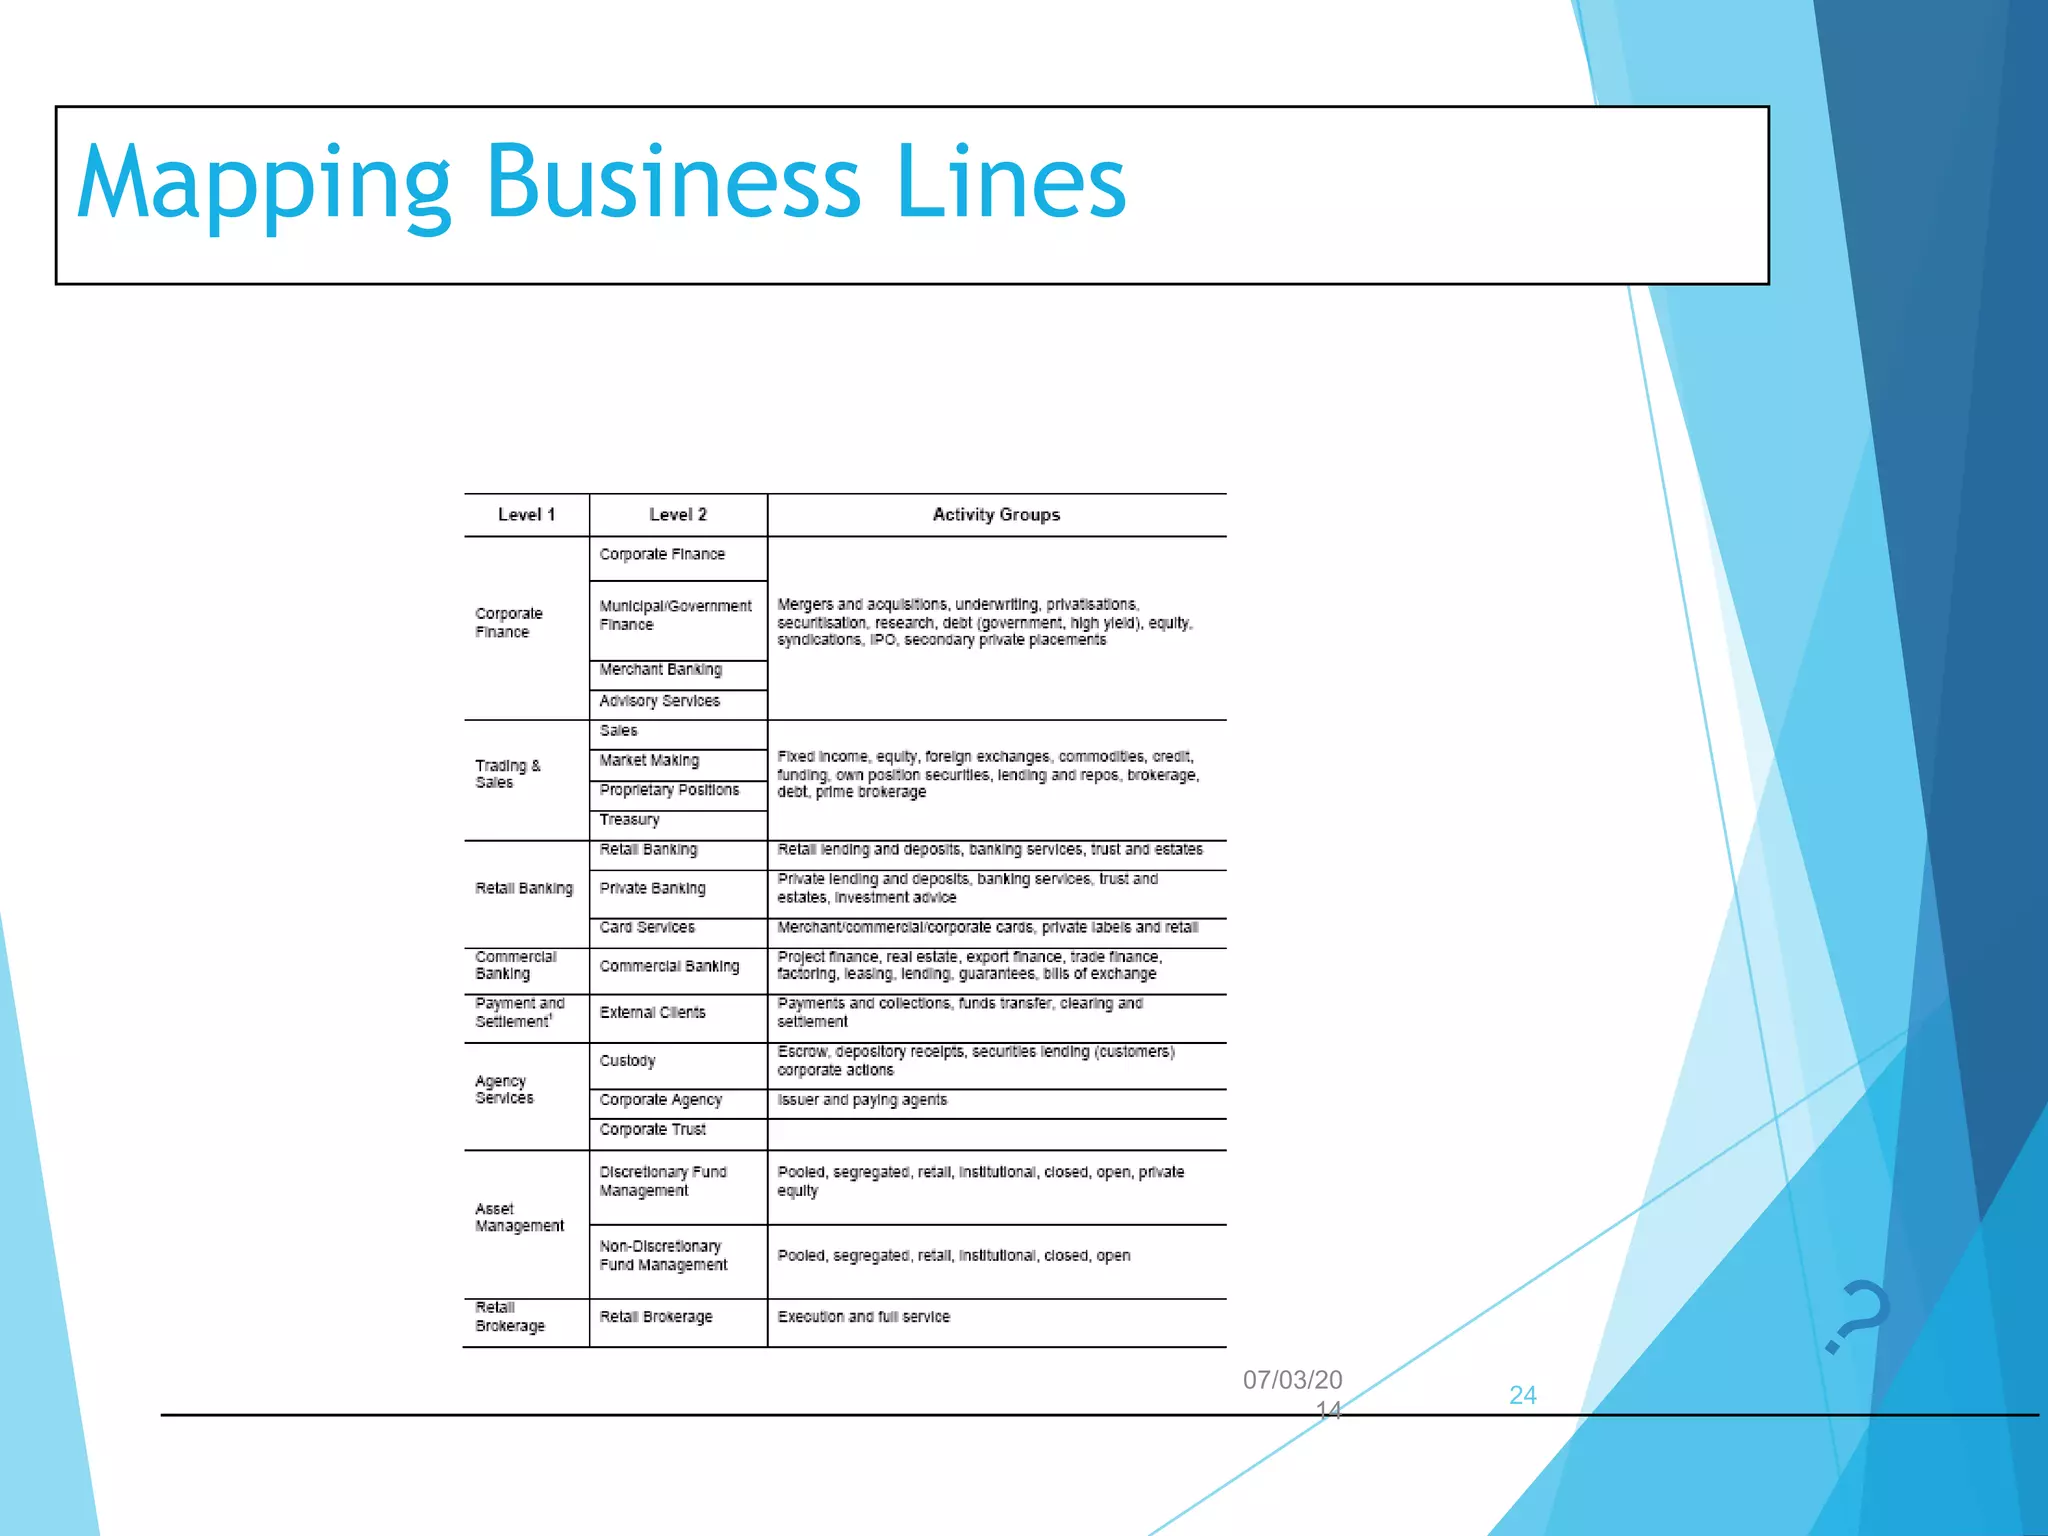

Operational risk can result in losses from internal failures or external events. It is classified based on frequency and impact of events. Management typically focuses on low frequency/high impact events and high frequency/low impact events. The Basel Accords define three approaches to operational risk capital requirements: Basic Indicator, Standardized, and Advanced Measurement. The Standardized Approach divides business activities into eight lines and assigns a beta multiplier to each line's gross income. The Advanced Measurement Approach uses banks' internal models to calculate regulatory capital.


