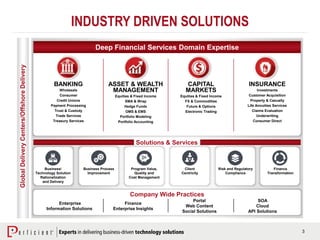
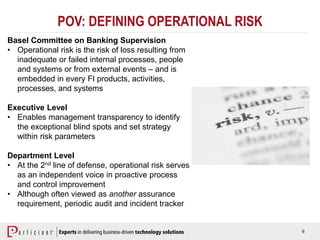
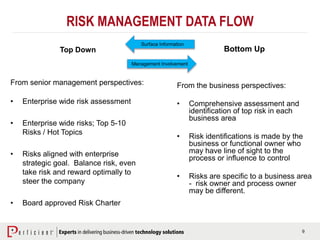
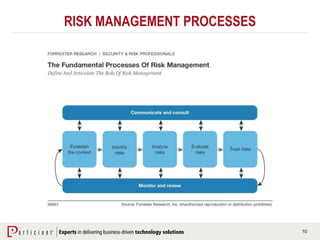
HOW TO DRIVE VALUE FROM
OPERATIONAL RISK DATA
JANUARY 29, 2015
2
ABOUT PERFICIENT
Perficient is a leading information
technology consulting firm serving
clients throughout North America.
We help clients implement business-driven technology
solutions that integrate business processes, improve
worker productivity, increase customer loyalty and create
a more agile enterprise to better respond to new
business opportunities.
3
GlobalDeliveryCenters/OffshoreDelivery
Deep Financial Services Domain Expertise
Enterprise
Information Solutions
Finance
Enterprise Insights
Portal
Web Content
Social Solutions
SOA
Cloud
API Solutions
Company Wide Practices
Deep Financial Services Domain Expertise
BANKING
Wholesale
Consumer
Credit Unions
Payment Processing
Trust & Custody
Trade Services
Treasury Services
ASSET & WEALTH
MANAGEMENT
Equities & Fixed Income
SMA & Wrap
Hedge Funds
OMS & EMS
Portfolio Modeling
Portfolio Accounting
CAPITAL
MARKETS
Equities & Fixed Income
FX & Commodities
Future & Options
Electronic Trading
INSURANCE
Investments
Customer Acquisition
Property & Casualty
Life Annuities Services
Claims Evaluation
Underwriting
Consumer Direct
Business/
Technology Solution
Rationalization
and Delivery
Business Process
Improvement
Program Value,
Quality and
Cost Management
Client
Centricity
Risk and Regulatory
Compliance
Finance
Transformation
Solutions & Services
INDUSTRY DRIVEN SOLUTIONS
4
ABOUT THE SPEAKER
Richard Brownstein, Director of Risk and Compliance, Perficient
Rich leads Risk and Compliance in Perficient’s Financial Services national
practice. He has more than 20 years of experience working for and with large
financial institutions in the areas of operational risk management, legal and
compliance, IT governance, and project portfolio management. He has a deep
understanding of industry challenges and best practices. Rich has a proven
track record leading strategic business, product and technology initiatives to
minimize risk and maximize effectiveness and efficiency for organizations.
5
WHAT WE WANT TO TALK ABOUT TODAY
• Introduction
• Drivers and Goals of Operational Risk
• Risk Identification
• How to Capture, Collate and Aggregate Data
• Leveraging Risk Intelligence
6
POV: DEFINING OPERATIONAL RISK
Basel Committee on Banking Supervision
• Operational risk is the risk of loss resulting from
inadequate or failed internal processes, people
and systems or from external events – and is
embedded in every FI products, activities,
processes, and systems
Executive Level
• Enables management transparency to identify
the exceptional blind spots and set strategy
within risk parameters
Department Level
• At the 2nd line of defense, operational risk serves
as an independent voice in proactive process
and control improvement
• Although often viewed as another assurance
requirement, periodic audit and incident tracker
7
ORGANIZATIONAL
BENEFITS
HIGH FUNCTIONING OP RISK
• Drives management awareness of the
business environment, controls and areas
requiring improvement – weak controls
unattended may result in losses, fines,
legal fees and regulatory actions
• Results in stronger manual or automated
controls allowing management to increase
investment and volume expectations due
to stabile operational capacity
• Leads to lower costs, stronger credit
rating and lower cost of capital; lower
Basel Operational Risk charges drives
profits
• Stronger risk measurement and
management may reduce frequency and
impact of negative news and reputational
impacts
8
MANAGERIAL
BENEFITS
HIGH FUNCTIONING OP RISK
• Obtain timely, accurate and complete
information and also up-to-date
information in time of crisis
• Focus on matters of most importance to
the organization and strategically allocate
or re-allocate resources
• Monitor the risks associated with the
strategic goals of the organization and to
address early, significant signs of
deteriorations
• Structured information providing focus on
key risks
• NOT bureaucratic process and paperwork
9
RISK MANAGEMENT DATA FLOW
Top Down
From senior management perspectives:
• Enterprise wide risk assessment
• Enterprise wide risks; Top 5-10
Risks / Hot Topics
• Risks aligned with enterprise
strategic goal. Balance risk, even
take risk and reward optimally to
steer the company
• Board approved Risk Charter
Bottom Up
From the business perspectives:
• Comprehensive assessment and
identification of top risk in each
business area
• Risk identifications is made by the
business or functional owner who
may have line of sight to the
process or influence to control
• Risks are specific to a business area
- risk owner and process owner
may be different.
Management Involvement
Surface Information
10
RISK MANAGEMENT PROCESSES
11
WHAT IS A RISK ASSESSMENT?
RESULTS PROCESSES CHALLENGES
Identifies Inherent Risk Gives big picture to senior
management
Lack of knowledge of firm’s vulnerability
by senior management and personnel
Tabulates Controls Identifies policies, procedures,
processes, key operating procedures
Lack of knowledge about control and
firm processes
Catalogs Residual Risk Identifies areas requiring attention Lack of knowledge of risk associated
with each business
Manages resources to
focus on top control
Issues
Identifies areas requiring most
attention
Lack of knowledge of gaps in policies,
procedures and processes
Allow risk taking within
capacity
Identifies areas of opportunity and
growth
Business is not taking full advantage of
existing platform, technology and
expertise
12
• Each Inherent Risk or regulatory
rule is evaluated for each
business activity or transaction.
• Each regulatory rule has one or
more controls, perhaps
registered in the control library.
Each control is evaluated for its
design and operating
effectiveness. The resulting
score is the Residual Risk.
• Assessment, findings, action
items logged into GRC tools
ASSESSMENT PRINCIPLES
13
RISK ASSESSMENT ARCHITECTURE
BUSINESS CHALLENGE:
 Senior management and key
personnel were not fully aware of the
firm’s top risks
 Key personnel were not fully trained
in the risk assessment process
 Key personnel were not fully aware
of the risks within their businesses
 Key personnel were not fully aware
of rules, regulations and best
practices impacting their businesses
 The data from the firm’s GRC was
not managed properly resulting in an
attempt to managed data through
multiple excel spreadsheets
SOLUTION AND SERVICES:
 Perficient met with risk, compliance and
businesses to understand products and
services offered, overall process and
management of GRC tool.
 Perficient created an inventory
questionnaire together with senior
management to help business heads
catalog products and services offered
 Perficient created a regulatory matrix
control and together with senior
management identify the regulations
and requirements for each business
 Perficient created regulatory and
processes questionnaires similar to
information used by auditors or
examiners
 Perficient worked with GRC vendor to
facilitate that the GRC tool to support
the risk assessment process
RESULTS:
 Senior management and key
personnel became aware of all
products and services offered
within the firm
 Key personnel and management
became aware of rules, regulations
and the requirements impacting
their businesses
 Personnel identified controls
within their businesses and
identified related gaps
 Personnel becomes more
knowledgeable in the processes
used by auditors and examiners
 Client is working towards ensuring
all data and reports on risk
assessment are management
through one source data derived
from the GRC
14
SOURCES OF OPERATIONAL RISK DATA
Bottom Up – Experiences in the department or field
Periodic RCSA or Business Operating Reviews
• Performed in different ways, as a questionnaire or discussion based, the business
owner and support partners (1st LOD) inventory risks, score controls resulting in key
control issues
• Aggregating KRIs drive organizational priorities
Key Risk Indicators
• Data driven measures, metrics, exceptional breaches  drives response
• Metrics that matter rather than binders of data
Incidents and Lessons Learned (internal and external)
• Policy mandated loss and near-miss capture allows for frequency X impact analysis
• Scenario analysis and read-across to similar processes  +ROI
• IT help desk – users log near-misses and manual workarounds
Top Down
• Strategic plans / budgets inform 1st LOD where to set capacity
• Emerging risks – industry, regulatory, political, economic, social, technology
15
LEVERAGING
OPRISK DATA
Bottom Up
• Transparency of Blind Spots; Action
Priority - risk identification, quality of
controls (design/effectiveness) and residual
risk
• Budget - Priority projects; allocation of
shared service projects
• Patterns/Trends – determine correlation
drivers (volume, seasonality)
• Incidents – Improves scenario & stress
analysis
• Loss Data – input for Basel models
• GRC Data – aggregate findings from risk,
compliance, audit, regulators sets roadmap
Top Down
• Risk Appetite / Risk Tolerance – Capacity
to take on more risk
• Regulatory Attestations
16
AGGREGATING
RISK DATA
• Governance refers to the enterprise
consolidated, integrated view
• Applies to business rules and limits that
are not department, LOB or product
specific, or in a silo
• Promotes visibility, transparency and
data reuse for each area of assurance
(risk compliance & audit) across the
enterprise
• Tools enable Business Intelligence (BI) –
integrate diverse and disparate data
sources  Dashboards
• Historical measures lead to risk
aggregated lead to Predictive BI
Leverage tools and Structured Data to
drive +ROI and Risk Intelligence
DRIVES RISK INTELLIGENCE
17
UNSTRUCTURED & STRUCTURED DATA
Structured Data
Enhance  Aggregate  Interpret Score with Risk Analytics
Unstructured Data
Collect  Interpret  Score
18
ORM OFFICE STRUCTURE
Front Office
Local Control Officer
• Located with and has deep
business & function SME
• Assess and analyze business
and regulatory risks/controls
• 2nd LOD – earned seat at the
table
Middle Office
Risk Infrastructure
• Sets or executes risk policies
& procedures and taxonomy
• Interacts with assurance
groups (Compliance & Audit)
• Prepares/Leads Risk
Committee
• Reputation as an OpRisk
SME
Back Office
Risk Operations
• Expert users in GRC tools
adding leverage to risk
FO+MO for desk exams and
MI reporting. Drives risk
transparency and auditability
• Potentially training center for
Risk or broader organization
• Potential near-shore location
To build a high-performing risk organization, the target operating model will be best-in-
class over time. Each segment and job function must be fit for purpose.
• Assess current operating processes and leading practices to improve mandates,
policies, procedures, people, process, technology, SLA and metrics
• Rather than a homogeneous risk function – each function’s roles and reputation
will become focused, specialized and drive expertise
19
ENTERPRISE RISK MANAGEMENT ADOPTION
• Engagement from the 1st Line of Defense
is a key to success for adoption
• Steps to improve engagement vary
based on culture. Other success factors
are:
- Consistent processes and standards
- Interaction and monitoring from the
ERM Office
- Mandate or tone-from-the-top
• Key steps in aiding the BU owner’s
adoption of an effective risk assessment
program:
- Developing policies and procedures
- Communicating broader delivery
expectations and framework
- Training executives and staff
Identify Key
Risks &
Gaps
Set Policy &
Procedure
Communicate
to LOB
Communicate
Timeline &
Framework
Educate LOB
“How To”
Perform Risk
Assessment
Drive
Interaction
through ERM
Framework
Monitor &
Evaluate
Results
Adjust
Process
Repeat ERM
for New
Cycle
TuneExecution
20
STRATEGY &
CULTURE
• Risk tolerance/thresholds
- Qualitative/quantitative
• Risk appetite for each category
- Linked to strategy
• Risk culture
• Impact of not linking: market cap
more often declines due to flawed
strategic decision rather than OpRisk
• Assurance groups don’t focus on or
link strategy
21
GOVERNANCE
• Policies
• Committees – Risk Charter
• Roles and responsibilities
• BU risk liaison
- Independent and in CRO org
• Talent and training
• ORM  ERM (correlation of risk
categories)
• Review and ensure risk
tolerance and appetite aligns
with enterprise strategies and
visions
22
StrategySettingProcess
Board / Senior Management
Risk Committee
Risk Appetite Risk Capacity
aEmerging Risks Risk RegisterRegulatory MRA
ORM Office – 2nd Line of Defense
Risk ID Internal Incidents RCSAs
Key Risk
Indicators
Risk Register
ROLE-BASED CONSIDERATIONS
aExternal Incidents
Top Risk Themes/
Scenarios
BU – 1st Line of Defense
TopRiskIDRiskAppetiteRiskCapacityNBILimitSettingCapacity
Risk RegisterOperating Plan /
Budget
Strategic Plan
18-24MonthsTimetoExecute3Months
23
RISK CONTROLS ANALYSIS
BUSINESS CHALLENGE:
 US Super Regional subsidiary of a
global bank established a priority to
update all operational process,
procedure, and internal operational
and regulatory control
documentation for the consumer
banking lines of business.
 Regulators required the bank to
achieve a strong level of risk
management practices for all lines
of business.
SOLUTION AND SERVICES:
 Perficient reviewed existing
operational procedures and risk
control libraries.
 Conducted interviews and work
sessions with key business
stakeholders across 16 consumer
banking business units to analyze,
achieve consensus and document all
core business processes across the
lines of business.
 Developed process maps for more
than 100 core business process and
their associated sub-processes.
 Working with risk managers,
reviewed contents of risk control
libraries, mapped relevant risk
controls to core processes, identified
control and developed
recommendations for updated
controls.
 Interfaced with enterprise risk
assessment to develop end-to-end
product risk assessments utilizing
process maps and risk controls
analysis deliverables.
RESULTS:
 Implemented a multi-track effort
with key business and risk
management stakeholders to
analyze and document core
business processes across the
entire Consumer Banking group
distribution and lending business
units.
 Delivered a robust and
maintainable business process
analysis and mapping document
incorporating operational and
compliance controls mapped to
process activities.
 Reviewed existing risk controls
library and identified regulatory
and operational control gaps for
more than 100 core processes
and several hundred sub-
processes across consumer
banking.
24
RISK
CLASSIFICATION
• Legal and Compliance
• Fraud (Internal / External)
• Execution, Delivery and Process
• Products and Business Practice
• Third Party, Vendor, Counterparty
• Strategic / Policy
• Financial
• Service Delivery or Operational
• Employment Practice, Workplace Safety
• IT, Business Disruption
• Privacy / Security
• Environmental Factors / External
FOR FINANCIAL FIRMS & INSURERS
25
PROTOCOLS &
TAXONOMY
• Develop comprehensive dictionary of risks
• Use same language for similar processes
• Use consistent approaches for risks
identification, responses and escalations
• Apply critical thinking
• Ask for data once > Reuse
• Use technology (GRC tool) to capture and
aggregate risks
26
CONTROLS
• Process mapping/Control libraries
• Risk identification and recognition
• Key risk indicators (KRIs)
• Risk assessment
• Risk monitoring
• Loss data capturing and reporting
27
RISK TREATMENT
28
OPTIMIZING ORM PROCESSES
Identification, categorization and prioritization results:
• Prioritizes/escalates high-frequency/high-impact operational risk events to
management or the Board while alerting BU of mid/low risk events
• Take preventative measure to timely correct deficiencies
• Recognize trends and emerging risks and take action
• Aggregate operational risk losses for reporting
• Loss data serves as input for capital planning and the CCAR (Comprehensive
Capital Analysis Review) process
29
WHAT ARE REGULATORS LOOKING FOR?
Board of Directors directives are effective and are being followed:
• Senior management must ensure that adequate policies, processes, procedures including
technology are in place to support the enterprise risk appetite of the firm
• Senior management needs to ensure businesses are managed by staff with experience
and knowledge about their area of responsibility
• Senior management must remain flexible to respond to competition and innovation in the
industry (affecting their businesses)
• Senior management must ensure new business, new markets are fully reviewed and risks
and potential risks are identified and controls are put in place prior to commencing
business
• Senior management must aggregate all major risk and report these risks periodically to the
Board of Directors
30
• Bubble-up risks / “metrics that matter” to provide the Board/RiskCo with a jump-off point
• Link strategy to risk and risk to strategy  Pressure test strategic plan
• Board and delegated RiskCo must drive Risk and Strategy discussion
• Structured risk data provides insight to reverse slow decision making and risk aversion
• Drive Integrated Assurance not stand-alone risk, compliance, and audit
• GRC tool and taxonomy can unify risk appetite across the business
• Process mapping codifies decision making framework rather than rely only on individual
judgment for BAU activity
• Operational risk can manage risk, not prevent risk
31
FOLLOW US ONLINE
blogs.perficient.com/financialservices @Perficient_FS

How to Drive Value from Operational Risk Data - Part 2

  • 1.
    HOW TO DRIVEVALUE FROM OPERATIONAL RISK DATA JANUARY 29, 2015
  • 2.
    2 ABOUT PERFICIENT Perficient isa leading information technology consulting firm serving clients throughout North America. We help clients implement business-driven technology solutions that integrate business processes, improve worker productivity, increase customer loyalty and create a more agile enterprise to better respond to new business opportunities.
  • 3.
    3 GlobalDeliveryCenters/OffshoreDelivery Deep Financial ServicesDomain Expertise Enterprise Information Solutions Finance Enterprise Insights Portal Web Content Social Solutions SOA Cloud API Solutions Company Wide Practices Deep Financial Services Domain Expertise BANKING Wholesale Consumer Credit Unions Payment Processing Trust & Custody Trade Services Treasury Services ASSET & WEALTH MANAGEMENT Equities & Fixed Income SMA & Wrap Hedge Funds OMS & EMS Portfolio Modeling Portfolio Accounting CAPITAL MARKETS Equities & Fixed Income FX & Commodities Future & Options Electronic Trading INSURANCE Investments Customer Acquisition Property & Casualty Life Annuities Services Claims Evaluation Underwriting Consumer Direct Business/ Technology Solution Rationalization and Delivery Business Process Improvement Program Value, Quality and Cost Management Client Centricity Risk and Regulatory Compliance Finance Transformation Solutions & Services INDUSTRY DRIVEN SOLUTIONS
  • 4.
    4 ABOUT THE SPEAKER RichardBrownstein, Director of Risk and Compliance, Perficient Rich leads Risk and Compliance in Perficient’s Financial Services national practice. He has more than 20 years of experience working for and with large financial institutions in the areas of operational risk management, legal and compliance, IT governance, and project portfolio management. He has a deep understanding of industry challenges and best practices. Rich has a proven track record leading strategic business, product and technology initiatives to minimize risk and maximize effectiveness and efficiency for organizations.
  • 5.
    5 WHAT WE WANTTO TALK ABOUT TODAY • Introduction • Drivers and Goals of Operational Risk • Risk Identification • How to Capture, Collate and Aggregate Data • Leveraging Risk Intelligence
  • 6.
    6 POV: DEFINING OPERATIONALRISK Basel Committee on Banking Supervision • Operational risk is the risk of loss resulting from inadequate or failed internal processes, people and systems or from external events – and is embedded in every FI products, activities, processes, and systems Executive Level • Enables management transparency to identify the exceptional blind spots and set strategy within risk parameters Department Level • At the 2nd line of defense, operational risk serves as an independent voice in proactive process and control improvement • Although often viewed as another assurance requirement, periodic audit and incident tracker
  • 7.
    7 ORGANIZATIONAL BENEFITS HIGH FUNCTIONING OPRISK • Drives management awareness of the business environment, controls and areas requiring improvement – weak controls unattended may result in losses, fines, legal fees and regulatory actions • Results in stronger manual or automated controls allowing management to increase investment and volume expectations due to stabile operational capacity • Leads to lower costs, stronger credit rating and lower cost of capital; lower Basel Operational Risk charges drives profits • Stronger risk measurement and management may reduce frequency and impact of negative news and reputational impacts
  • 8.
    8 MANAGERIAL BENEFITS HIGH FUNCTIONING OPRISK • Obtain timely, accurate and complete information and also up-to-date information in time of crisis • Focus on matters of most importance to the organization and strategically allocate or re-allocate resources • Monitor the risks associated with the strategic goals of the organization and to address early, significant signs of deteriorations • Structured information providing focus on key risks • NOT bureaucratic process and paperwork
  • 9.
    9 RISK MANAGEMENT DATAFLOW Top Down From senior management perspectives: • Enterprise wide risk assessment • Enterprise wide risks; Top 5-10 Risks / Hot Topics • Risks aligned with enterprise strategic goal. Balance risk, even take risk and reward optimally to steer the company • Board approved Risk Charter Bottom Up From the business perspectives: • Comprehensive assessment and identification of top risk in each business area • Risk identifications is made by the business or functional owner who may have line of sight to the process or influence to control • Risks are specific to a business area - risk owner and process owner may be different. Management Involvement Surface Information
  • 10.
  • 11.
    11 WHAT IS ARISK ASSESSMENT? RESULTS PROCESSES CHALLENGES Identifies Inherent Risk Gives big picture to senior management Lack of knowledge of firm’s vulnerability by senior management and personnel Tabulates Controls Identifies policies, procedures, processes, key operating procedures Lack of knowledge about control and firm processes Catalogs Residual Risk Identifies areas requiring attention Lack of knowledge of risk associated with each business Manages resources to focus on top control Issues Identifies areas requiring most attention Lack of knowledge of gaps in policies, procedures and processes Allow risk taking within capacity Identifies areas of opportunity and growth Business is not taking full advantage of existing platform, technology and expertise
  • 12.
    12 • Each InherentRisk or regulatory rule is evaluated for each business activity or transaction. • Each regulatory rule has one or more controls, perhaps registered in the control library. Each control is evaluated for its design and operating effectiveness. The resulting score is the Residual Risk. • Assessment, findings, action items logged into GRC tools ASSESSMENT PRINCIPLES
  • 13.
    13 RISK ASSESSMENT ARCHITECTURE BUSINESSCHALLENGE:  Senior management and key personnel were not fully aware of the firm’s top risks  Key personnel were not fully trained in the risk assessment process  Key personnel were not fully aware of the risks within their businesses  Key personnel were not fully aware of rules, regulations and best practices impacting their businesses  The data from the firm’s GRC was not managed properly resulting in an attempt to managed data through multiple excel spreadsheets SOLUTION AND SERVICES:  Perficient met with risk, compliance and businesses to understand products and services offered, overall process and management of GRC tool.  Perficient created an inventory questionnaire together with senior management to help business heads catalog products and services offered  Perficient created a regulatory matrix control and together with senior management identify the regulations and requirements for each business  Perficient created regulatory and processes questionnaires similar to information used by auditors or examiners  Perficient worked with GRC vendor to facilitate that the GRC tool to support the risk assessment process RESULTS:  Senior management and key personnel became aware of all products and services offered within the firm  Key personnel and management became aware of rules, regulations and the requirements impacting their businesses  Personnel identified controls within their businesses and identified related gaps  Personnel becomes more knowledgeable in the processes used by auditors and examiners  Client is working towards ensuring all data and reports on risk assessment are management through one source data derived from the GRC
  • 14.
    14 SOURCES OF OPERATIONALRISK DATA Bottom Up – Experiences in the department or field Periodic RCSA or Business Operating Reviews • Performed in different ways, as a questionnaire or discussion based, the business owner and support partners (1st LOD) inventory risks, score controls resulting in key control issues • Aggregating KRIs drive organizational priorities Key Risk Indicators • Data driven measures, metrics, exceptional breaches  drives response • Metrics that matter rather than binders of data Incidents and Lessons Learned (internal and external) • Policy mandated loss and near-miss capture allows for frequency X impact analysis • Scenario analysis and read-across to similar processes  +ROI • IT help desk – users log near-misses and manual workarounds Top Down • Strategic plans / budgets inform 1st LOD where to set capacity • Emerging risks – industry, regulatory, political, economic, social, technology
  • 15.
    15 LEVERAGING OPRISK DATA Bottom Up •Transparency of Blind Spots; Action Priority - risk identification, quality of controls (design/effectiveness) and residual risk • Budget - Priority projects; allocation of shared service projects • Patterns/Trends – determine correlation drivers (volume, seasonality) • Incidents – Improves scenario & stress analysis • Loss Data – input for Basel models • GRC Data – aggregate findings from risk, compliance, audit, regulators sets roadmap Top Down • Risk Appetite / Risk Tolerance – Capacity to take on more risk • Regulatory Attestations
  • 16.
    16 AGGREGATING RISK DATA • Governancerefers to the enterprise consolidated, integrated view • Applies to business rules and limits that are not department, LOB or product specific, or in a silo • Promotes visibility, transparency and data reuse for each area of assurance (risk compliance & audit) across the enterprise • Tools enable Business Intelligence (BI) – integrate diverse and disparate data sources  Dashboards • Historical measures lead to risk aggregated lead to Predictive BI Leverage tools and Structured Data to drive +ROI and Risk Intelligence DRIVES RISK INTELLIGENCE
  • 17.
    17 UNSTRUCTURED & STRUCTUREDDATA Structured Data Enhance  Aggregate  Interpret Score with Risk Analytics Unstructured Data Collect  Interpret  Score
  • 18.
    18 ORM OFFICE STRUCTURE FrontOffice Local Control Officer • Located with and has deep business & function SME • Assess and analyze business and regulatory risks/controls • 2nd LOD – earned seat at the table Middle Office Risk Infrastructure • Sets or executes risk policies & procedures and taxonomy • Interacts with assurance groups (Compliance & Audit) • Prepares/Leads Risk Committee • Reputation as an OpRisk SME Back Office Risk Operations • Expert users in GRC tools adding leverage to risk FO+MO for desk exams and MI reporting. Drives risk transparency and auditability • Potentially training center for Risk or broader organization • Potential near-shore location To build a high-performing risk organization, the target operating model will be best-in- class over time. Each segment and job function must be fit for purpose. • Assess current operating processes and leading practices to improve mandates, policies, procedures, people, process, technology, SLA and metrics • Rather than a homogeneous risk function – each function’s roles and reputation will become focused, specialized and drive expertise
  • 19.
    19 ENTERPRISE RISK MANAGEMENTADOPTION • Engagement from the 1st Line of Defense is a key to success for adoption • Steps to improve engagement vary based on culture. Other success factors are: - Consistent processes and standards - Interaction and monitoring from the ERM Office - Mandate or tone-from-the-top • Key steps in aiding the BU owner’s adoption of an effective risk assessment program: - Developing policies and procedures - Communicating broader delivery expectations and framework - Training executives and staff Identify Key Risks & Gaps Set Policy & Procedure Communicate to LOB Communicate Timeline & Framework Educate LOB “How To” Perform Risk Assessment Drive Interaction through ERM Framework Monitor & Evaluate Results Adjust Process Repeat ERM for New Cycle TuneExecution
  • 20.
    20 STRATEGY & CULTURE • Risktolerance/thresholds - Qualitative/quantitative • Risk appetite for each category - Linked to strategy • Risk culture • Impact of not linking: market cap more often declines due to flawed strategic decision rather than OpRisk • Assurance groups don’t focus on or link strategy
  • 21.
    21 GOVERNANCE • Policies • Committees– Risk Charter • Roles and responsibilities • BU risk liaison - Independent and in CRO org • Talent and training • ORM  ERM (correlation of risk categories) • Review and ensure risk tolerance and appetite aligns with enterprise strategies and visions
  • 22.
    22 StrategySettingProcess Board / SeniorManagement Risk Committee Risk Appetite Risk Capacity aEmerging Risks Risk RegisterRegulatory MRA ORM Office – 2nd Line of Defense Risk ID Internal Incidents RCSAs Key Risk Indicators Risk Register ROLE-BASED CONSIDERATIONS aExternal Incidents Top Risk Themes/ Scenarios BU – 1st Line of Defense TopRiskIDRiskAppetiteRiskCapacityNBILimitSettingCapacity Risk RegisterOperating Plan / Budget Strategic Plan 18-24MonthsTimetoExecute3Months
  • 23.
    23 RISK CONTROLS ANALYSIS BUSINESSCHALLENGE:  US Super Regional subsidiary of a global bank established a priority to update all operational process, procedure, and internal operational and regulatory control documentation for the consumer banking lines of business.  Regulators required the bank to achieve a strong level of risk management practices for all lines of business. SOLUTION AND SERVICES:  Perficient reviewed existing operational procedures and risk control libraries.  Conducted interviews and work sessions with key business stakeholders across 16 consumer banking business units to analyze, achieve consensus and document all core business processes across the lines of business.  Developed process maps for more than 100 core business process and their associated sub-processes.  Working with risk managers, reviewed contents of risk control libraries, mapped relevant risk controls to core processes, identified control and developed recommendations for updated controls.  Interfaced with enterprise risk assessment to develop end-to-end product risk assessments utilizing process maps and risk controls analysis deliverables. RESULTS:  Implemented a multi-track effort with key business and risk management stakeholders to analyze and document core business processes across the entire Consumer Banking group distribution and lending business units.  Delivered a robust and maintainable business process analysis and mapping document incorporating operational and compliance controls mapped to process activities.  Reviewed existing risk controls library and identified regulatory and operational control gaps for more than 100 core processes and several hundred sub- processes across consumer banking.
  • 24.
    24 RISK CLASSIFICATION • Legal andCompliance • Fraud (Internal / External) • Execution, Delivery and Process • Products and Business Practice • Third Party, Vendor, Counterparty • Strategic / Policy • Financial • Service Delivery or Operational • Employment Practice, Workplace Safety • IT, Business Disruption • Privacy / Security • Environmental Factors / External FOR FINANCIAL FIRMS & INSURERS
  • 25.
    25 PROTOCOLS & TAXONOMY • Developcomprehensive dictionary of risks • Use same language for similar processes • Use consistent approaches for risks identification, responses and escalations • Apply critical thinking • Ask for data once > Reuse • Use technology (GRC tool) to capture and aggregate risks
  • 26.
    26 CONTROLS • Process mapping/Controllibraries • Risk identification and recognition • Key risk indicators (KRIs) • Risk assessment • Risk monitoring • Loss data capturing and reporting
  • 27.
  • 28.
    28 OPTIMIZING ORM PROCESSES Identification,categorization and prioritization results: • Prioritizes/escalates high-frequency/high-impact operational risk events to management or the Board while alerting BU of mid/low risk events • Take preventative measure to timely correct deficiencies • Recognize trends and emerging risks and take action • Aggregate operational risk losses for reporting • Loss data serves as input for capital planning and the CCAR (Comprehensive Capital Analysis Review) process
  • 29.
    29 WHAT ARE REGULATORSLOOKING FOR? Board of Directors directives are effective and are being followed: • Senior management must ensure that adequate policies, processes, procedures including technology are in place to support the enterprise risk appetite of the firm • Senior management needs to ensure businesses are managed by staff with experience and knowledge about their area of responsibility • Senior management must remain flexible to respond to competition and innovation in the industry (affecting their businesses) • Senior management must ensure new business, new markets are fully reviewed and risks and potential risks are identified and controls are put in place prior to commencing business • Senior management must aggregate all major risk and report these risks periodically to the Board of Directors
  • 30.
    30 • Bubble-up risks/ “metrics that matter” to provide the Board/RiskCo with a jump-off point • Link strategy to risk and risk to strategy  Pressure test strategic plan • Board and delegated RiskCo must drive Risk and Strategy discussion • Structured risk data provides insight to reverse slow decision making and risk aversion • Drive Integrated Assurance not stand-alone risk, compliance, and audit • GRC tool and taxonomy can unify risk appetite across the business • Process mapping codifies decision making framework rather than rely only on individual judgment for BAU activity • Operational risk can manage risk, not prevent risk
  • 31.