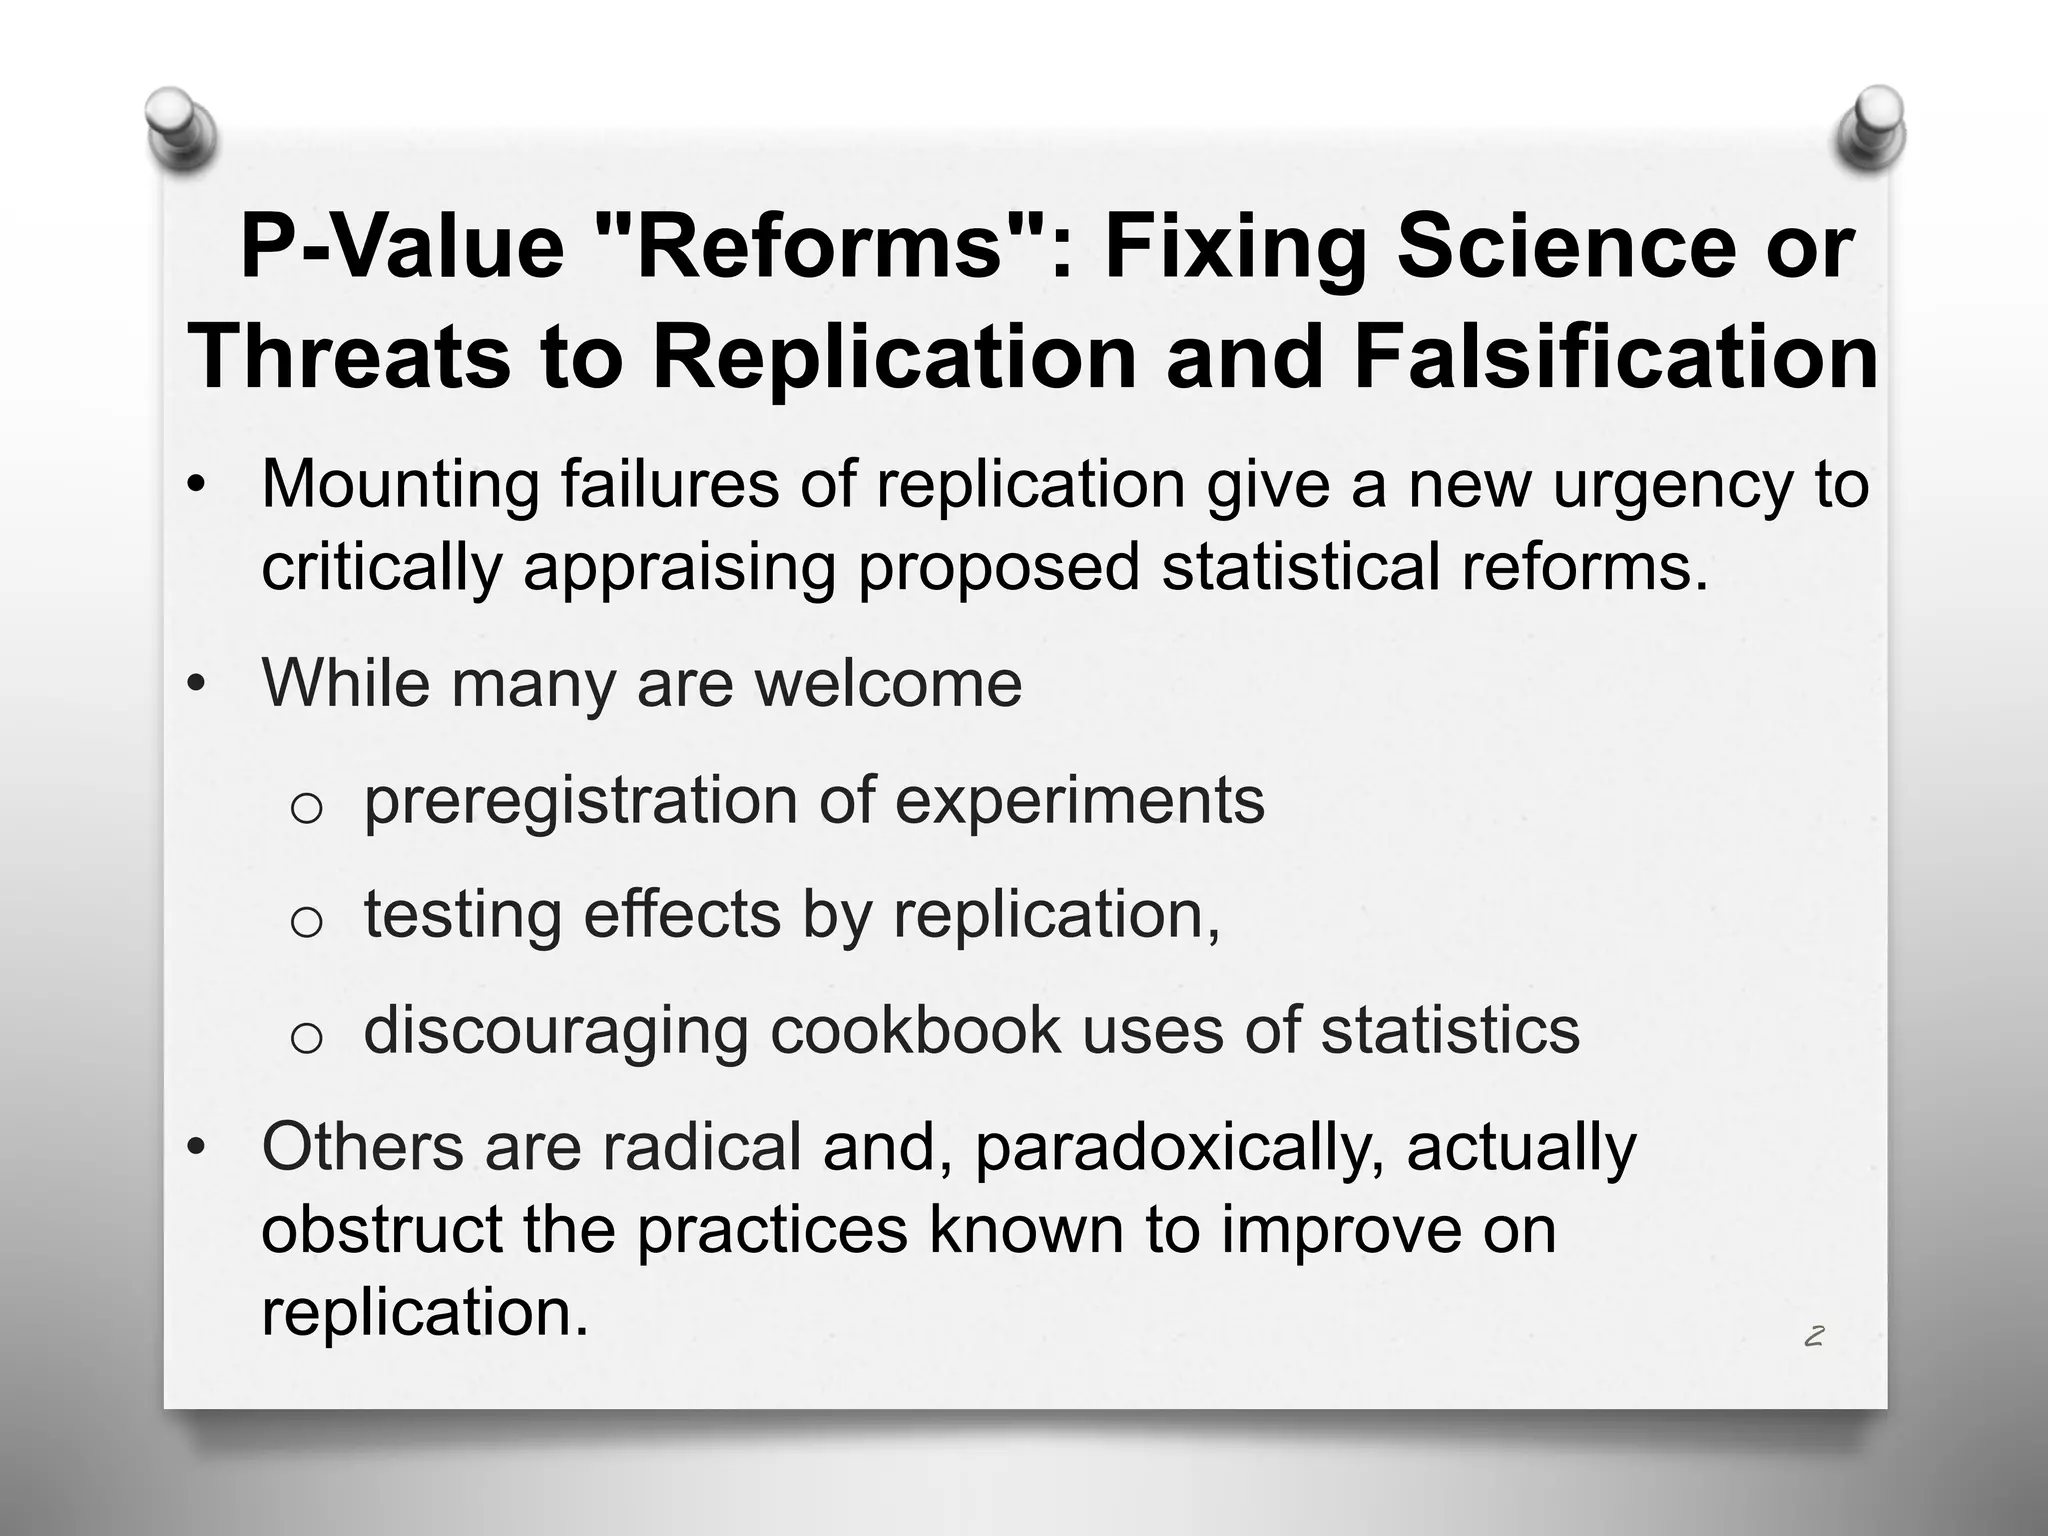
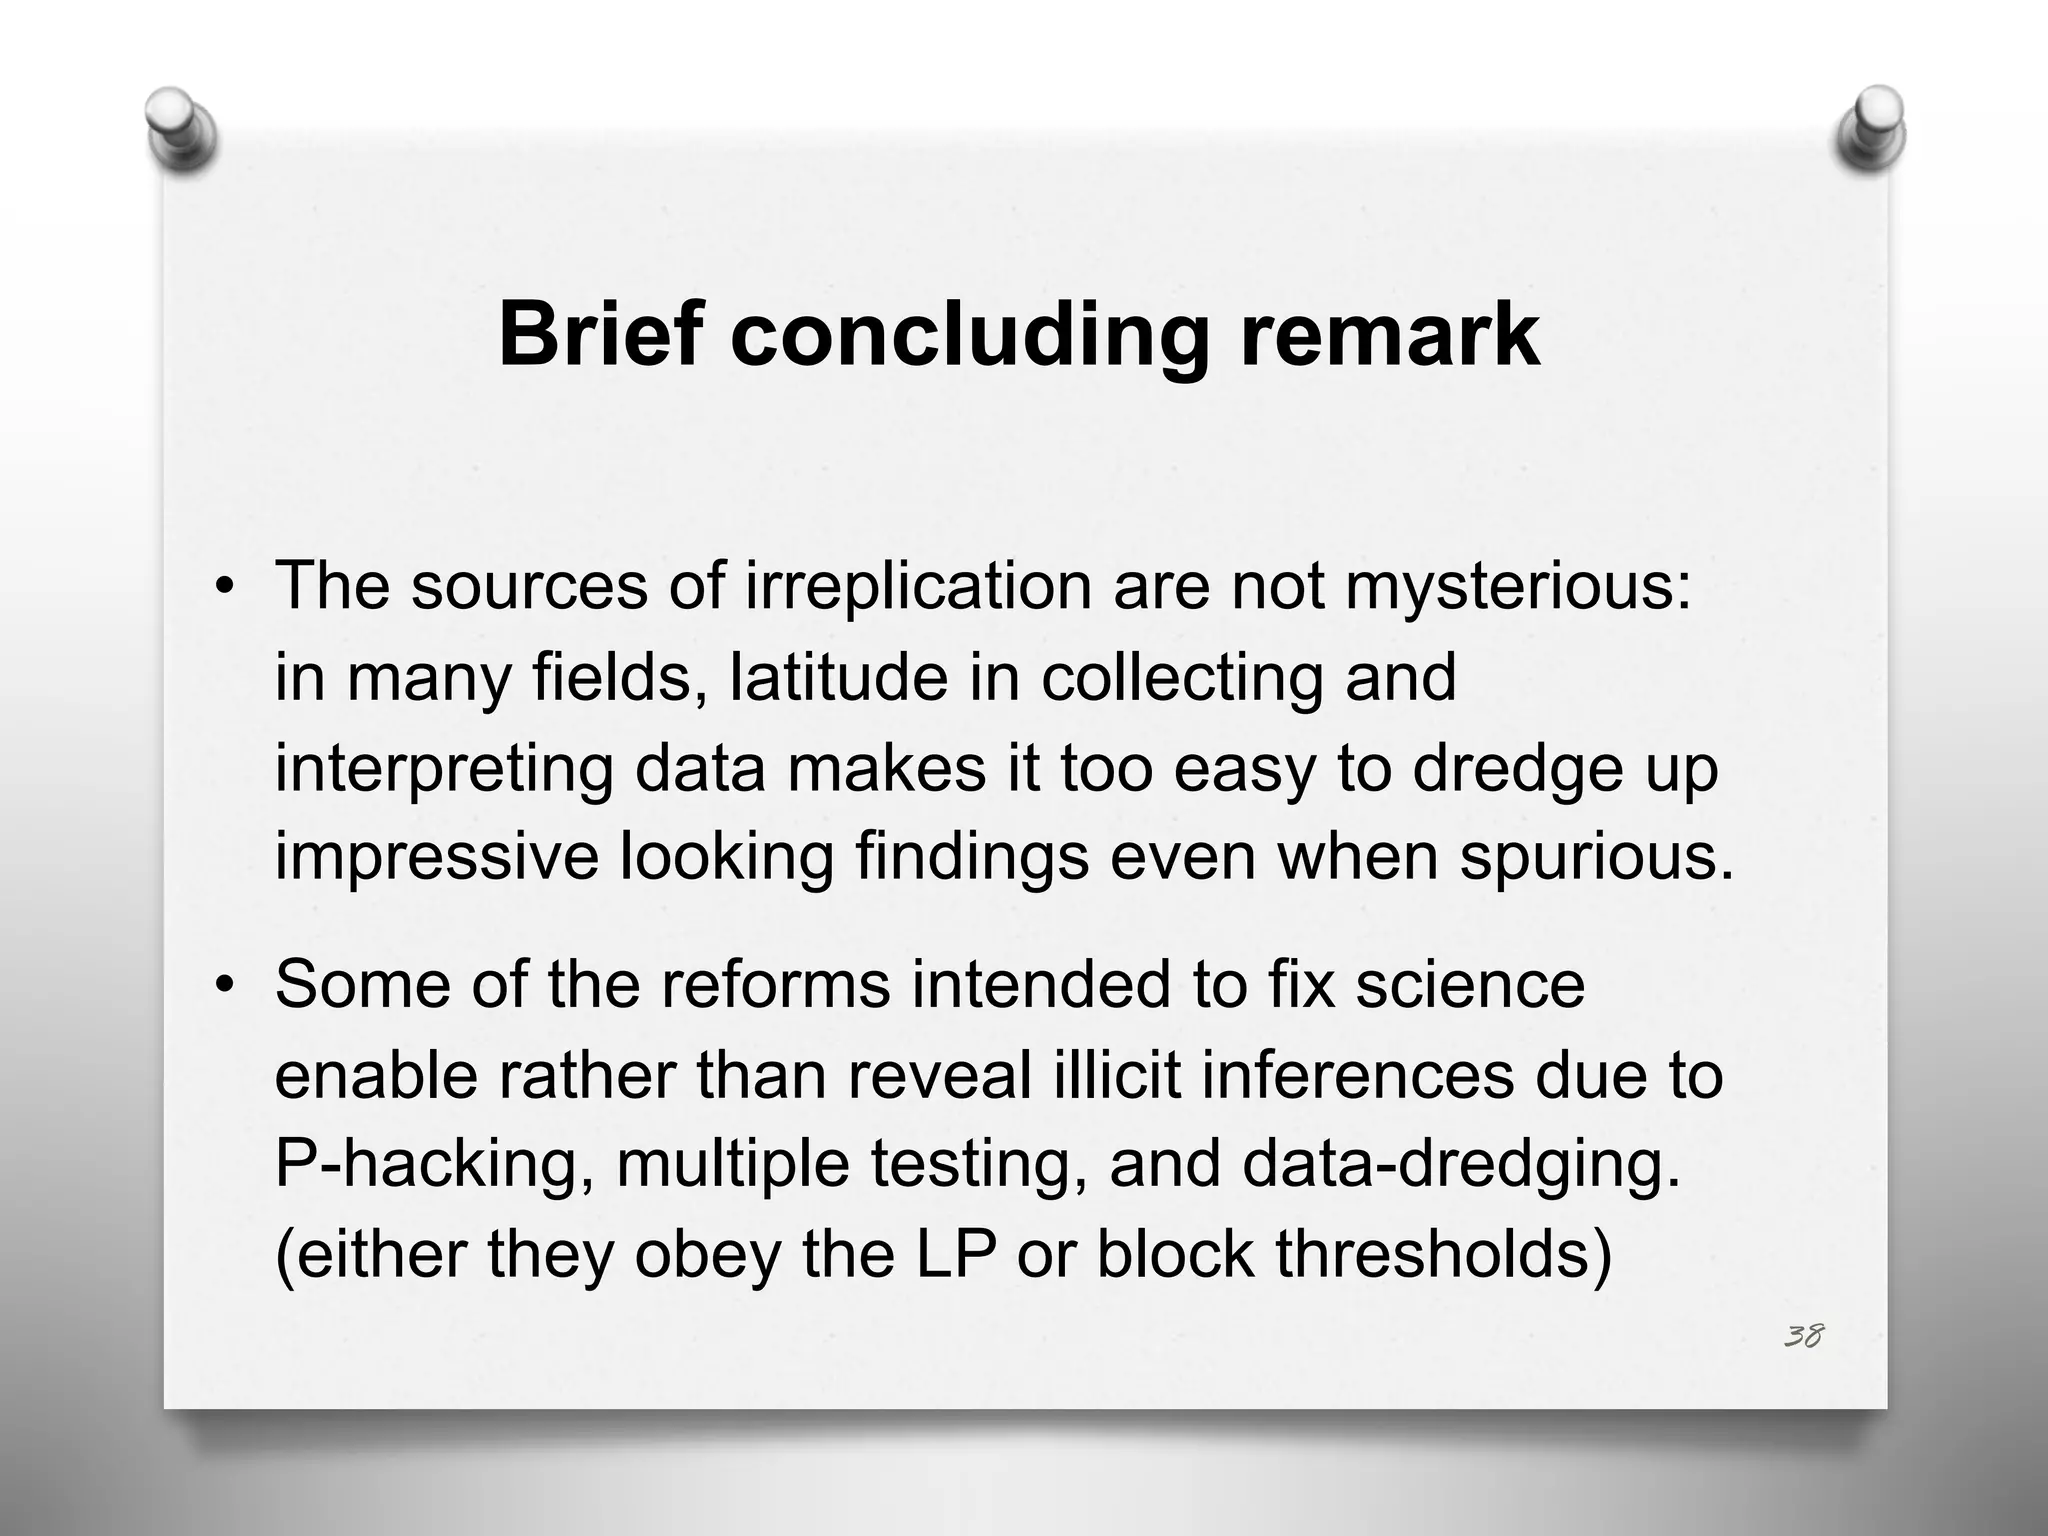
The document discusses p-value reforms in scientific research, emphasizing the need to critically assess proposed statistical changes amidst rising replication failures. It cautions against reforms that may hinder replication practices while advocating for a mixture of statistical, philosophical, and political approaches to improve scientific reliability. The author argues that abandoning p-value thresholds could compromise the ability to detect genuine effects and that reforms should focus on transparent reporting and redefining testing procedures to prevent spurious findings.
![3
• The statistics wars have often become proxy battles
between competing tribe leaders keen to advance
one or another method or philosophy
• I am concerned about unthinking bandwagon effects,
and "political groupthink" [a term on this conference's
website]
• Here the politics refers to "the politics of statistics"
• The problem calls for a mix of statistical,
philosophical, historical and political resources](https://image.slidesharecdn.com/d-200210215313/75/P-Value-Reforms-Fixing-Science-or-Threat-to-Replication-and-Falsification-3-2048.jpg)
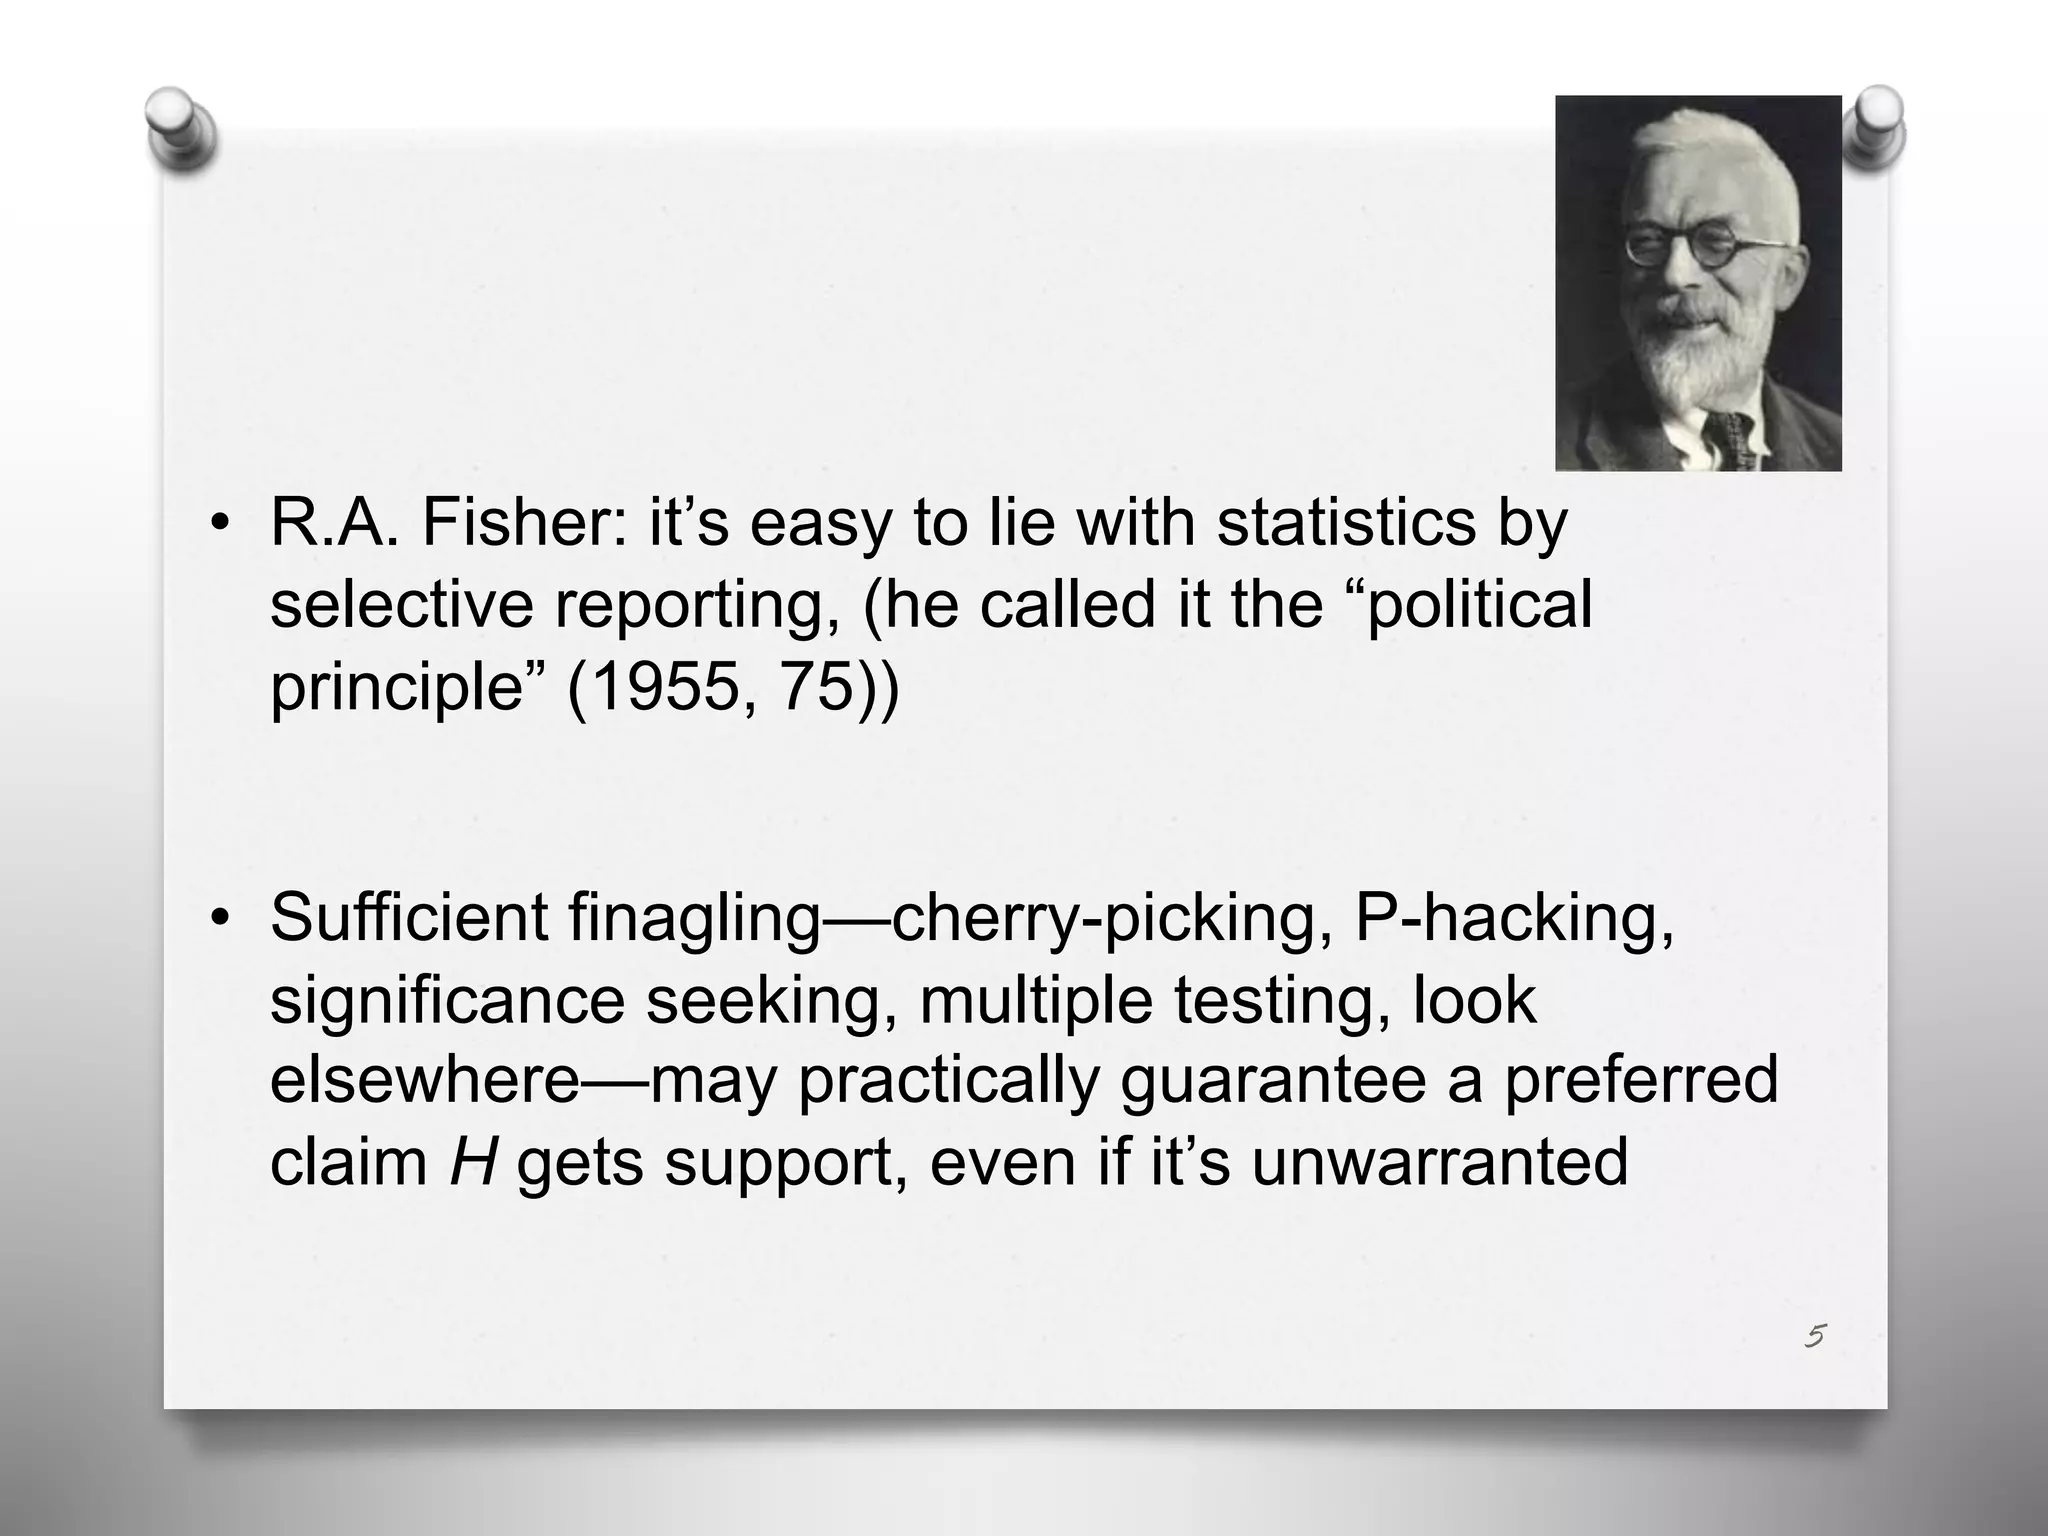

![“[W]e need, not an isolated record, but a reliable
method of procedure. In relation to the test of
significance, we may say that a phenomenon is
experimentally demonstrable when we know how
to conduct an experiment which will rarely fail to
give us a statistically significant result.” (Fisher
1947, 14)
9](https://image.slidesharecdn.com/d-200210215313/75/P-Value-Reforms-Fixing-Science-or-Threat-to-Replication-and-Falsification-9-2048.jpg)
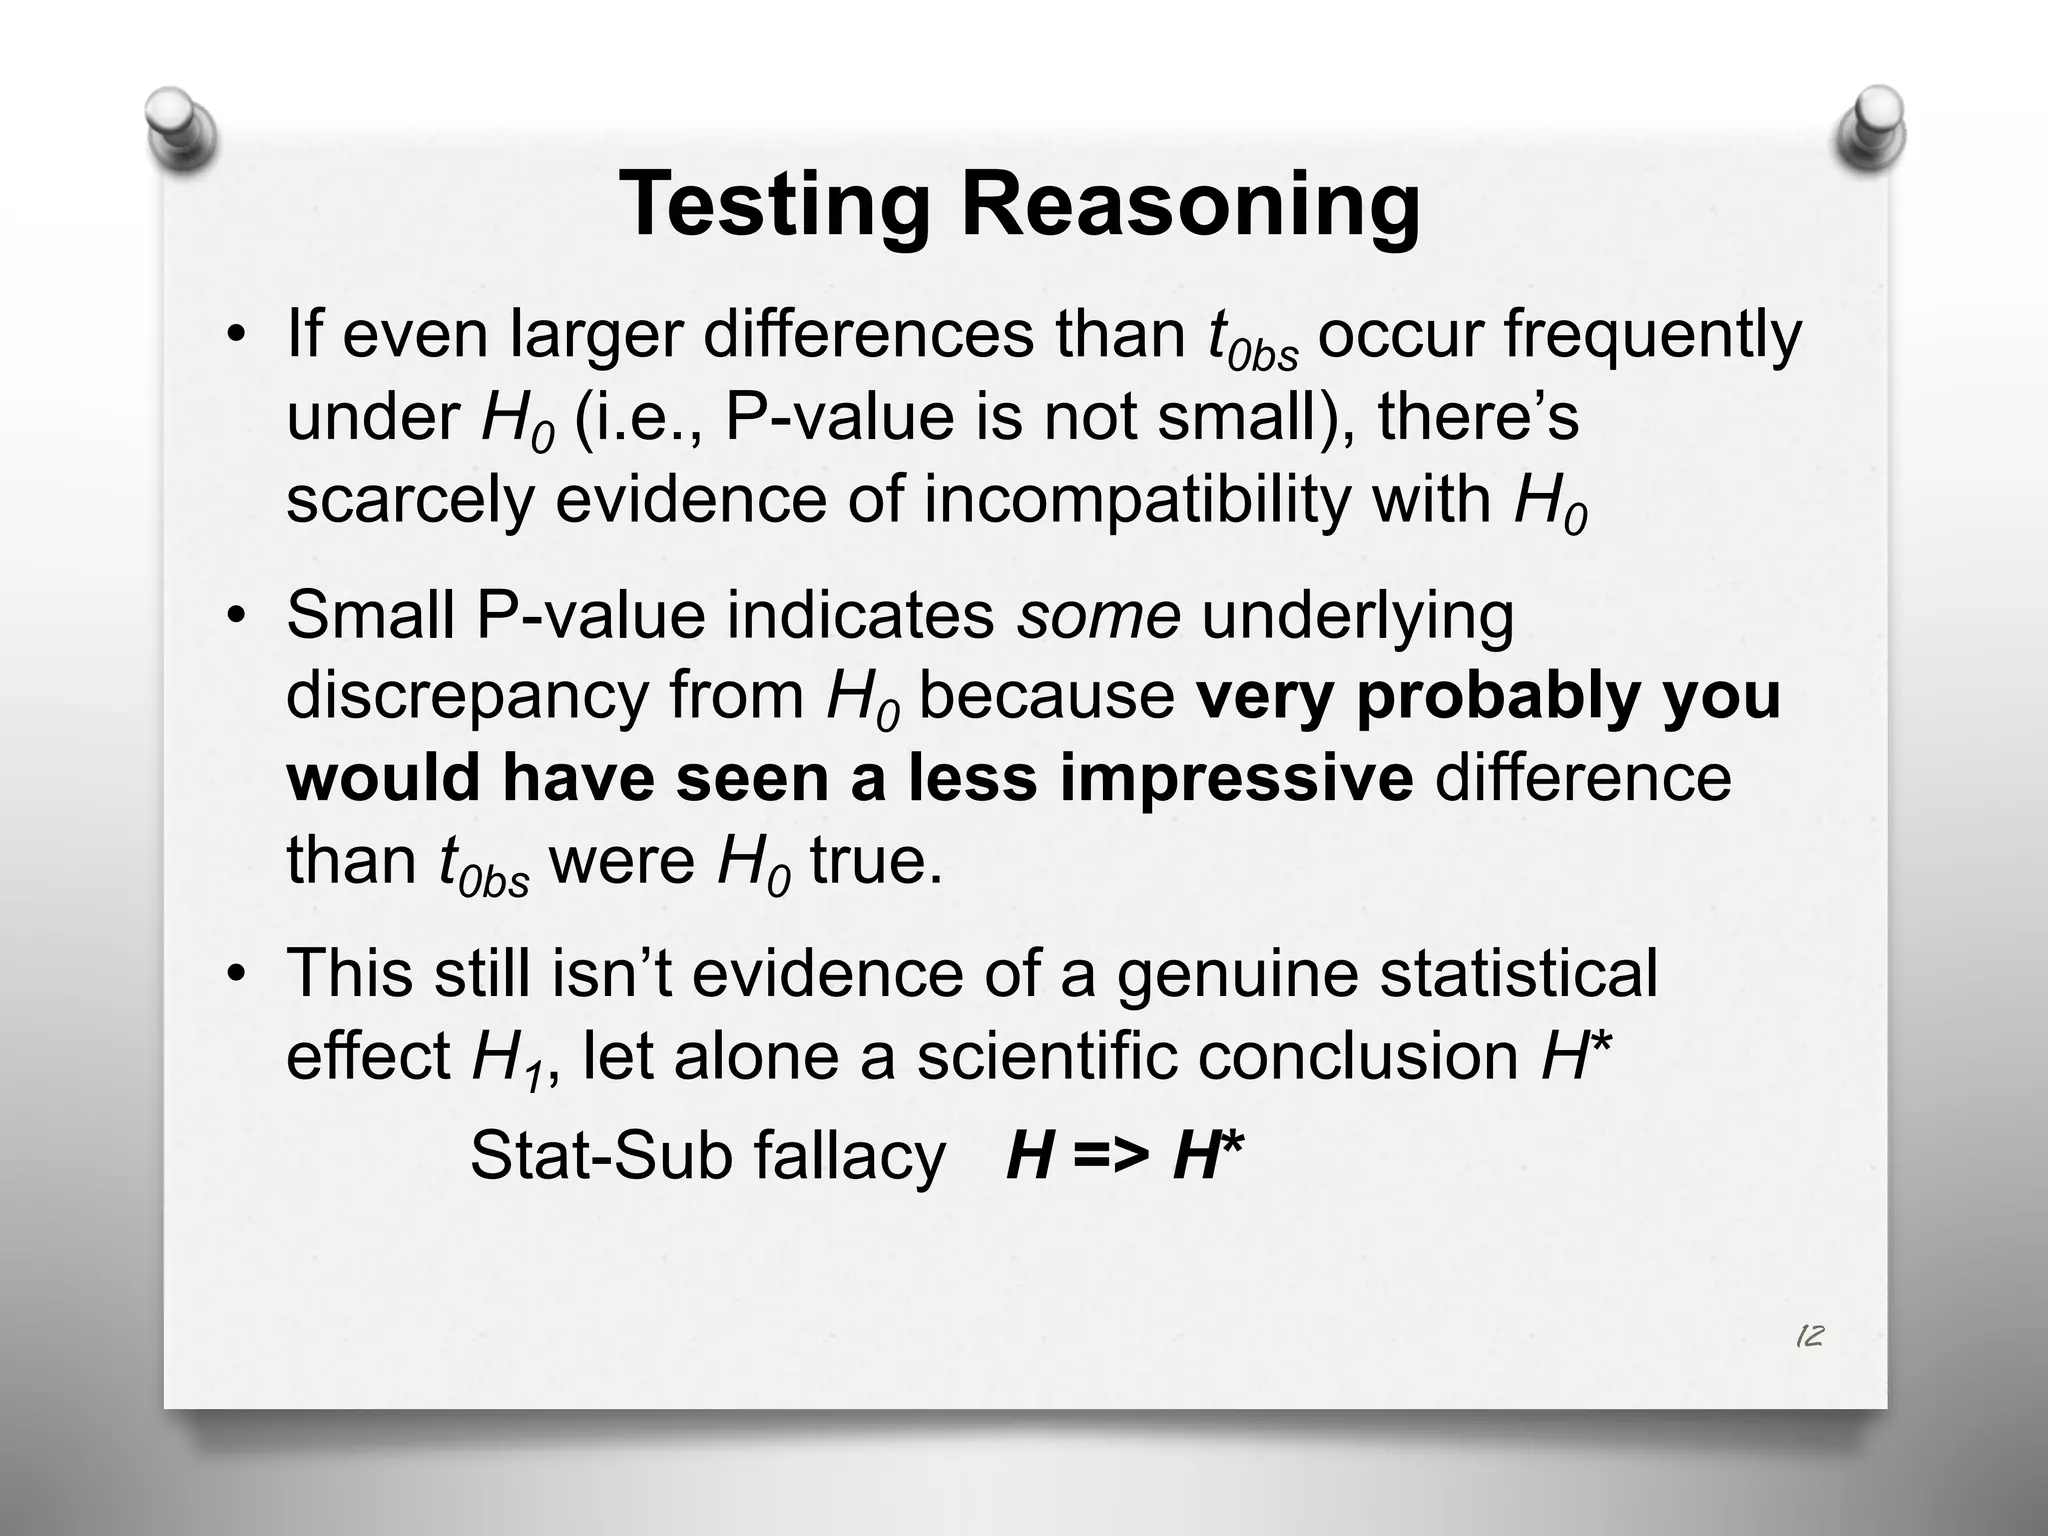
![Statistical ≠> substantive (H ≠> H*)
correlation ≠ cause
• H* makes claims that haven’t been probed by the
statistical test
“Merely refuting the null hypothesis is too weak to
corroborate” substantive H*, “we have to have
‘Popperian risk’, ‘severe test’ [as in Mayo]’”
(Meehl and Waller 2002,184)
13](https://image.slidesharecdn.com/d-200210215313/75/P-Value-Reforms-Fixing-Science-or-Threat-to-Replication-and-Falsification-13-2048.jpg)
![On the LP, error probabilities
appeal to something irrelevant
“Sampling distributions, significance levels,
power, all depend on something more [than
the likelihood function]–something that is
irrelevant in Bayesian inference–namely the
sample space” (Lindley 1971, 436)
• No wonder reformers often talk past each
other
23](https://image.slidesharecdn.com/d-200210215313/75/P-Value-Reforms-Fixing-Science-or-Threat-to-Replication-and-Falsification-23-2048.jpg)
![Some Bayesians reject probabilism
(Gelman: Falsificationist Bayesian;
Shalizi: error statistician)
“[C]rucial parts of Bayesian data analysis, … can be
understood as ‘error probes’ in Mayo’s sense”
“[W]hat we are advocating, then, is what Cox and
Hinkley (1974) call ‘pure significance testing’, in
which certain of the model’s implications are
compared directly to the data.” (Gelman and Shalizi
2013, 10, 20).
Can’t also champion “abandoning statistical
significance”
27](https://image.slidesharecdn.com/d-200210215313/75/P-Value-Reforms-Fixing-Science-or-Threat-to-Replication-and-Falsification-27-2048.jpg)
![New England Journal of Medicine
reacts to abandon significance
• The significance level from [a well-defined study] is
a reliable indicator of the extent to which the data
contradict a null hypothesis of no association
between an intervention and a response
• Clinicians and regulatory agencies must make
decisions about which treatment to use or to allow
to be marketed, and P values interpreted by
reliably calculated thresholds subjected to
appropriate adjustments [for multiple trials]
have a role in those decisions
(Harrington et al. 2019, 286, NEJM)
33](https://image.slidesharecdn.com/d-200210215313/75/P-Value-Reforms-Fixing-Science-or-Threat-to-Replication-and-Falsification-33-2048.jpg)
![43
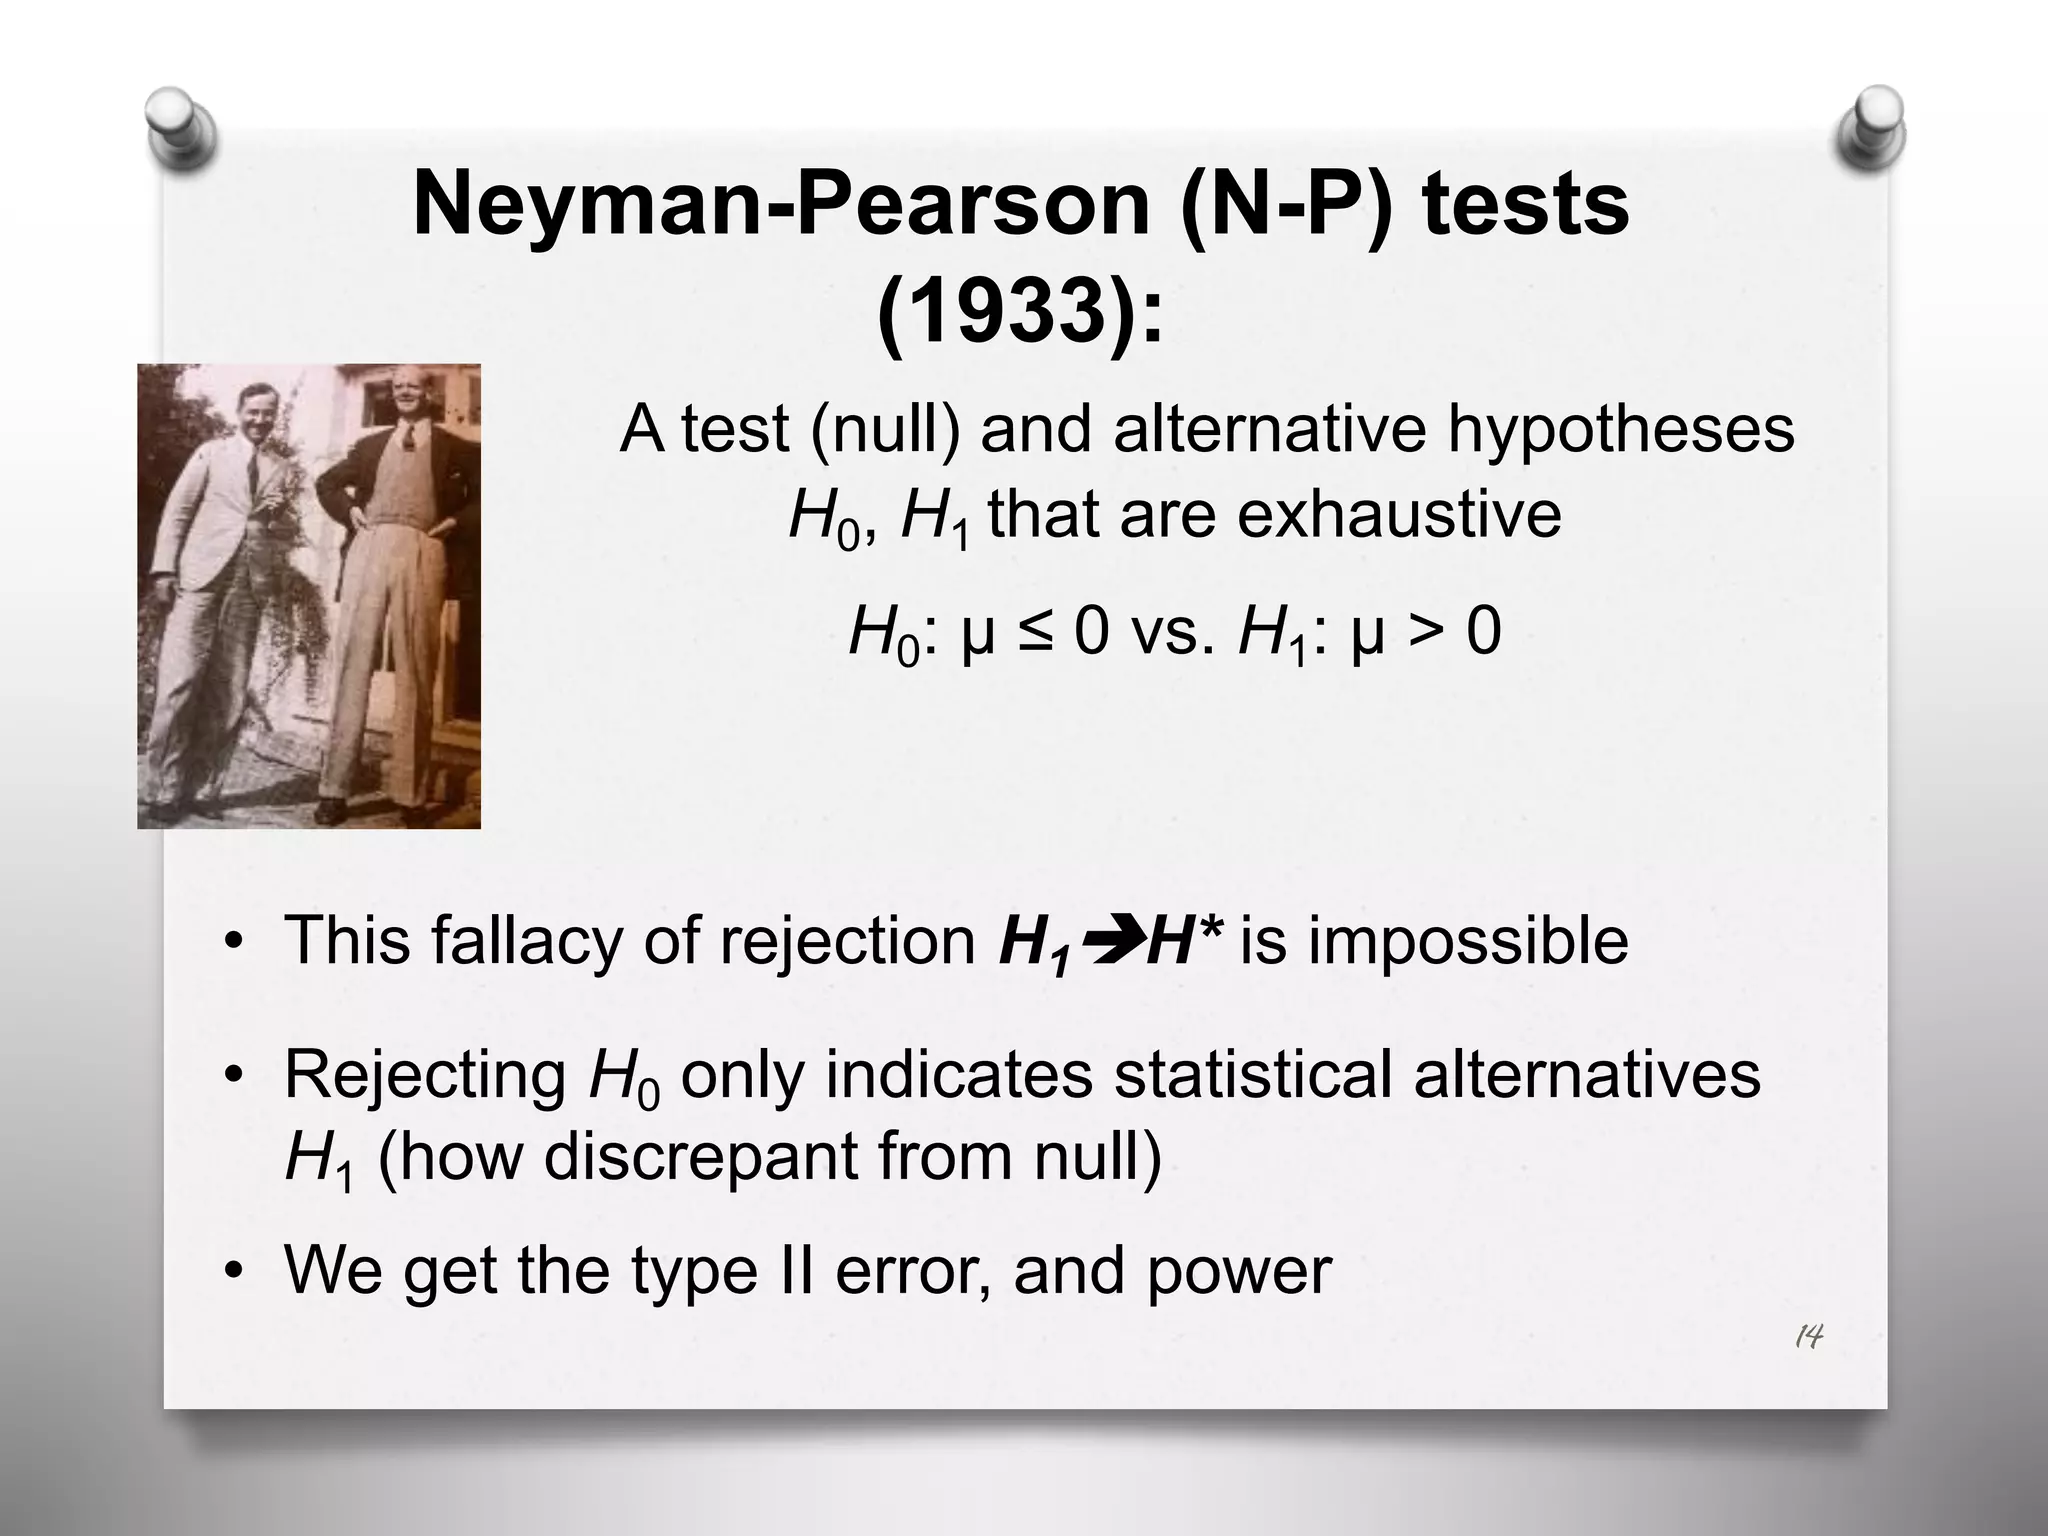
• Neyman, J. and Pearson, E.S. (1967). Joint Statistical Papers of J. Neyman and E. S.
Pearson. Cambridge: Cambridge University Press.
• Pearson, E.S. & Neyman, J. (1930). “On the problem of two samples”, Joint Statistical
Papers by J. Neyman & E.S. Pearson, 99-115 (Cambridge: Cambridge University
Press). First published in Bul. Acad. Pol.Sci. 73-96.
• Popper, K. (1959). The Logic of Scientific Discovery. New York: Basic Books. Reprinted
2000 The Logic of Scientific Discovery. London, New York: Routledge.
• Popper, K. (1983). Realism and the Aim of Science. Totowa, NJ: Rowman and
Littlefield.
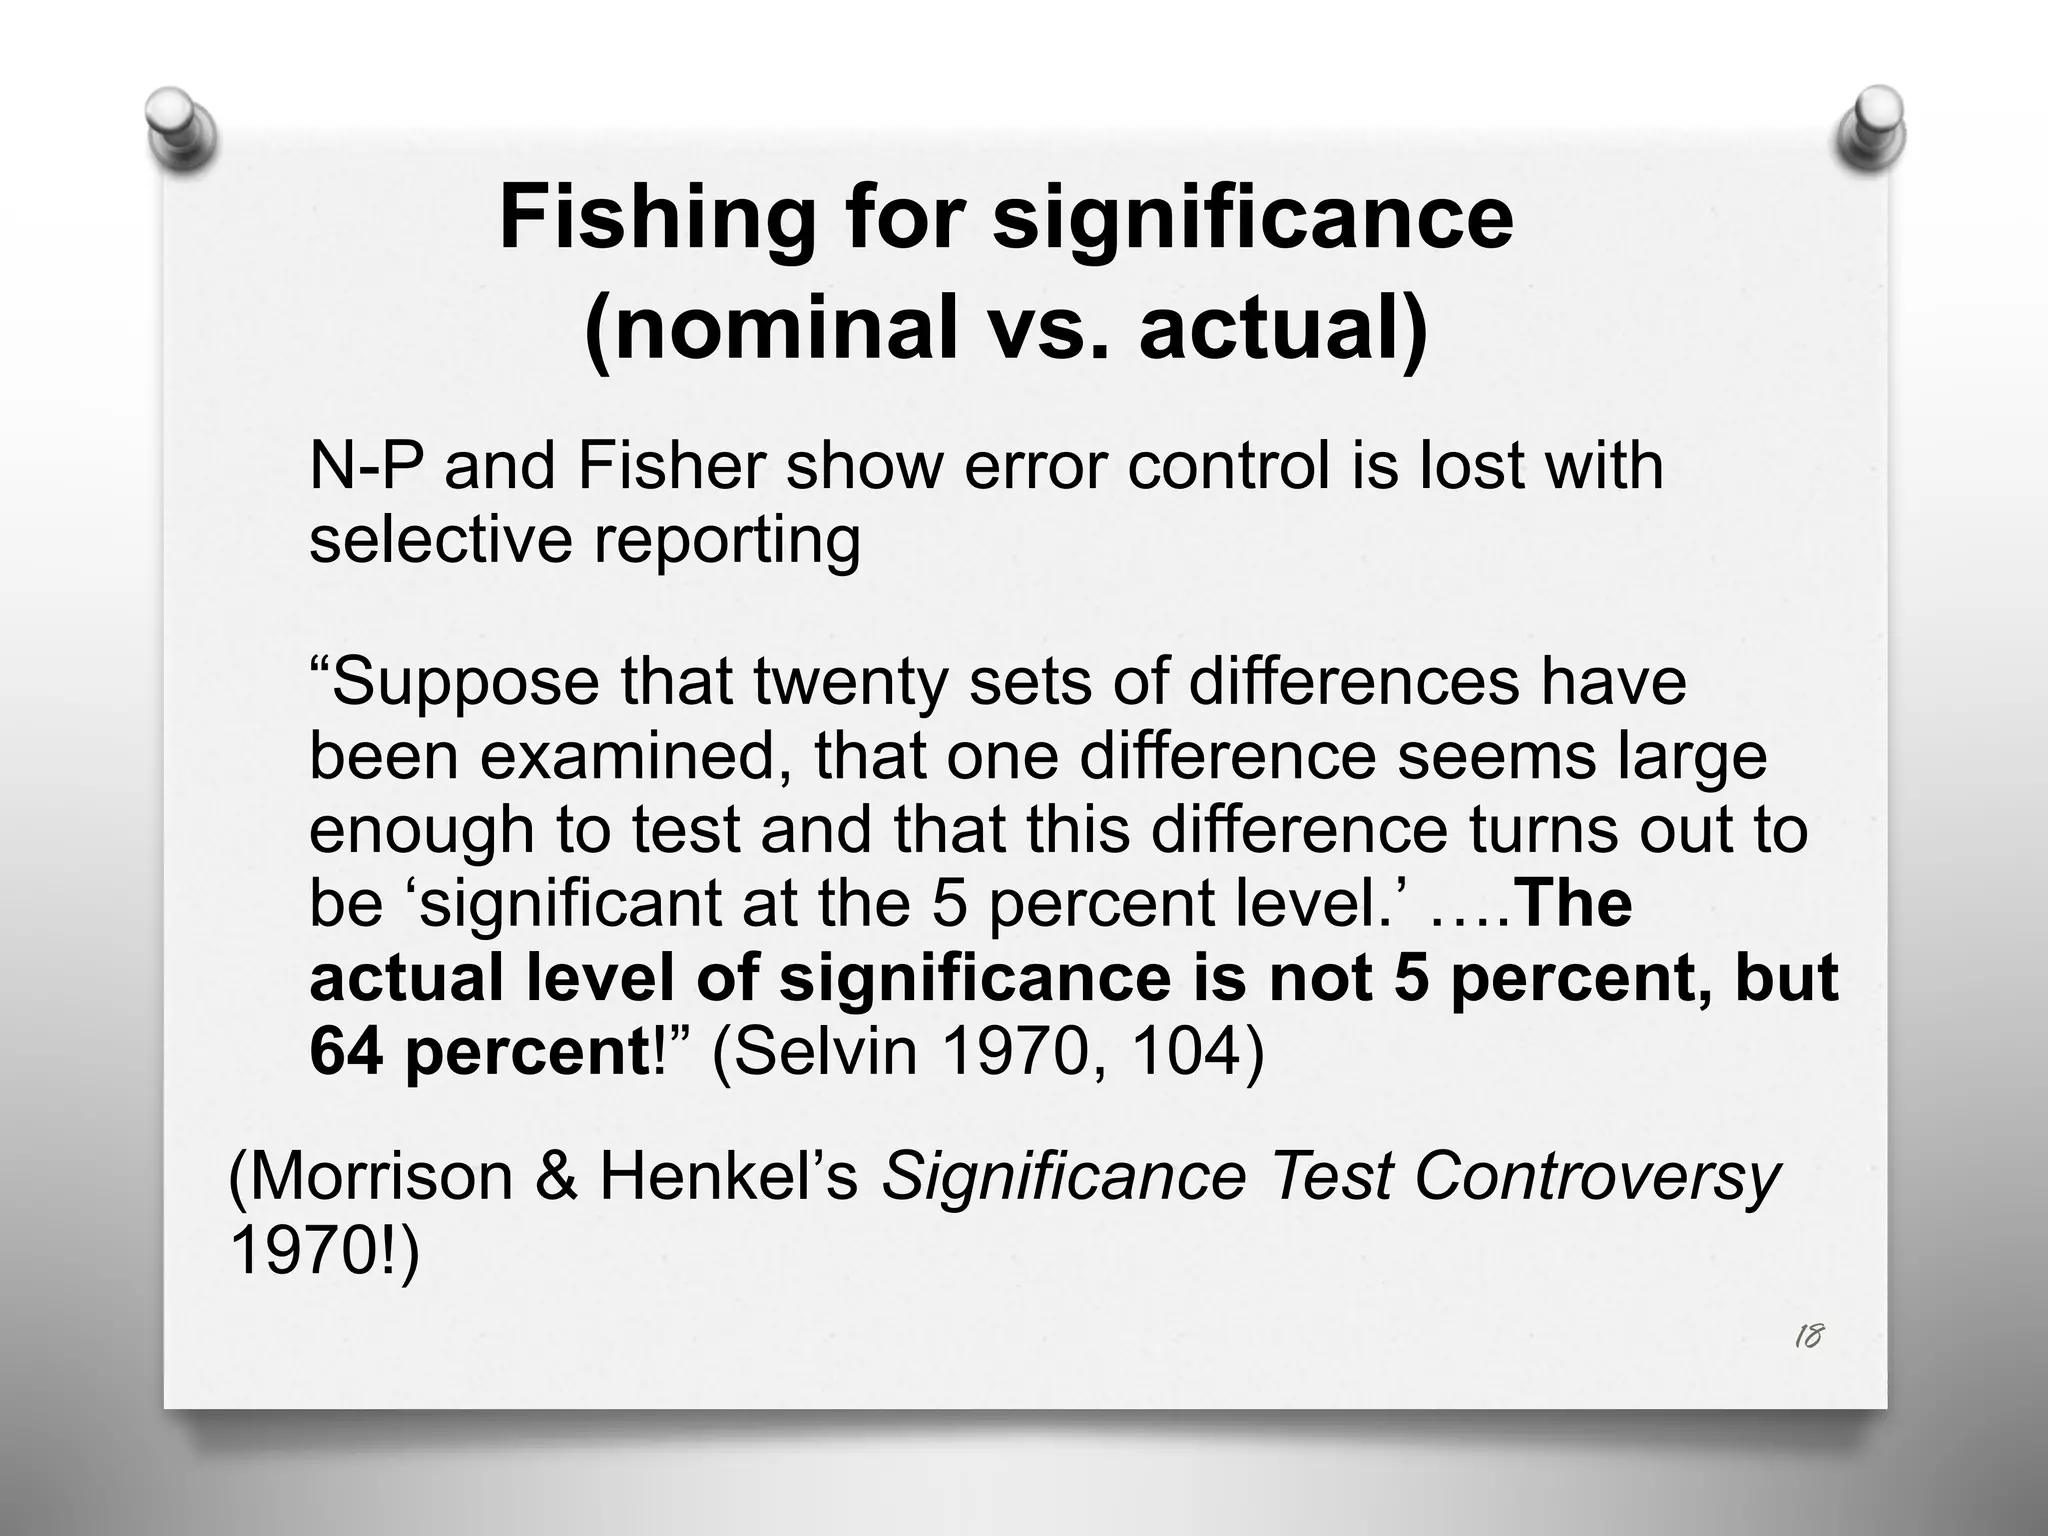
• Selvin, H. (1970). “A critique of tests of significance in survey research. In The
Significance Test Controversy, edited by D. Morrison and R. Henkel, 94-106. Chicago:
Aldine De Gruyter.
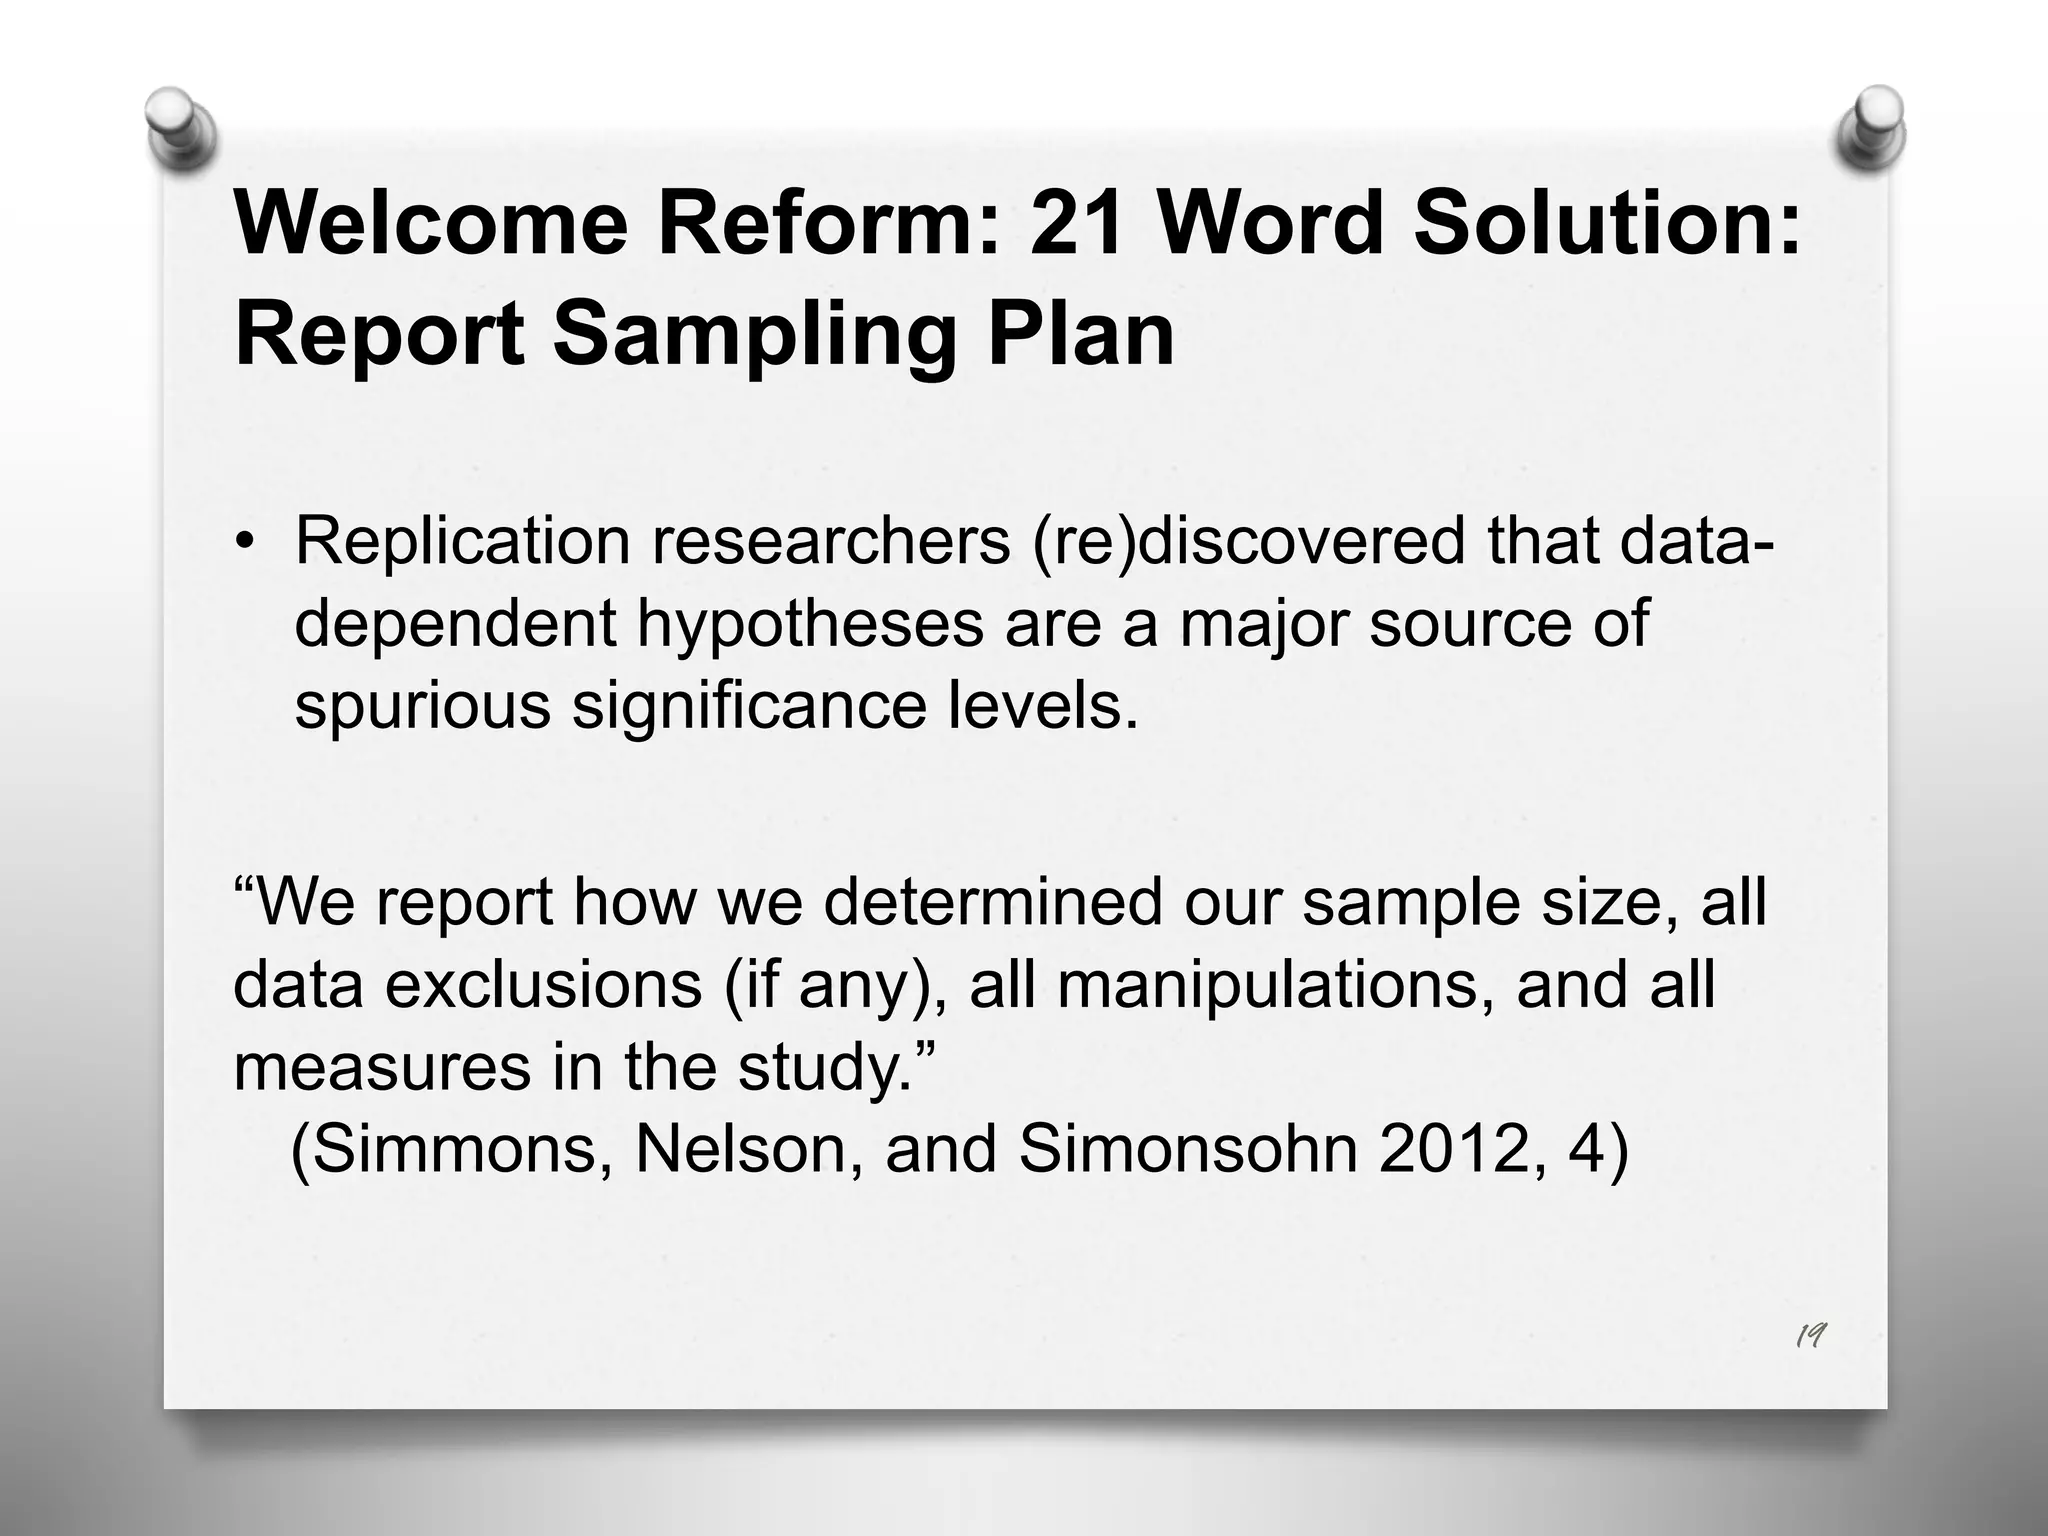
• Simmons, J. Nelson, L. and Simonsohn, U. (2012). “A 21 Word Solution.” Dialogue:
The Official Newsletter of the Society for Personality and Social Psychology, 26(2), 4–
7.
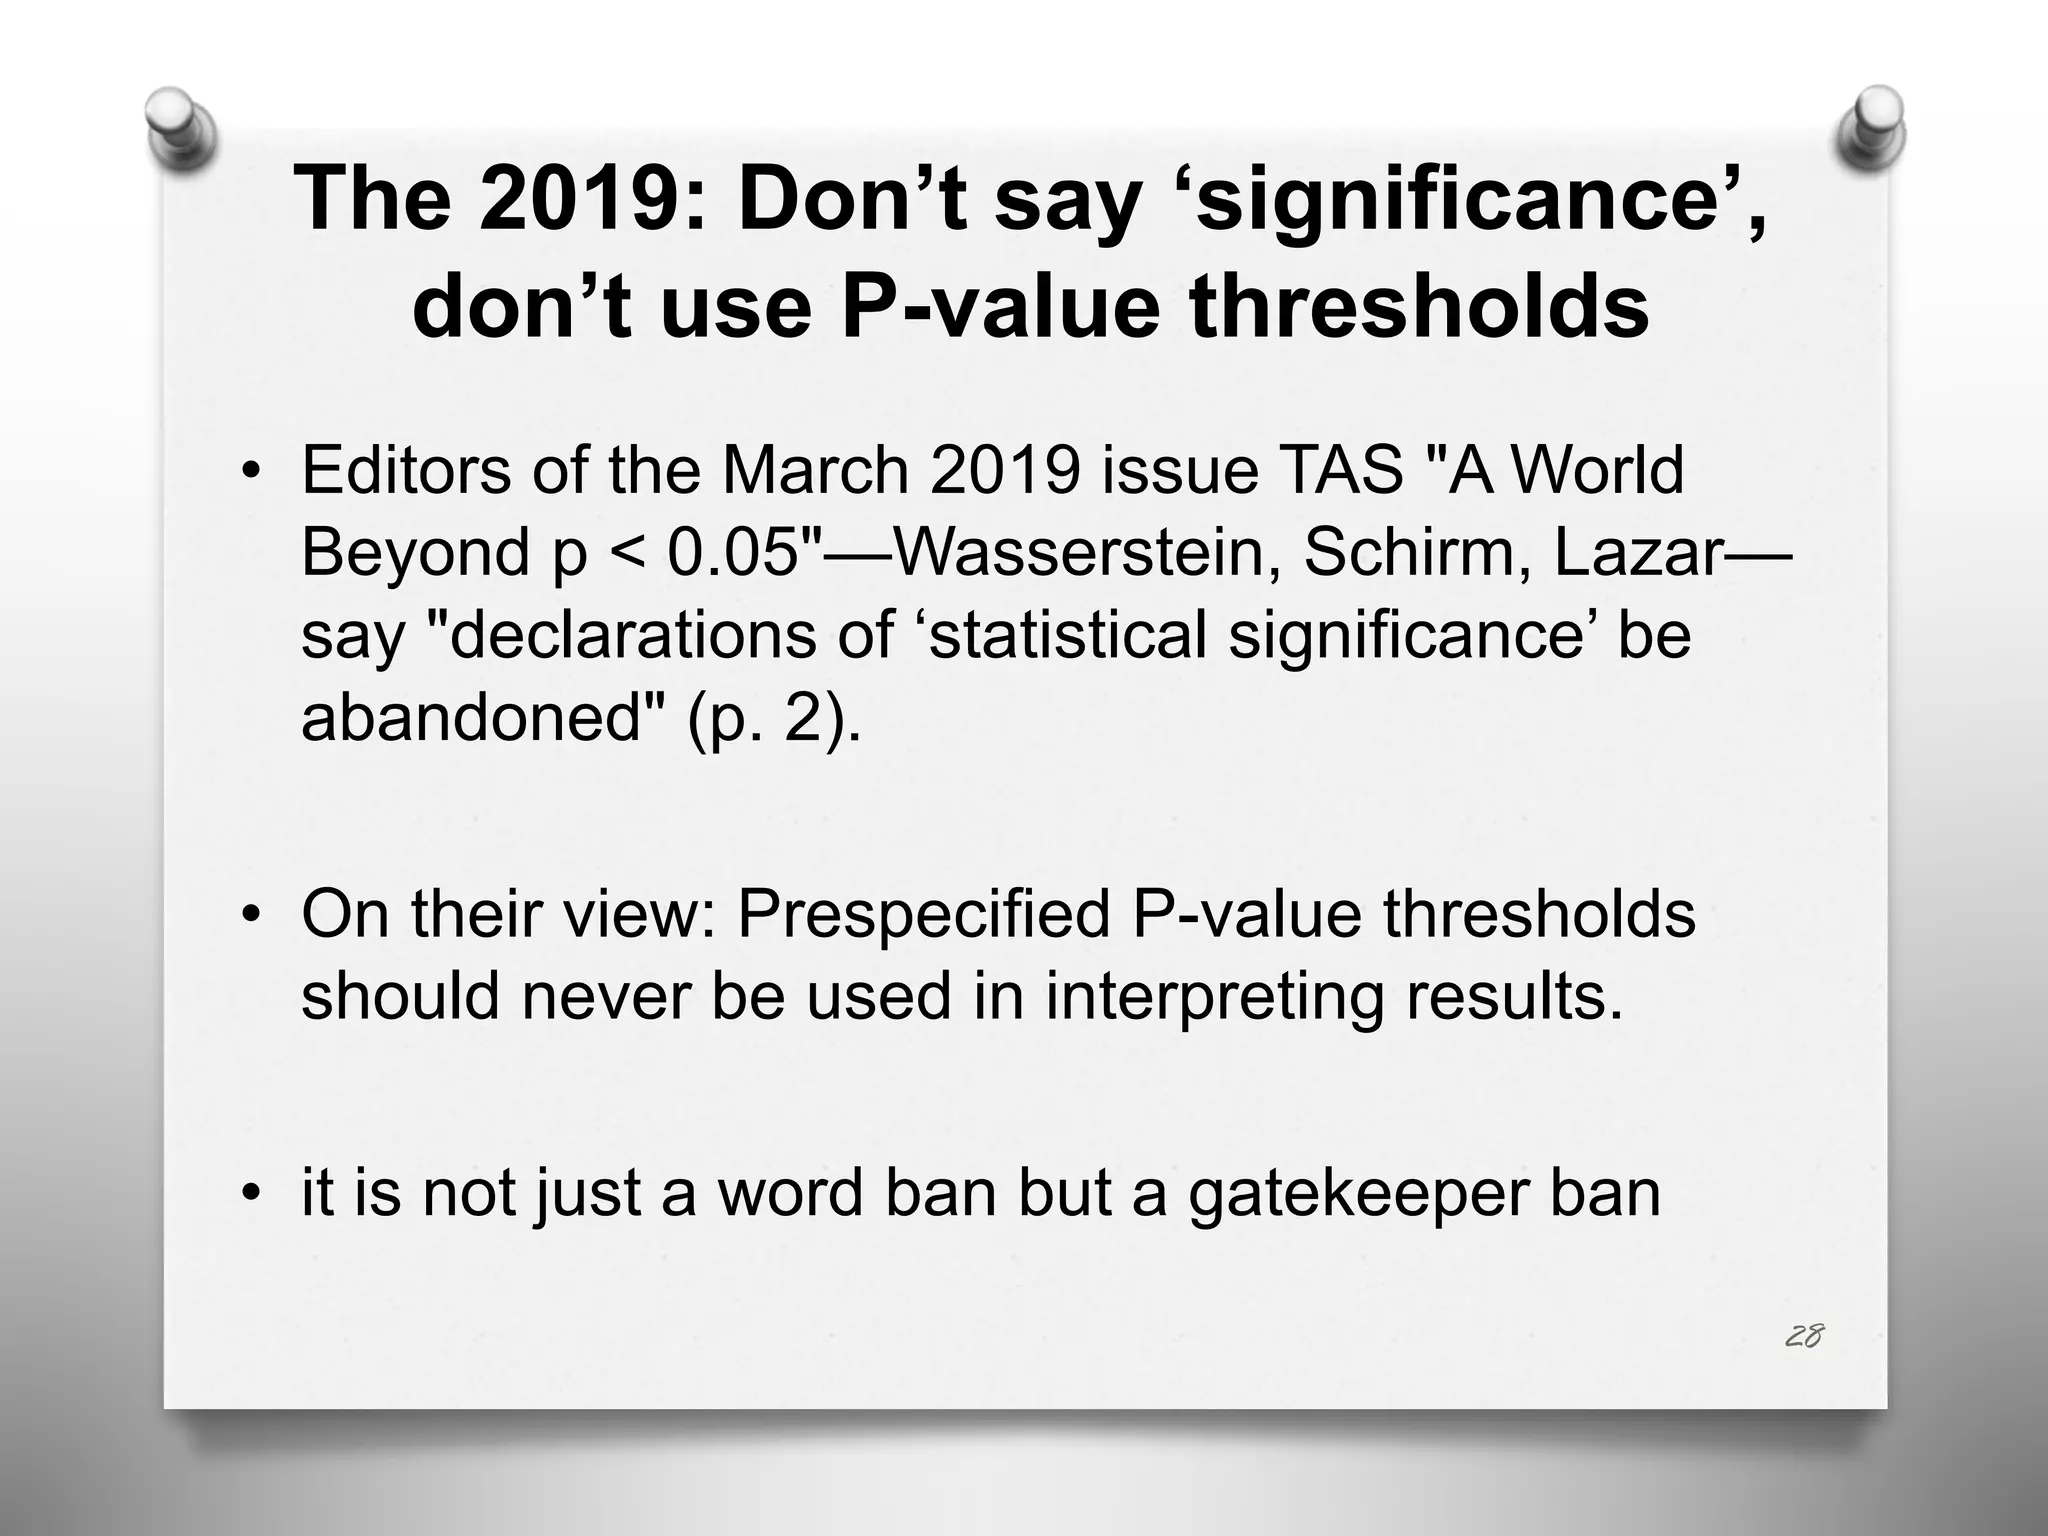
• Wasserstein, R., Schirm, A. & Lazar, N. (2019). Moving to a World Beyond “p < 0.05”
[Editorial]. The American Statistician, 73(S1), 1–19.
https://doi.org/10.1080/00031305.2019.1583913](https://image.slidesharecdn.com/d-200210215313/75/P-Value-Reforms-Fixing-Science-or-Threat-to-Replication-and-Falsification-43-2048.jpg)


